This website works best with a newer web browser such as Chrome, Firefox, Safari or Microsoft
Edge. Internet Explorer is not supported by this website.
A series of recent coronal mass ejections from the sun cased a severe geomagnetic storm on earth. On the evening of 11 November 2025 into the early morning of the 12th, this resulted in a very strong aurora borealis event visible across much of the continental United States. Reports came... Read More
A series of recent coronal mass ejections from the sun cased a severe geomagnetic storm on earth. On the evening of 11 November 2025 into the early morning of the 12th, this resulted in a very strong aurora borealis event visible across much of the continental United States. Reports came as far south as southern Alabama (witness this social media post from the Mobile, AL, NWS office). Much of the central and southeastern United States was cloud-free last night, opening up a rare opportunity for vast swaths of Americans to view such a unique phenomenon. The night microphysics RGB identifies where the clear areas were; the large pink regions represent the areas with clear skies as of 0300 UTC on the 12th.
The Day-Night Band on VIIRS is capable of showing what the aurora look like from the satellite view. The following image is a composite of multiple VIIRS overpasses on NOAA-21 as captured by direct broadcast antennas. Note that the peak band of light penetrated into the continental United States. The moon phase was a waning gibbous at roughly 55% illumination, providing some additional light for the clouds.
The NOAA Space Weather Prediction Center anticipates another severe geomagnetic storm from the evening of the 12th into the 13th. As such, there may be additional aurora viewing opportunities then.
November 10, 2025 marks the 50th anniversary of one of the most-remembered weather-related disasters of all time: the sinking of the Edmund Fitzgerald. This ship was an ore freighter that sailed the Great Lakes, ferrying taconite pellets from the ports along the western edge of Lake Superior to the many... Read More
November 10, 2025 marks the 50th anniversary of one of the most-remembered weather-related disasters of all time: the sinking of the Edmund Fitzgerald. This ship was an ore freighter that sailed the Great Lakes, ferrying taconite pellets from the ports along the western edge of Lake Superior to the many steel mills that dot the shores of the lakes. At the time of its construction, it was the largest ship ever to ply the waters of the Great Lakes with a length of 729 feet and a carrying capacity of over 26,000 tons. On its fateful final voyage, it met with a significant midlatitude cyclone which created tremendous waves, eventually overwhelming the ship and forcing it to the lake bed, a quarter of a mile below the water’s surface. All 29 sailors aboard were lost. The story of this ship and its last trip have captivated the public ever since, in large part due to the haunting ballad “The Wreck of the Edmund Fitzgerald” by Canadian singer-songwriter Gordon Lightfoot.
The CIMSS Satellite Blog has previously remarked on the ship’s sinking on the 35th and 40th anniversaries. However, one aspect of scientific meteorology that makes it such an interesting field is that technology continues to progress and new techniques can be applied to old data to learn something new. In this case, CIMSS’s partners at the SSEC Satellite Data Services group have been busy digitizing early generation satellite observations, making these old views of the planet available for a new generation of analysis. At the same time, model reanalysis has become an important part of atmospheric research. In a reanalysis, a modern numerical weather model is run on weather events of the past using the data that were available at the time. This approach creates a continuous gridded view of the atmosphere at a far higher spatial and temporal resolution than was available when those events were new. The most widely-used reanalysis is the ERA5, which is overseen by the European Centre for Medium-range Weather Forecasts (ECMWF) and is available for every hour from January 1940 to the present day. If you want to see what the weather was like on D-Day, the day the Beatles landed in America, or (if you’re less than 85 years old) your birthday, it’s all there. In this case, we can pair the reanalysis of the surface weather conditions with the newly digitized satellite observations to take a fresh look at one of the most notable storms 50 years after it happened.
The Synchronous Meteorology Satellite (SMS) series of satellites was the precursor to the venerable GOES satellite series that has been serving our society for 50 years. SMS was designed to follow the experimental Applications Technology Satellite (ATS) series, which was the first to demonstrate the utility of geostationary satellites. The ATS satellites were primarily designed for communications needs, but they carried some meteorology equipment on board. By contrast, the SMS satellites were designed from the ground up to support meteorology needs and thus represented the United States of America’s first dedicated geostationary meteorology satellites. A handful of images from the SMS era have survived, including from November of 1975.
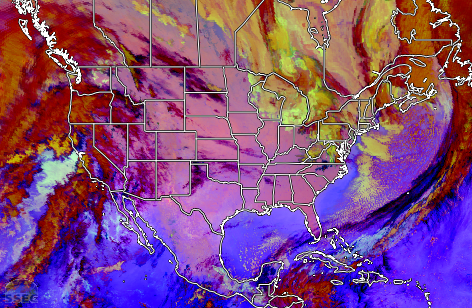
This view from SMS-2 shows the full-disk IR view from 2315 UTC (5:15 PM CST) on 9 November 1975, just about a day before the sinking. The ship had left the twin ports of Duluth, MN, and Superior, WI, three hours earlier. This era is a long way away from today’s fast and frequent scans that can specifically target the continental United States, and so satellite imagery was sparse. This full-disk view is one of the few archived images from that day, and for the past fifty years this full-disk view has been the only perspective of this storm from SMS-2. It’s a challenging image to interpret, however, as the oblique view of the Great Lakes makes it very hard to discern exactly what is taking place.
This is where modern technology can make a difference.
The SSEC Satellite Data Services group has taken these analog images, digitized them, and geolocated them. This enables the older images to be remapped into any projection that an end user would want. The above image is the same picture as before, but projected into the familiar continental United States (CONUS) view using McIDAS-V. This really helps identify the synoptic environment from the day before the sinking. A large midlatitude cyclone is clearly present over the upper midwest with the center of circulation over western Iowa. While the skies over Lake Michigan are largely clear, Lake Superior is heavily impacted by the cyclone. A squall line can be seen trailing southward from Iowa down to Texas, with deep convection creating significant storm activity as it propagates eastward.
We can couple the satellite views with the ERA5 reanalysis to get a more comprehensive view of what took place.
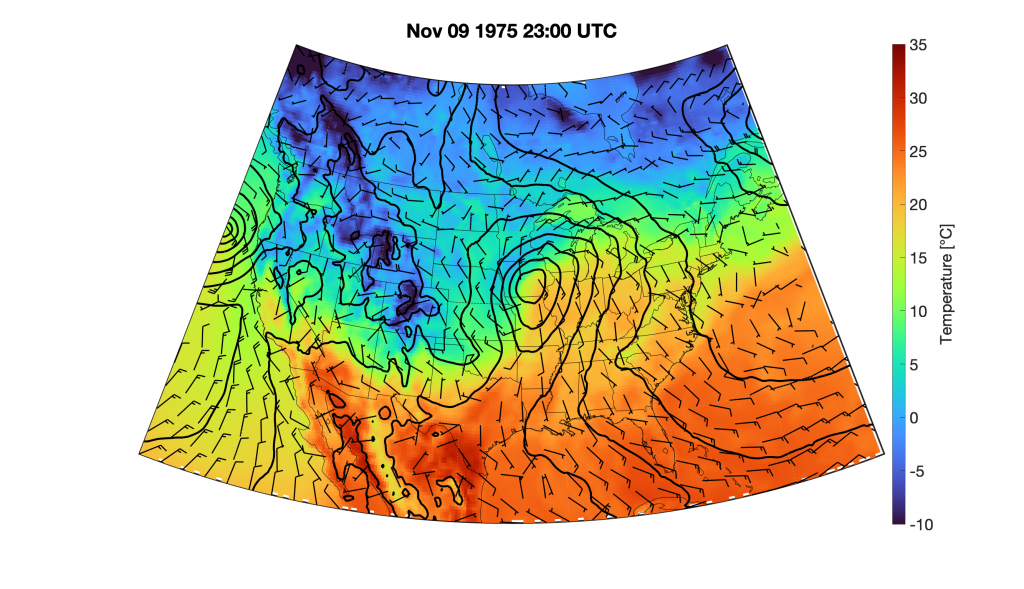
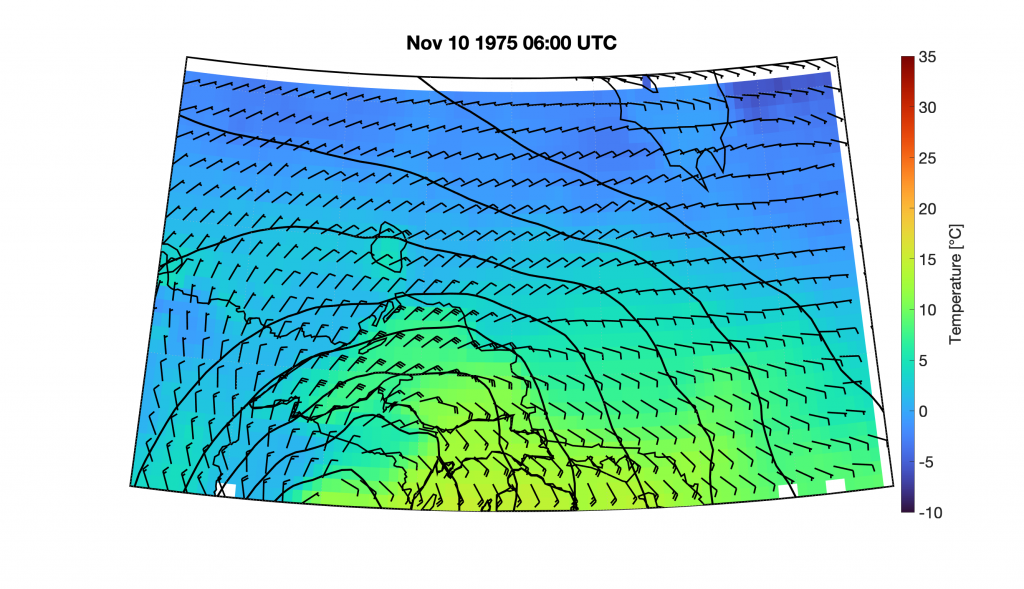
This ERA5 figure above depicts the environment at approximately the same time as the above satellite image. Solid contours represent isobars while the color field indicates the temperature in C. Wind barbs are in knots. The picture that emerges shows a textbook example of a midlatitude cyclone. Through the temperature gradients, both the cold front (running southward from Iowa to Texas) and the warm front (from Iowa to southern Ontario) can easily be seen. The isobars are elongated to the south, bending sharply around the cold front. Strong pressure gradients are found to the north and east of the low pressure system. The track taken by this storm is a classic example of a Panhandle Hook storm, so named for its origins near the Texas and Oklahoma panhandles and its sharp northward turn (or “hook”) to the upper Midwest. That’s clearly evident in the animation of the ERA5 from 0600 UTC on the 9th through 1400 UTC on the 10th (9:00 AM CST, about 10 hours before the wreck).
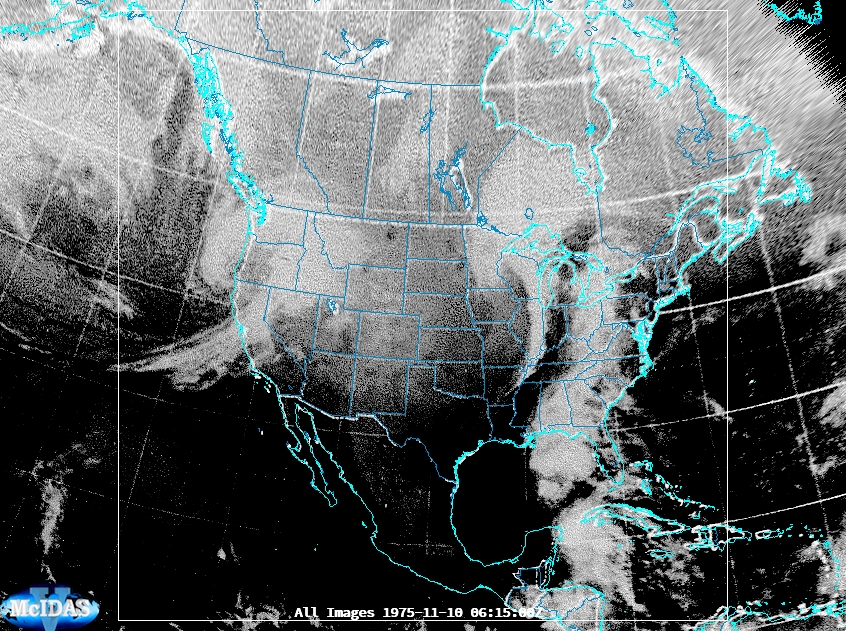
The next satellite view was another infrared view at 0615 UTC (12:15 AM CST) on the 10th, seven hours after the previous one. Here, we see that the cyclone has propagated further to the north, with the dry slot as far north as western Wisconsin. This storm is exhibiting the classic comma shape that forecasters have come to recognize as being the signature of a significant midlatitude cyclone; a similar system can also be seen on the west coast of CONUS. Note that this image bears the hallmarks of a digitized analog image: the white latitudes, longitudes, and borders are not from McIDAS-V but are baked into the original image.
Zooming in on the reanalysis at the same time shows what we would expect given the satellite image above. The center of low pressure is just off this map in south-central Wisconsin. The near-surface winds on western Superior are from the northeast at around 25 to 30 knots, while the winds further east on the lake are slower and more easterly to southeasterly. Surface temperatures on the lake are warmer than over land since the water is still retaining summertime heat.
To avoid the worst of the waves being generated by the fast winds over the western part of the lake, the Edmund Fitzgerald took a northerly path, hugging close to the south edge of Isle Royale then heading due east from there toward Michipicoten Island and the lake’s eastern shore against the province of Ontario. Given the synoptic setup at the time, this meant that the fetch, or distance that the winds were blowing along the lake, was short. A longer fetch means that the waves are blowing a longer distance across the lake, which enables the winds to build up stronger and deeper waves.
Of course, the synoptic pattern was not stationary. The low pressure system at the center of the storm continued to track to the north-northeast. As the system passed over the lake, the direction of the surface wind changed, as is clearly visible in the reanalysis animation below. This animation covers from 0600 UTC to 2000 UTC (Midnight to 2:00 PM CST). The ship found itself in a much more treacherous environment thanks to the passage of the cyclone. Where before it was somewhat sheltered from the large waves due to the low fetch of the winds, it now was being battered by significant waves that were building up over a distance of well over a hundred miles.
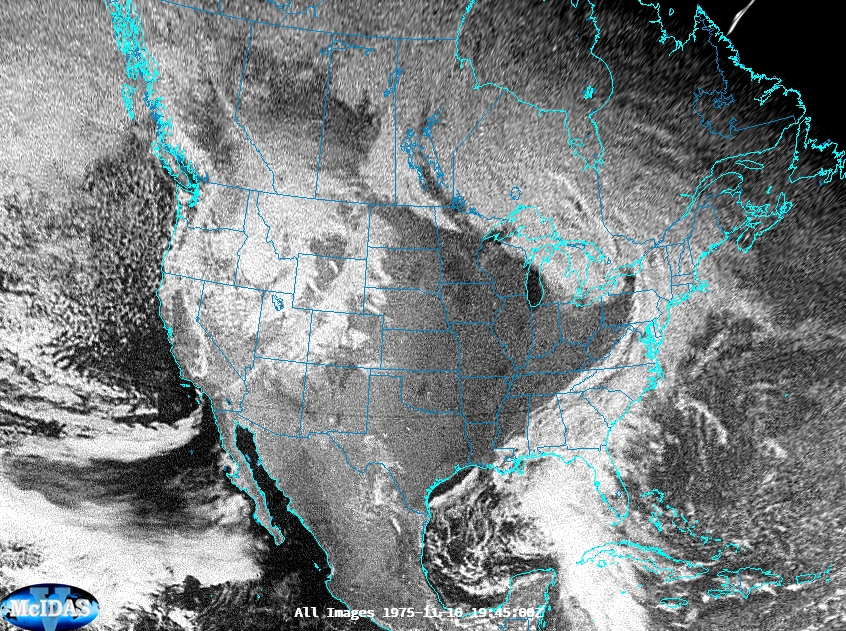
The previous satellite images were from the infrared imager, but a visible wavelength image also exists. The following image was taken at 1945 UTC (1:45 PM CST), about four hours before the sinking. This time is roughly the same time as the end of the reanalysis animation above. Here we see that the main story is the large weather system dominating the eastern half of the United States. By this time the center of circulation has penetrated as far north as central Ontario, but much of the midwest is now clear as fair skies followed the passage of the squall line from the day before. Despite the course resolution of the satellite imager, you can even make out individual convective cells in the Pacific near the Washington and Oregon coasts.
The last five hours of the ship’s life were a race to the harbor at Whitefish Bay. Unfortunately, the Fitzgerald was in a position that made it extremely vulnerable to the weather. The winds were from the northwest at 40+ knots. This was close to the worst case scenario, as gale force winds were blowing along the longest possible fetch for that location. Reports from a nearby ship, the Arthur M. Anderson, showed sustained waves as high as 25 feet. This next reanalysis image shows the conditions around the time the ship sank at 0000 UTC on the 11th (6:00 PM CST, 7:00 PM EST on the 10th). The red star marks the location of the shipwreck. While the ship was only 15 miles away from the safe harbor, the very strong winds and immense waves were too much. The exact mechanism by which the ship sank remains a topic of debate (including hatch failure, grounding on shoals, or stress fractures) but all agree that the wind and waves were the key to the ship’s fate.
To give a perspective on how these historical sources of satellite data have been preserved over the years, here is the polar-orbiting satellite view for the same day, 10 November 1975. This is a consolidation of all of the nighttime nodes for the VHRR instrument aboard the NOAA-4 satellite. By the time this satellite passed overhead, the cyclone had moved on into Ontario. Note that this is just a physical image in a book. The recent efforts of the Satellite Data Services group has been to take images like these and digitally assign latitudes and longitudes to them so that they can be reprojected and analyzed using modern software.
Digitizing the polar orbiting and geostationary satellite images enables us to view all of these sets of data in sequence. Here is an animation showing both SMS-2 and NOAA-4 remapped to the same field of view. While this is a far cry from today’s 10 minute full disk views, it still enables an unprecedented look at how the Fitzgerald storm evolved throughout its life.
One of the great success stories in meteorology over the past fifty years has been how the advances in that field have led to great improvements in safety in other fields. One of the reasons that the Edmund Fitzgerald has captured public imagination for half a century is that it remains the last major maritime disaster on the Great Lakes. The floors of the lakes are littered with dozens of shipwrecks, and and hundreds or even thousands of sailors have lost their lives over the centuries. However, great advances in weather observation and forecasting, including many pioneered at CIMSS and SSEC, have helped foster a new era of safe transportation across these vast inland seas.
CIMSS’s sister institution, the Cooperative Institute for Great Lakes Research (CIGLR) at the University of Michigan, will soon begin work on a Great Lakes wave height reanalysis. So, perhaps for the 55th anniversary, we will be able to take yet another new look at this event.
Special thanks to Mat Gunshor, Douglas Schumacher, Jerry Robaidek, Scott Bachmeier, Dave Santek, and Sam Gunshor for their assistance in locating and processing the historical satellite data. Abby Hutson of CIGLR provided insight into the current state and future of Great Lakes wave reanalyses. Joleen Feltz and Forest Tucker tracked down the paper copy of the polar-orbiting view.
1-minute Mesoscale Domain Sector GOES-19 (GOES-East) Infrared images (above) showed a lake effect cloud band — exhibiting cloud-top infrared brightness temperatures as cold as -49 C (darker shades of orange) — over far southern Lake Michigan that was moving inland across parts of northwest Indiana and northeast Illinois after midnight on... Read More
1-minute GOES-19 Infrared images with overlays of GLM Flash Extent Density (large blue/cyan pixels) and GLM Flash Points (white dots), along with plots of surface reports (red) and fixed buoy reports (yellow), from 0501-1000 UTC on 10 November [click to play MP4 animation]
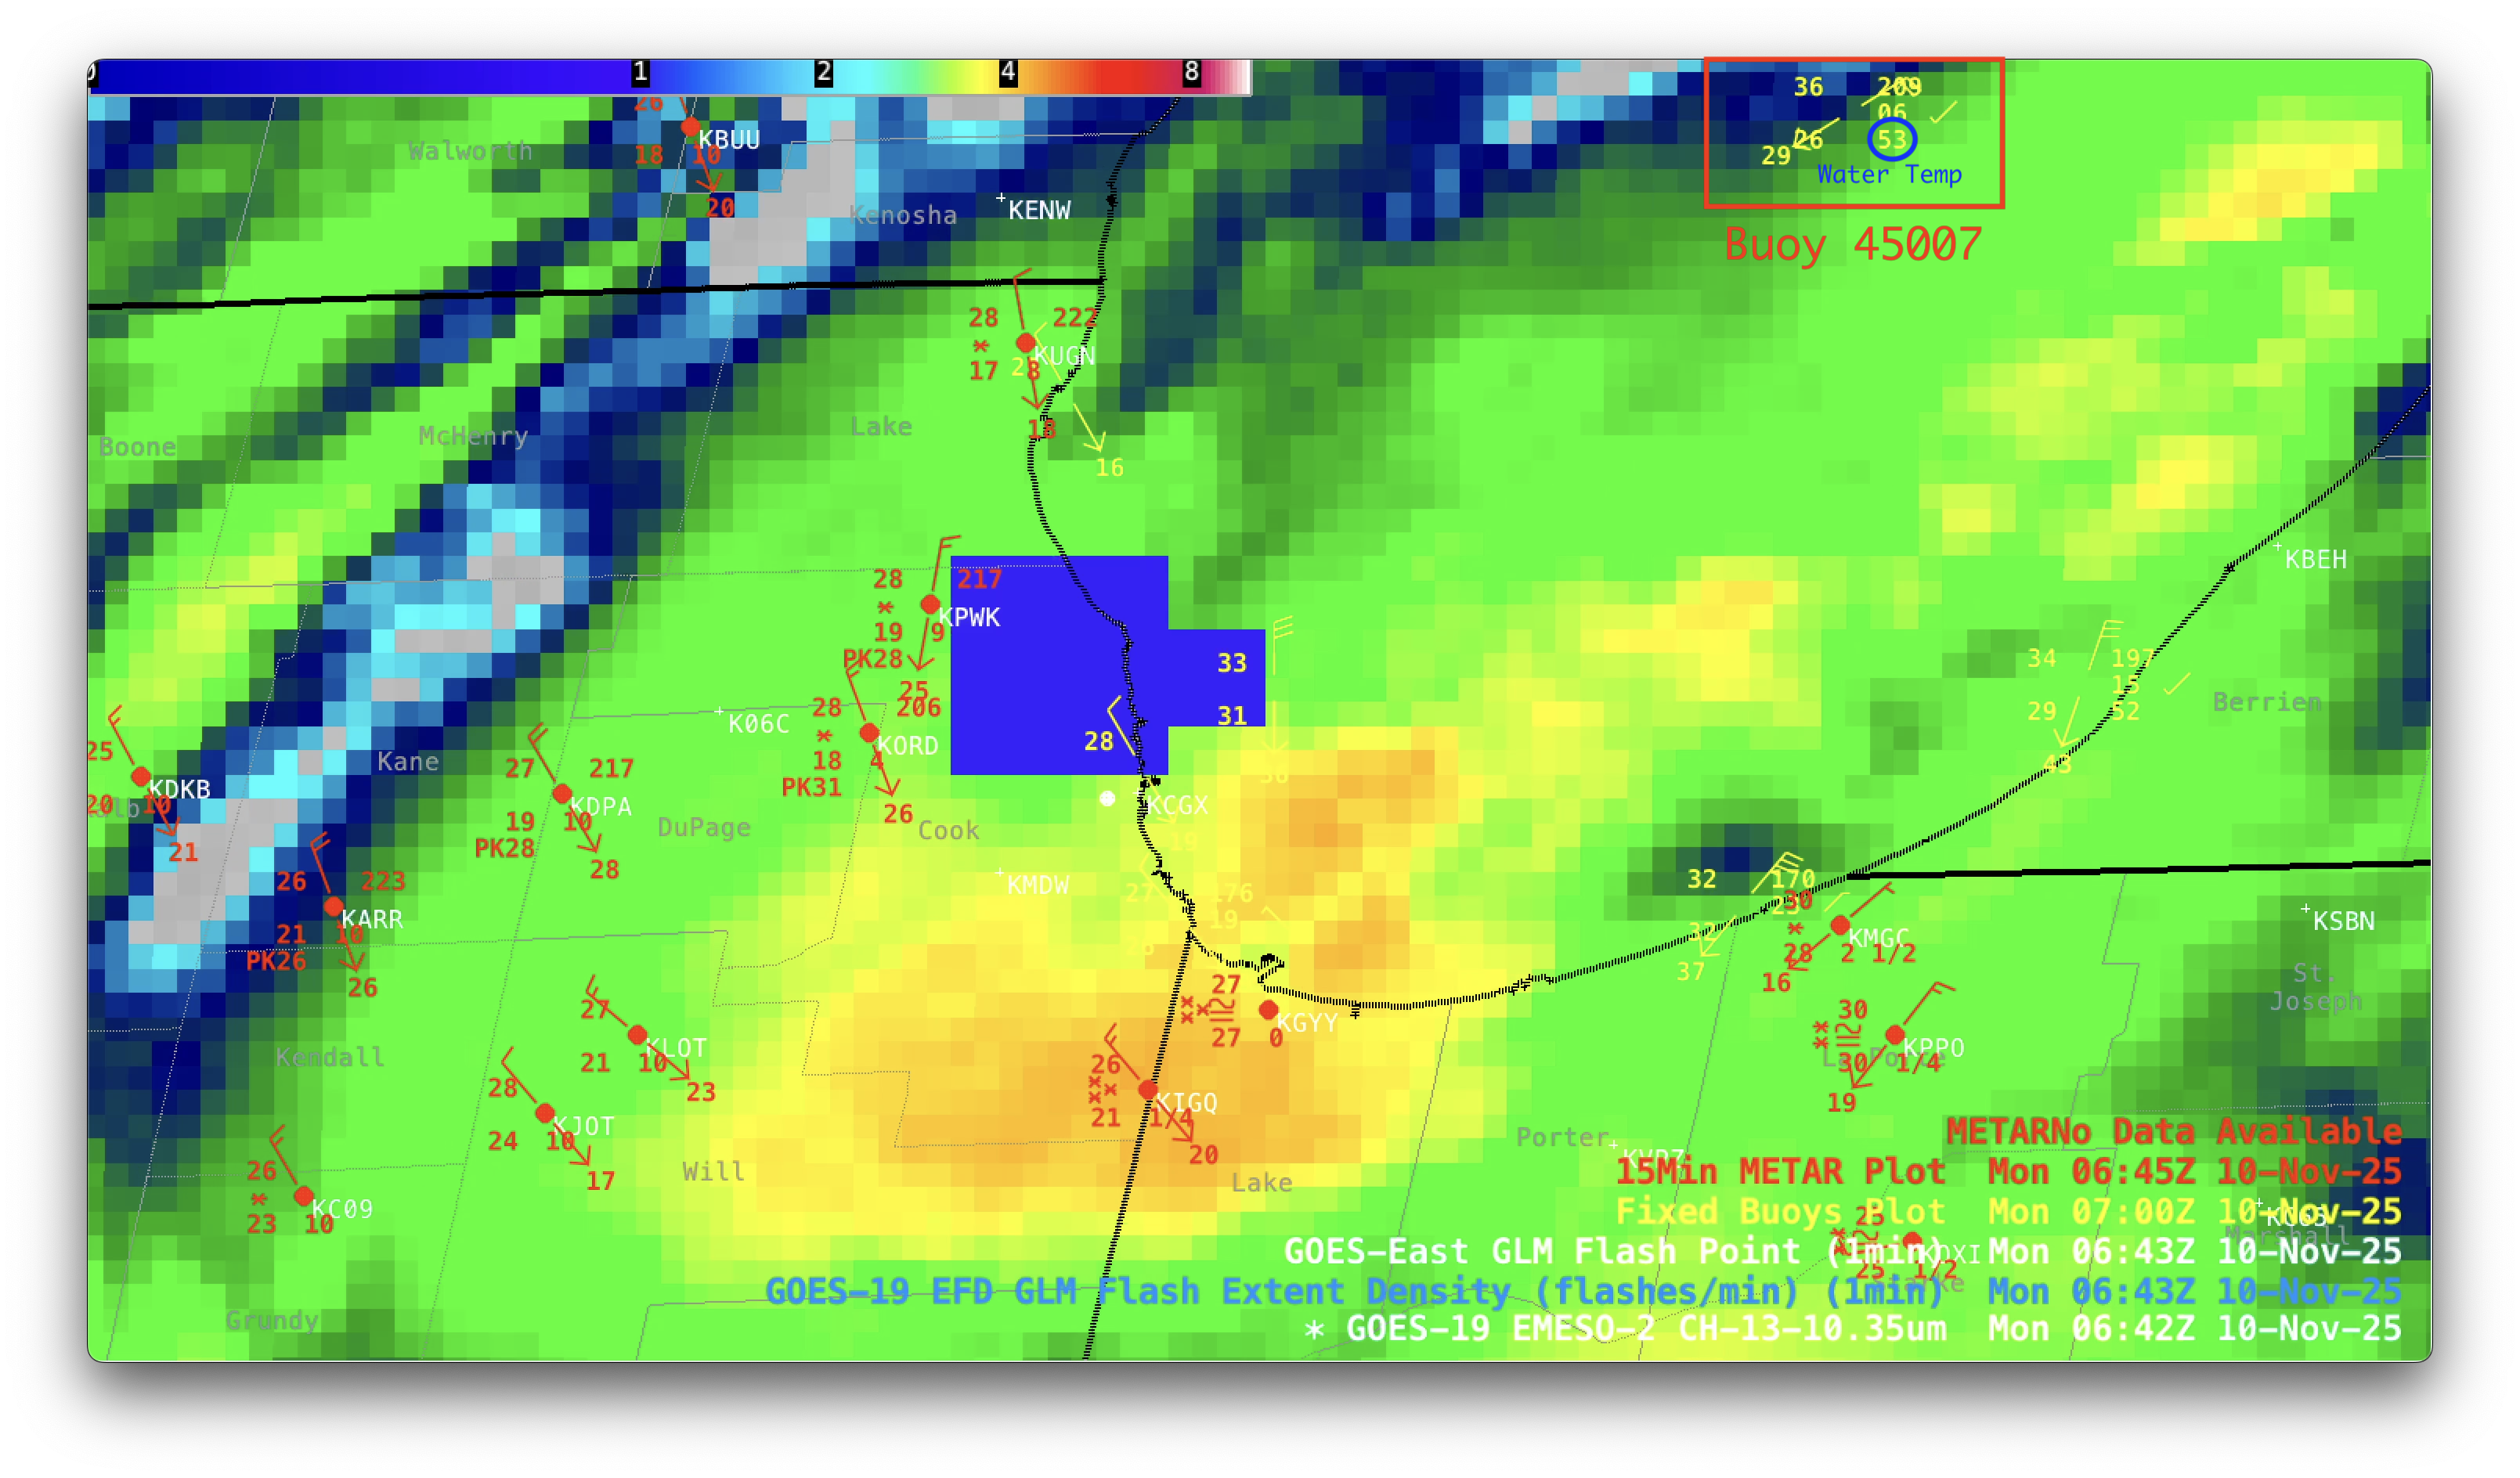
1-minute Mesoscale Domain Sector GOES-19 (GOES-East) Infrared images (above) showed a lake effect cloud band — exhibiting cloud-top infrared brightness temperatures as cold as -49 C (darker shades of orange) — over far southern Lake Michigan that was moving inland across parts of northwest Indiana and northeast Illinois after midnight on 10 November 2025. Air temperatures in the mid-30s F flowing across lake buoy water temperatures of 53ºF created sufficient instability in the marine boundary layer to enhance and sustain these lake effect cloud bands.
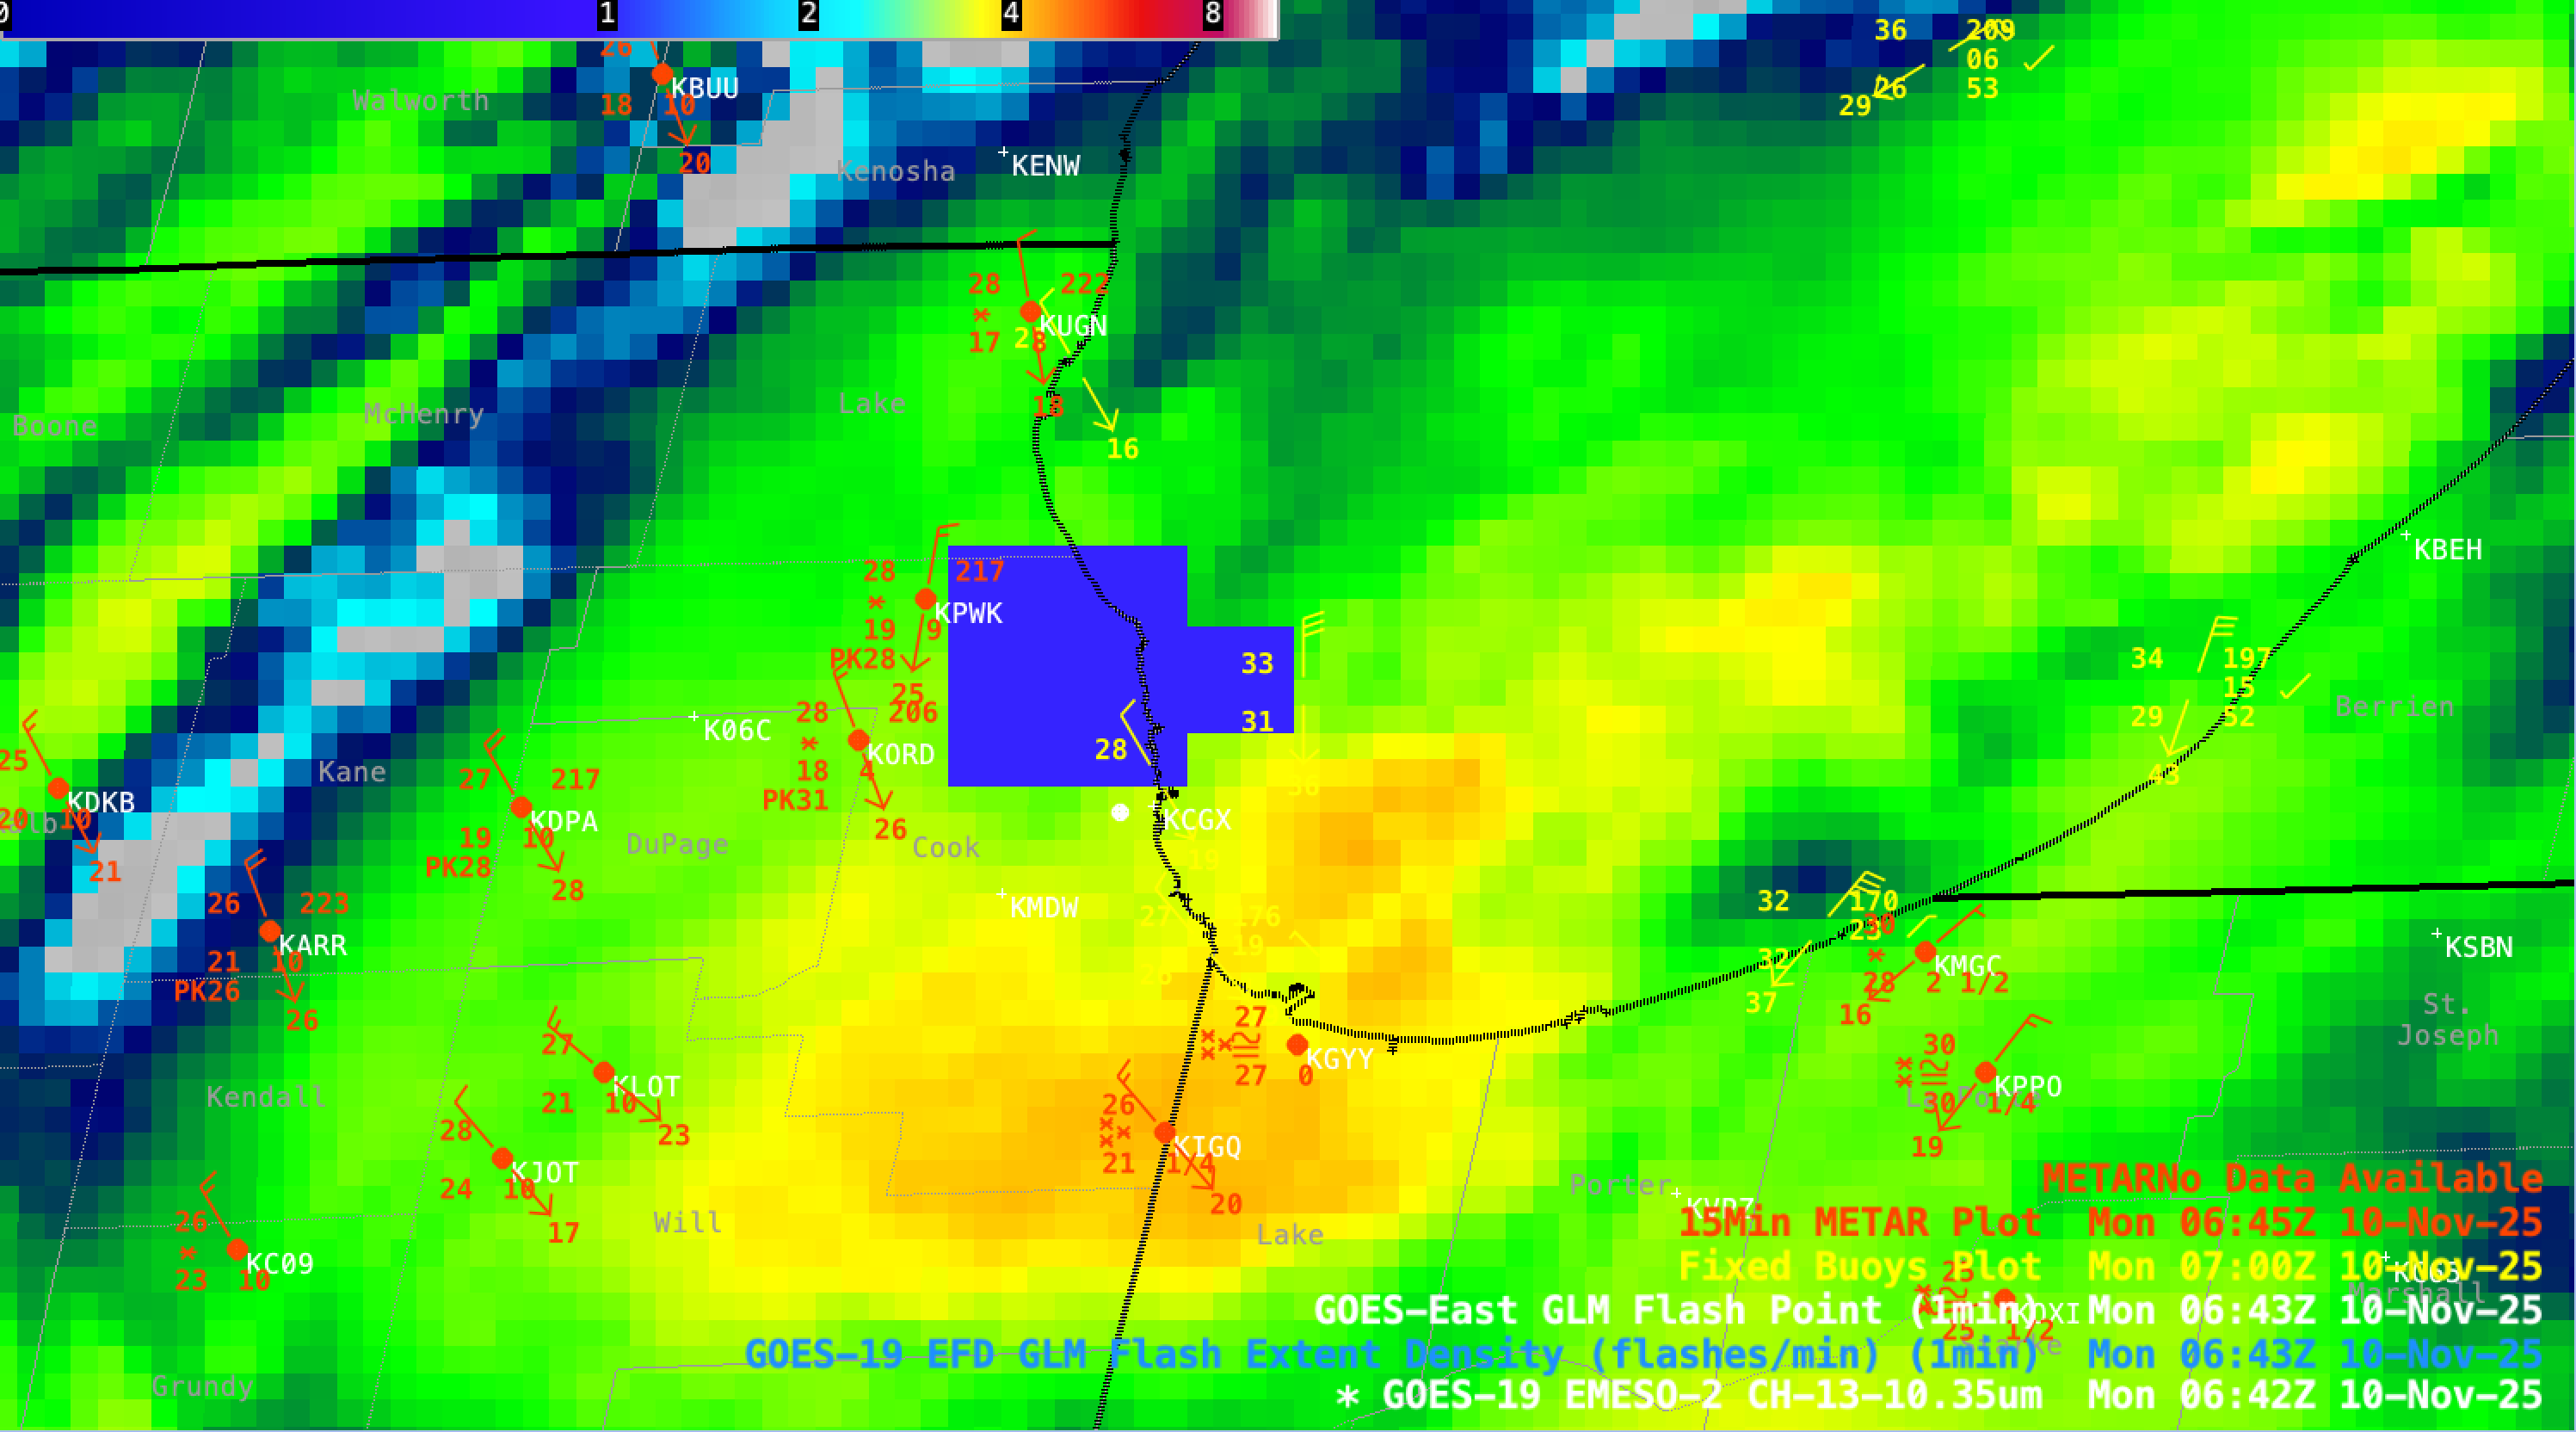
Overlays of GLM Flash Extent Density and Flash Points highlighted 3 brief instances of satellite-detected lightning activity — along the coast of Indiana at 0519 UTC, and then along the coast of Illinois (near Chicago) at 0622 UTC and 0642 UTC (below). Note that the GLM Flash Points are parallax-corrected (to match their location at the surface), while the GLM Flash Extent Density gridded product is *not* parallax-corrected (and therefore exhibits a slight NNW displacement in GOES-19 imagery). None of the nearby METAR sites explicitly reported thundersnow or lightning around the times of these GLM signatures.
GOES-19 Infrared image at 0519 UTC on 10 November with overlays of GLM Flash Extent Density (large blue/cyan pixels) and GLM Flash Points (white dots), along with plots of surface reports (red) and fixed buoy reports (yellow) [click to enlarge]
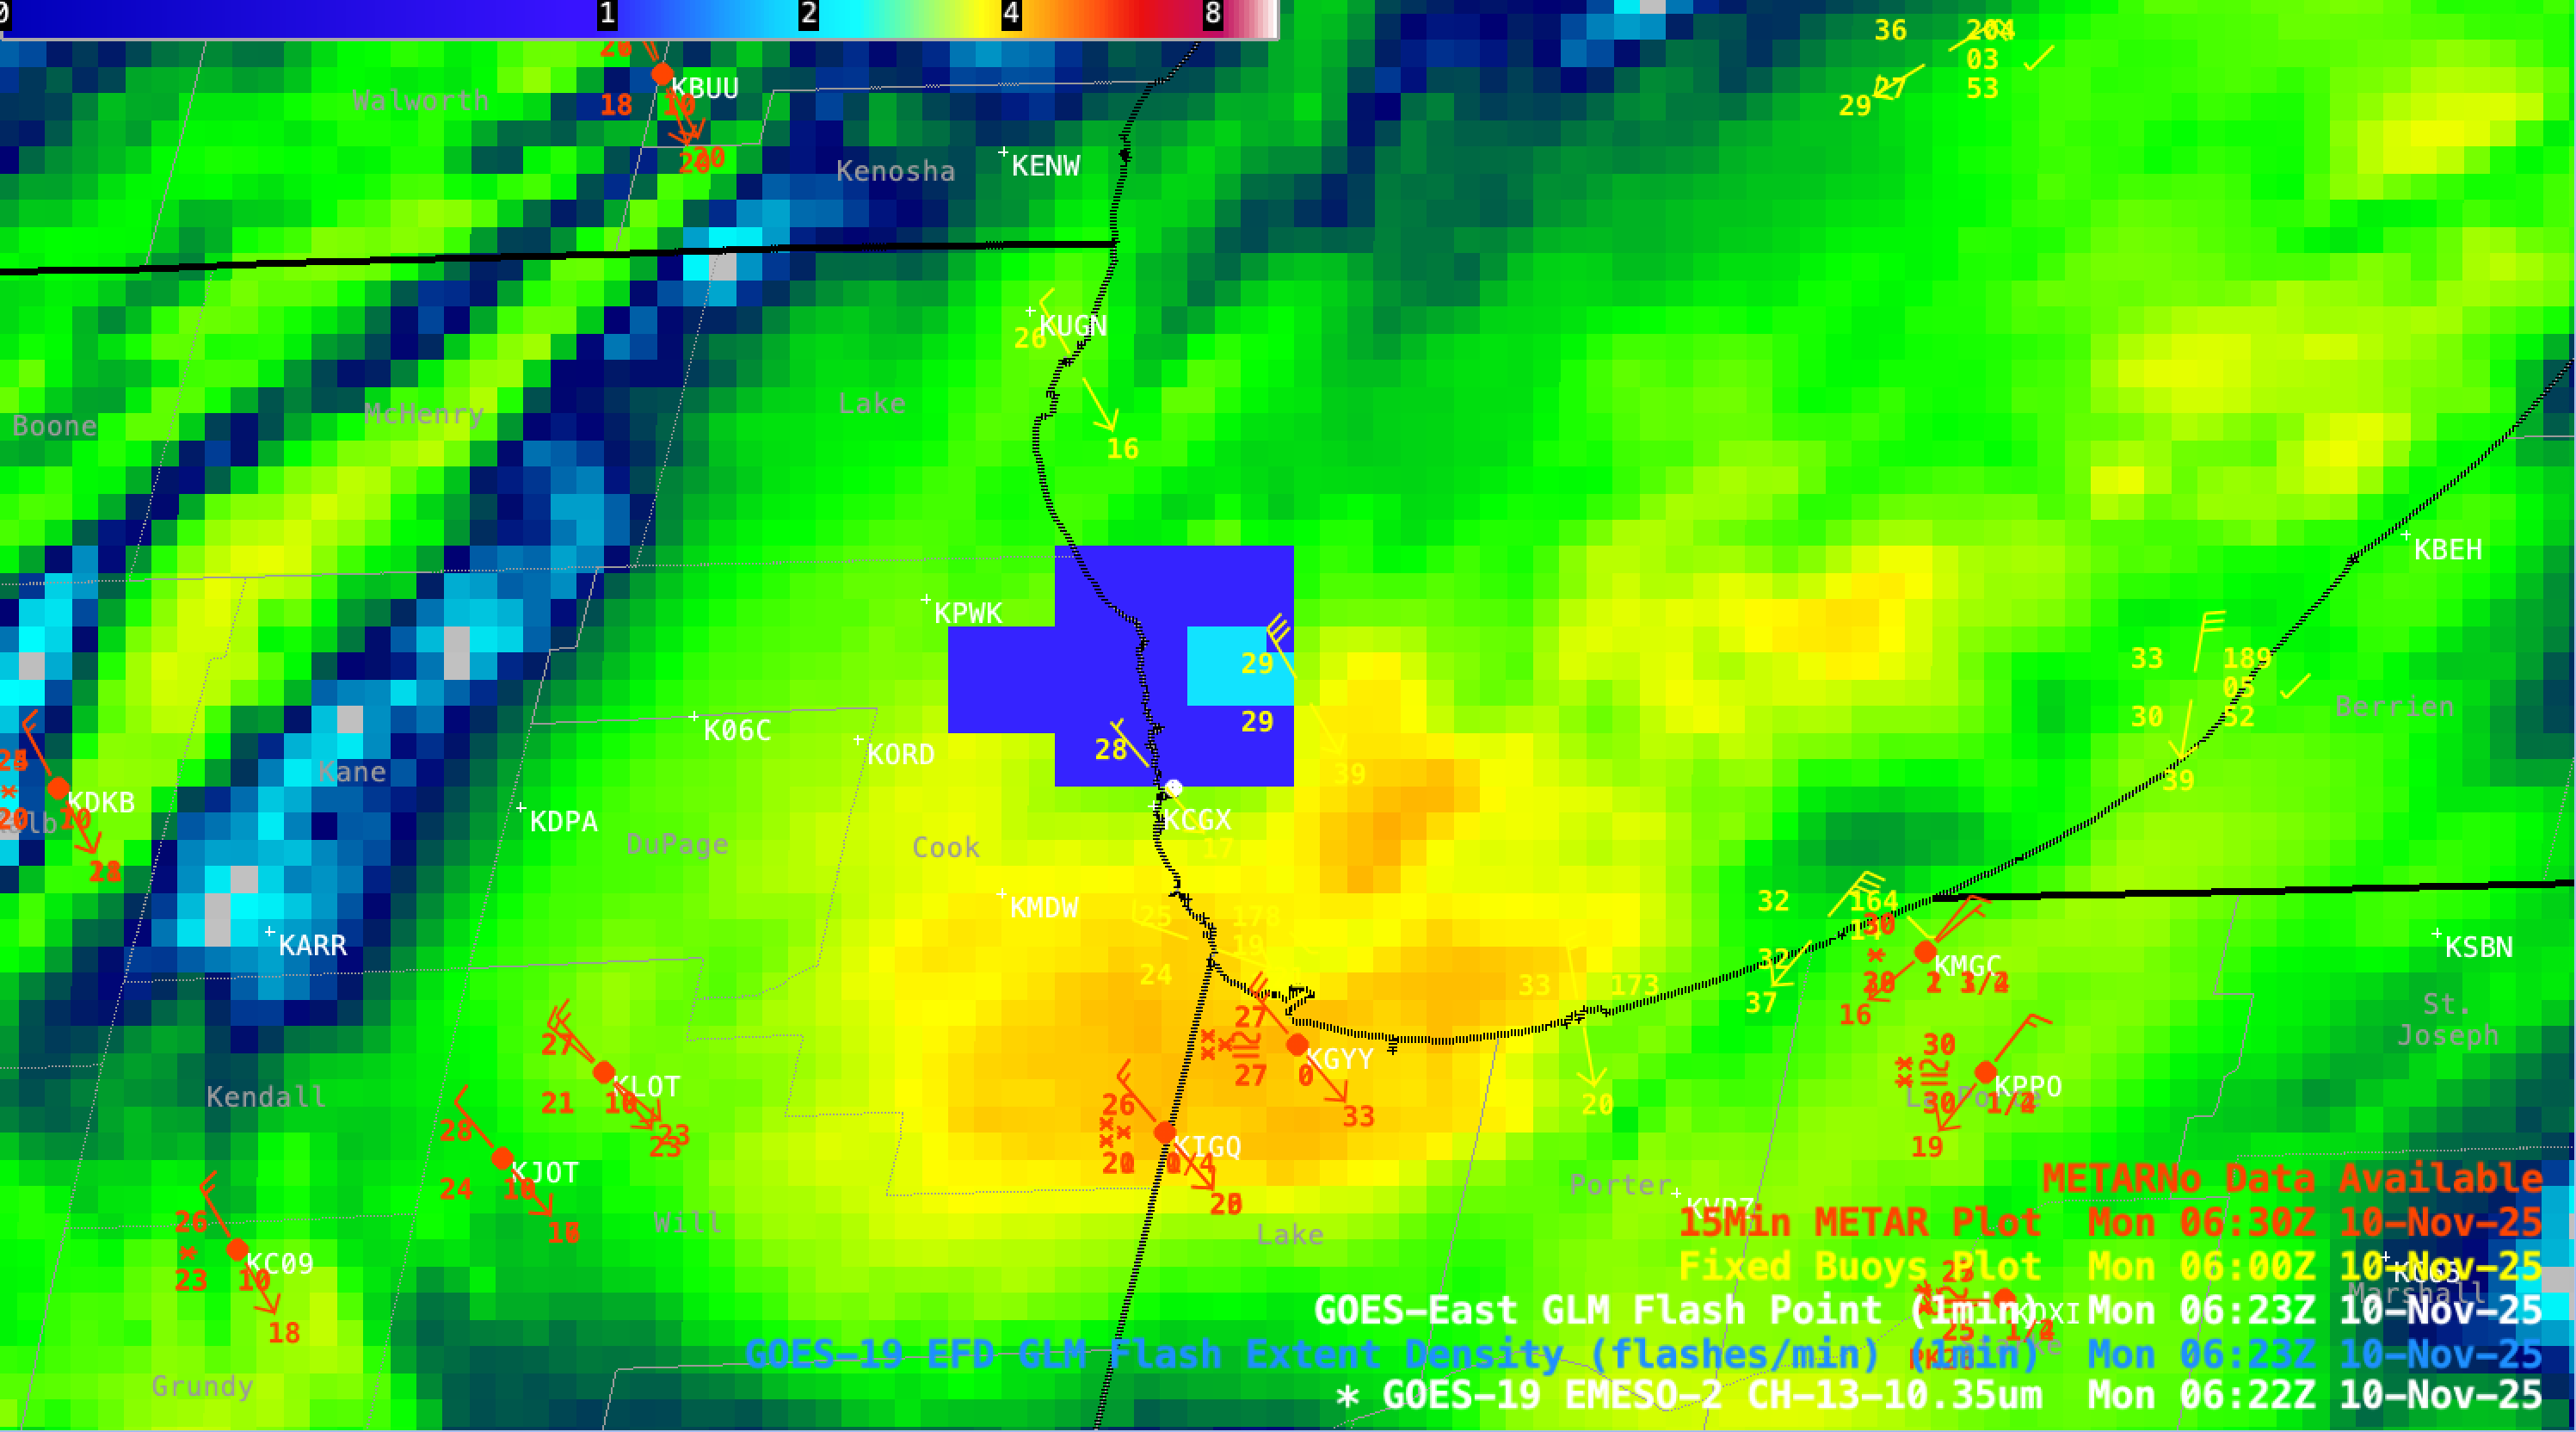
GOES-19 Infrared image at 0622 UTC on 10 November with overlays of GLM Flash Extent Density (large blue/cyan pixels) and GLM Flash Points (white dots), along with plots of surface reports (red) and fixed buoy reports (yellow) [click to enlarge]
GOES-19 Infrared image at 0642 UTC on 10 November with overlays of GLM Flash Extent Density (large blue/cyan pixels) and GLM Flash Points (white dots), along with plots of surface reports (red) and fixed buoy reports (yellow) [click to enlarge]
1-minute GOES-19 Infrared images with overlays of GLM Flash Extent Density (large blue/cyan pixels) and GLM Flash Points (white dots), along with plots of surface reports (red) and fixed buoy reports (yellow), from 0641-1300 UTC on 10 November [click to play MP4 animation]
Farther to the north, another lake effect snow band was moving inland across far southeast Wisconsin and extreme northeast Illinois (above). No lightning activity was seen in GLM data with this lake effect cloud band, but it did produce as much as 13.0 inches of snow at Pleasant Prairie, Wisconsin (below).
Map showing Local Storm Reports of snowfall accumulations ending at 1400 UTC on 10 November
10-minute Full Disk scan GOES-18 (GOES-West) daytime True Color RGB + nighttime Dust RGB images created using Geo2Grid (above) showed a plume of resuspended volcanic ash (hazy shades of tan in True Color RGB, and shades of violet in Dust RGB) from the 1912 Novarupta-Katmai eruption in Alaska — which was being... Read More
10-minute GOES-18 daytime True Color RGB images and nighttime Dust RGB images, from 1900 UTC on 05 November to 2120 UTC on 07 November [click to play animated GIF | MP4]
10-minute Full Disk scan GOES-18 (GOES-West) daytime True Color RGB + nighttime Dust RGB images created using Geo2Grid(above) showed a plume of resuspended volcanic ash (hazy shades of tan in True Color RGB, and shades of violet in Dust RGB) from the 1912 Novarupta-Katmai eruption in Alaska — which was being transported offshore across the Shelikof Strait and over parts of Kodiak Island during 05-07 November 2025. Surface volcanic ash within the Valley Of Ten Thousand Smokes was being lofted by strong northwesterly winds that were being channeled through the valley.
According to this USGS Volcano Notice, the National Weather Service issued a SIGMET advising aviation interests that the maximum height of this resuspended ash was 6000 ft.
Trace amounts of resuspended ash fall were reported at Kodiak on 07 November (below).
Local Storm Report from Kodiak at 1900 UTC on 07 November


