
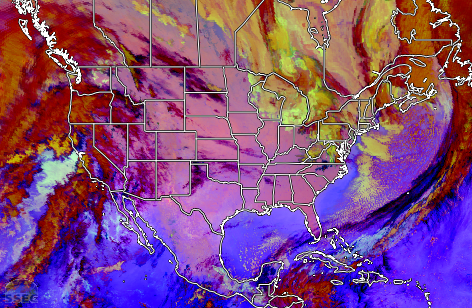
The Blue Origin New Glenn NG-2 mission launched from Cape Canaveral Space Force Station, Florida at 2055 UTC on 13 November 2025. A multi-panel display showing all 16 ABI spectral bands on the GOES-19 (GOES-East) satellite (above) revealed distinct thermal signatures in the 3 Water Vapor bands (08/09/10) at 2056 UTC, with... Read More

Multi-panel display showing all 16 ABI spectral bands of GOES-19, from 2051-2106 UTC on 13 November; KXMR denoted the Cocoa Beach rawinsonde site [click to play MP4 animation]
The Blue Origin
New Glenn NG-2 mission launched from Cape Canaveral Space Force Station, Florida at 2055 UTC on 13 November 2025. A multi-panel display showing all 16
ABI spectral bands on the GOES-19
(GOES-East) satellite
(above) revealed distinct thermal signatures in the 3 Water Vapor bands (08/09/10) at 2056 UTC, with a more subtle signature in the CO
2 band (16) and one faintly-brighter pixel in the Cirrus band (04). A signature of the rocket booster condensation cloud was evident in all 16 ABI spectral bands, closer to the coast. Unfortunately, there was no 1-minute GOES-19 Mesoscale Domain Sector coverage over that area — so only 5-minute CONUS Sector imagery was available.
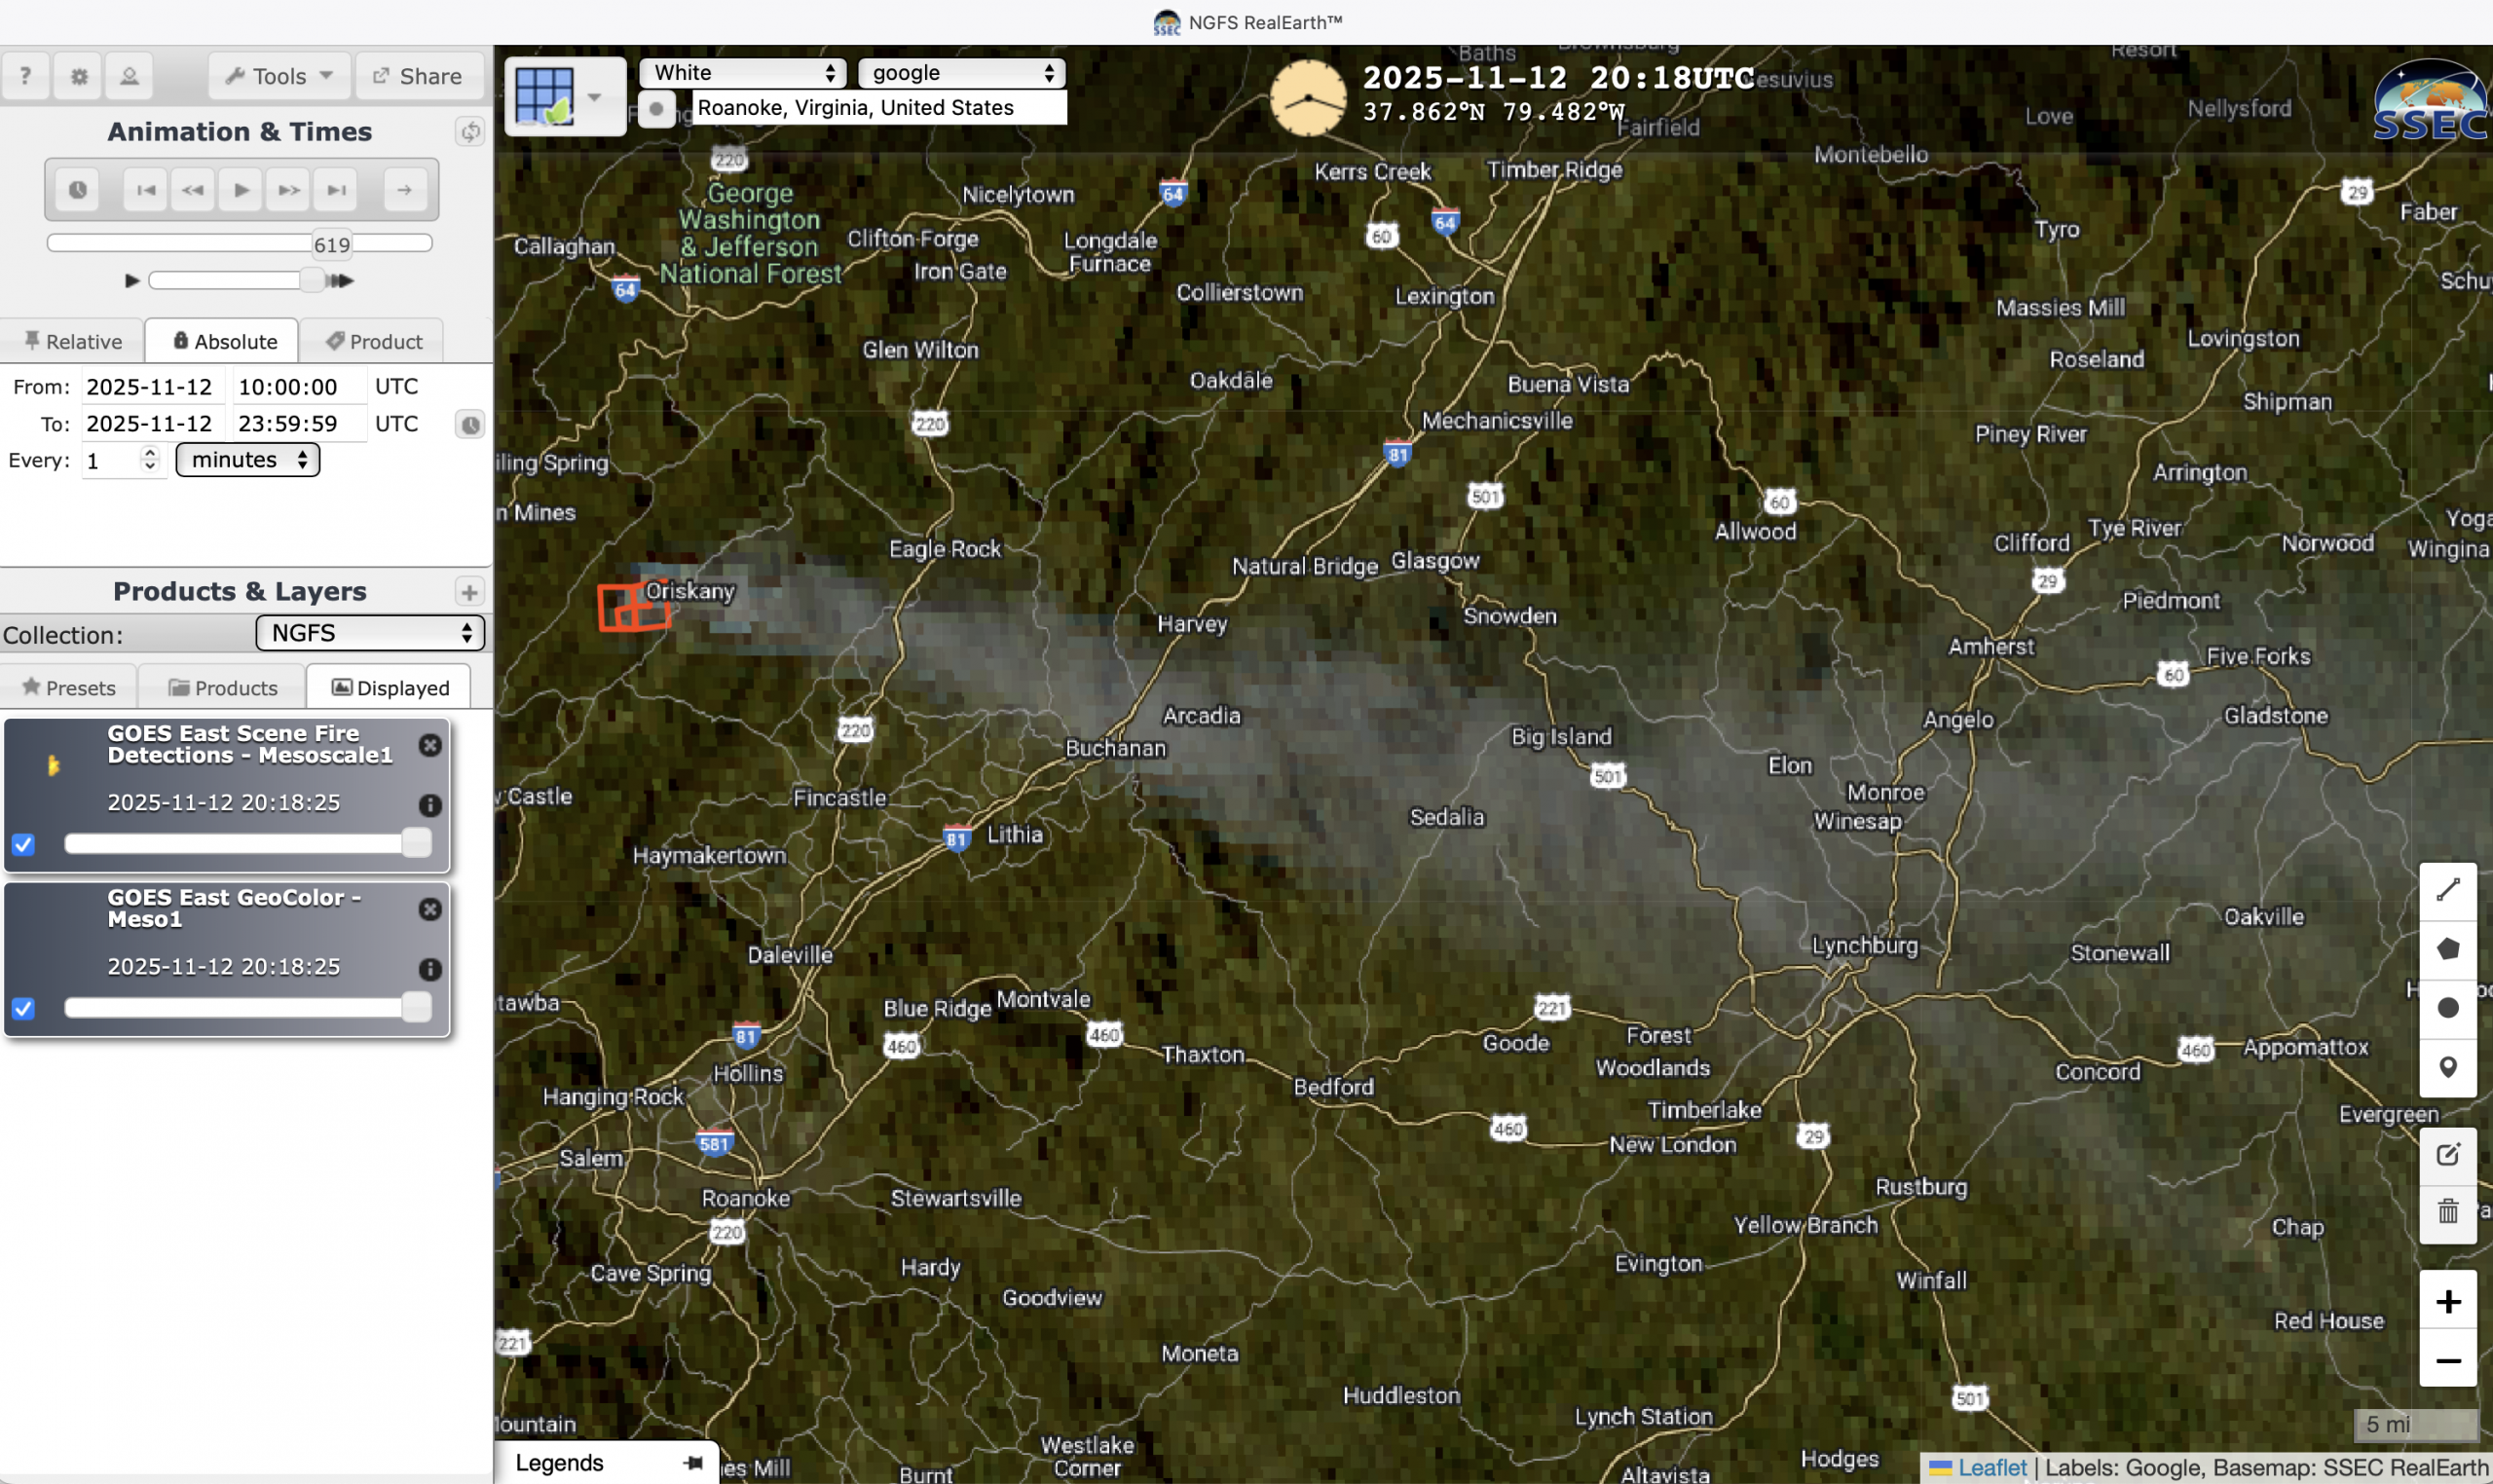
A slightly longer sequence of GOES-19 True Color RGB images (below) highlighted the rapid dissipation of the rocket booster condensation cloud as it drifted eastward away from the launch site. Farther inland, the dense smoke plume from a prescribed burn is apparent.

GOES-19 True Color RGB images, from 2051-2126 UTC on 13 November [click to play MP4 animation]
A plot of rawinsonde data from Cocoa Beach, Florida (KXMR) during the morning preceding the launch
(below) showed dry air aloft throughout much of the troposphere — which contributed to the fairly rapid dissipation of the rocket booster’s condensation cloud as it drifted away from the coast.
Plot of rawinsonde data from Cocoa Beach, Florida (KXMR) at 1100 UTC on 13 November [click to enlarge]
View only this post
Read Less


