This website works best with a newer web browser such as Chrome, Firefox, Safari or Microsoft
Edge. Internet Explorer is not supported by this website.
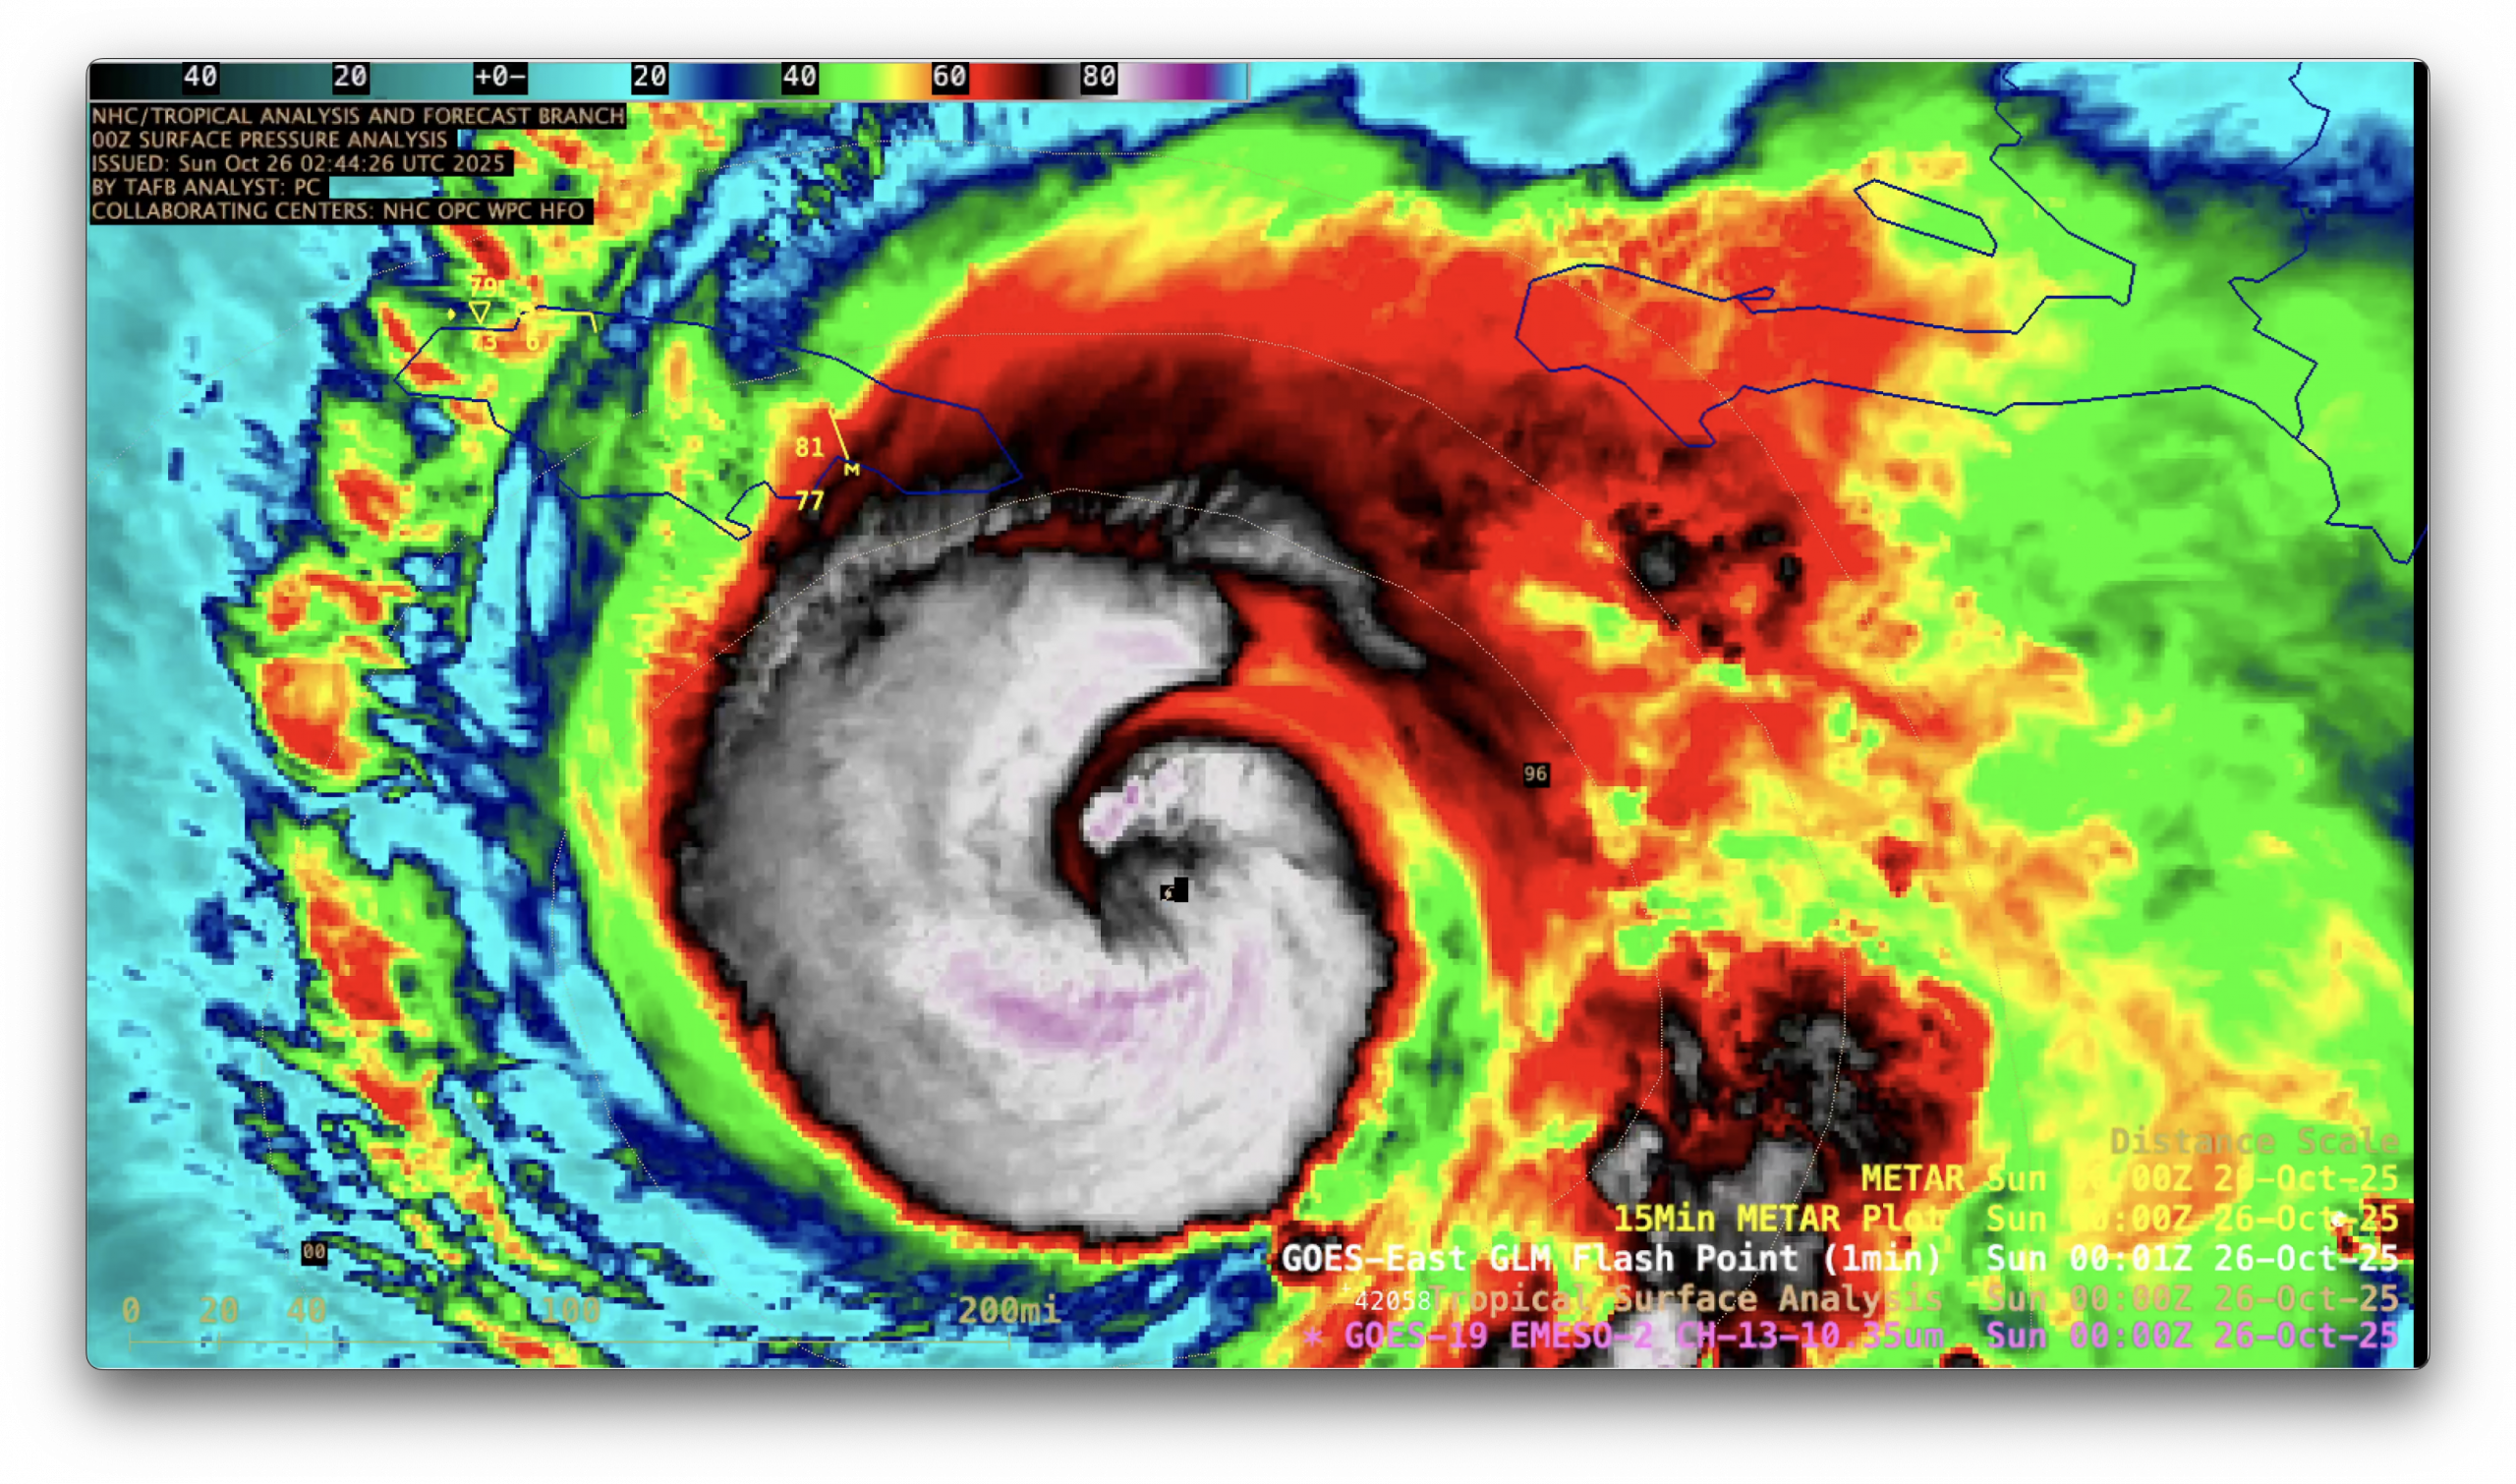
1-minute Mesoscale Domain Sector GOES-19 (GOES-East) Infrared images (above) showed Tropical Storm Melissa in the Caribbean Sea as it began to rapidly intensify during the afternoon and evening hours on 25 October 2025 — reaching Category 1 intensity at 1800 UTC on 25 October and Category 3 intensity at 0300 UTC... Read More
1-minute GOES-19 Infrared images with plots of GLM Flash Points, from 1201 UTC on 25 October to 0300 UTC on 26 October [click to play MP4 animation]
1-minute Mesoscale Domain Sector GOES-19 (GOES-East) Infrared images (above) showed Tropical Storm Melissa in the Caribbean Sea as it began to rapidly intensify during the afternoon and evening hours on 25 October 2025 — reaching Category 1 intensity at 1800 UTC on 25 October and Category 3 intensity at 0300 UTC on 26 October. A series of convective bursts (exhibiting cloud-top infrared brightness temperatures as cold as -90 to -96C, denoted by darker shades of purple) rotated around the storm center — and GLM Flash Points highlighted intermittent lightning activity within some of those convective bursts. Some semblance of a ragged eye occasionally appeared as Melissa neared and attained Category 3 intensity, but an eye was never well organized in the infrared imagery.
Melissa then reached Category 4 intensity south of Jamaica at 1200 UTC on 26 October — and by that time the eye was well defined in both Infrared and Visible imagery (below). Low-altitude mesovortices were apparent within the eye in the Visible images.
1-minute GOES-19 Infrared images with plots of GLM Flash Points, from 1200 -2100 UTC on 26 October [click to play MP4 animation]
1-minute GOES-19 Visible images with plots of GLM Flash Points, from 1200-2100 UTC on 26 October [click to play MP4 animation]
The eye of Category 4 Melissa was exhibiting a “stadium effect”, with a small surface eye having walls that sloped outward with height (below).
GOES-19 Visible and Infrared images at 2057 UTC on 26 October, with plots of GLM Flash Points [click to enlarge]
Melissa was moving through an environment of relatively light deep-layer wind shear, and was traversing warm water — two factors that favored intensification (below).
GOES-19 Infrared images, with an overlay of contours and streamlines of deep-layer wind shear at 1500 UTC on 26 October
Sea Surface Temperature and Ocean Heat Content, with the track of Melissa ending at 1200 UTC on 26 October
===== 27 October Update =====
1-minute GOES-19 Visible and Infrared images with plots of 1-minute GOES-19 GLM Flash Points, from 1131-2200 UTC on 27 October [click to play MP4 animation]
Post-sunrise 1-minute GOES-19 Visible and Infrared images on 27 October (above) again showed a nice “stadium effect” with the eye of Melissa, which reached Category 5 intensity south of Jamaica at 0900 UTC. Visible images continued to display low-altitude mesovortices within the 10-mile diameter eye — and GLM Flash Points highlighted abundant lightning activity within the inner eyewall.
The maximum sustained wind speed of Melissa was increased to 150 kts at 2100 UTC (SATCON | ADT).
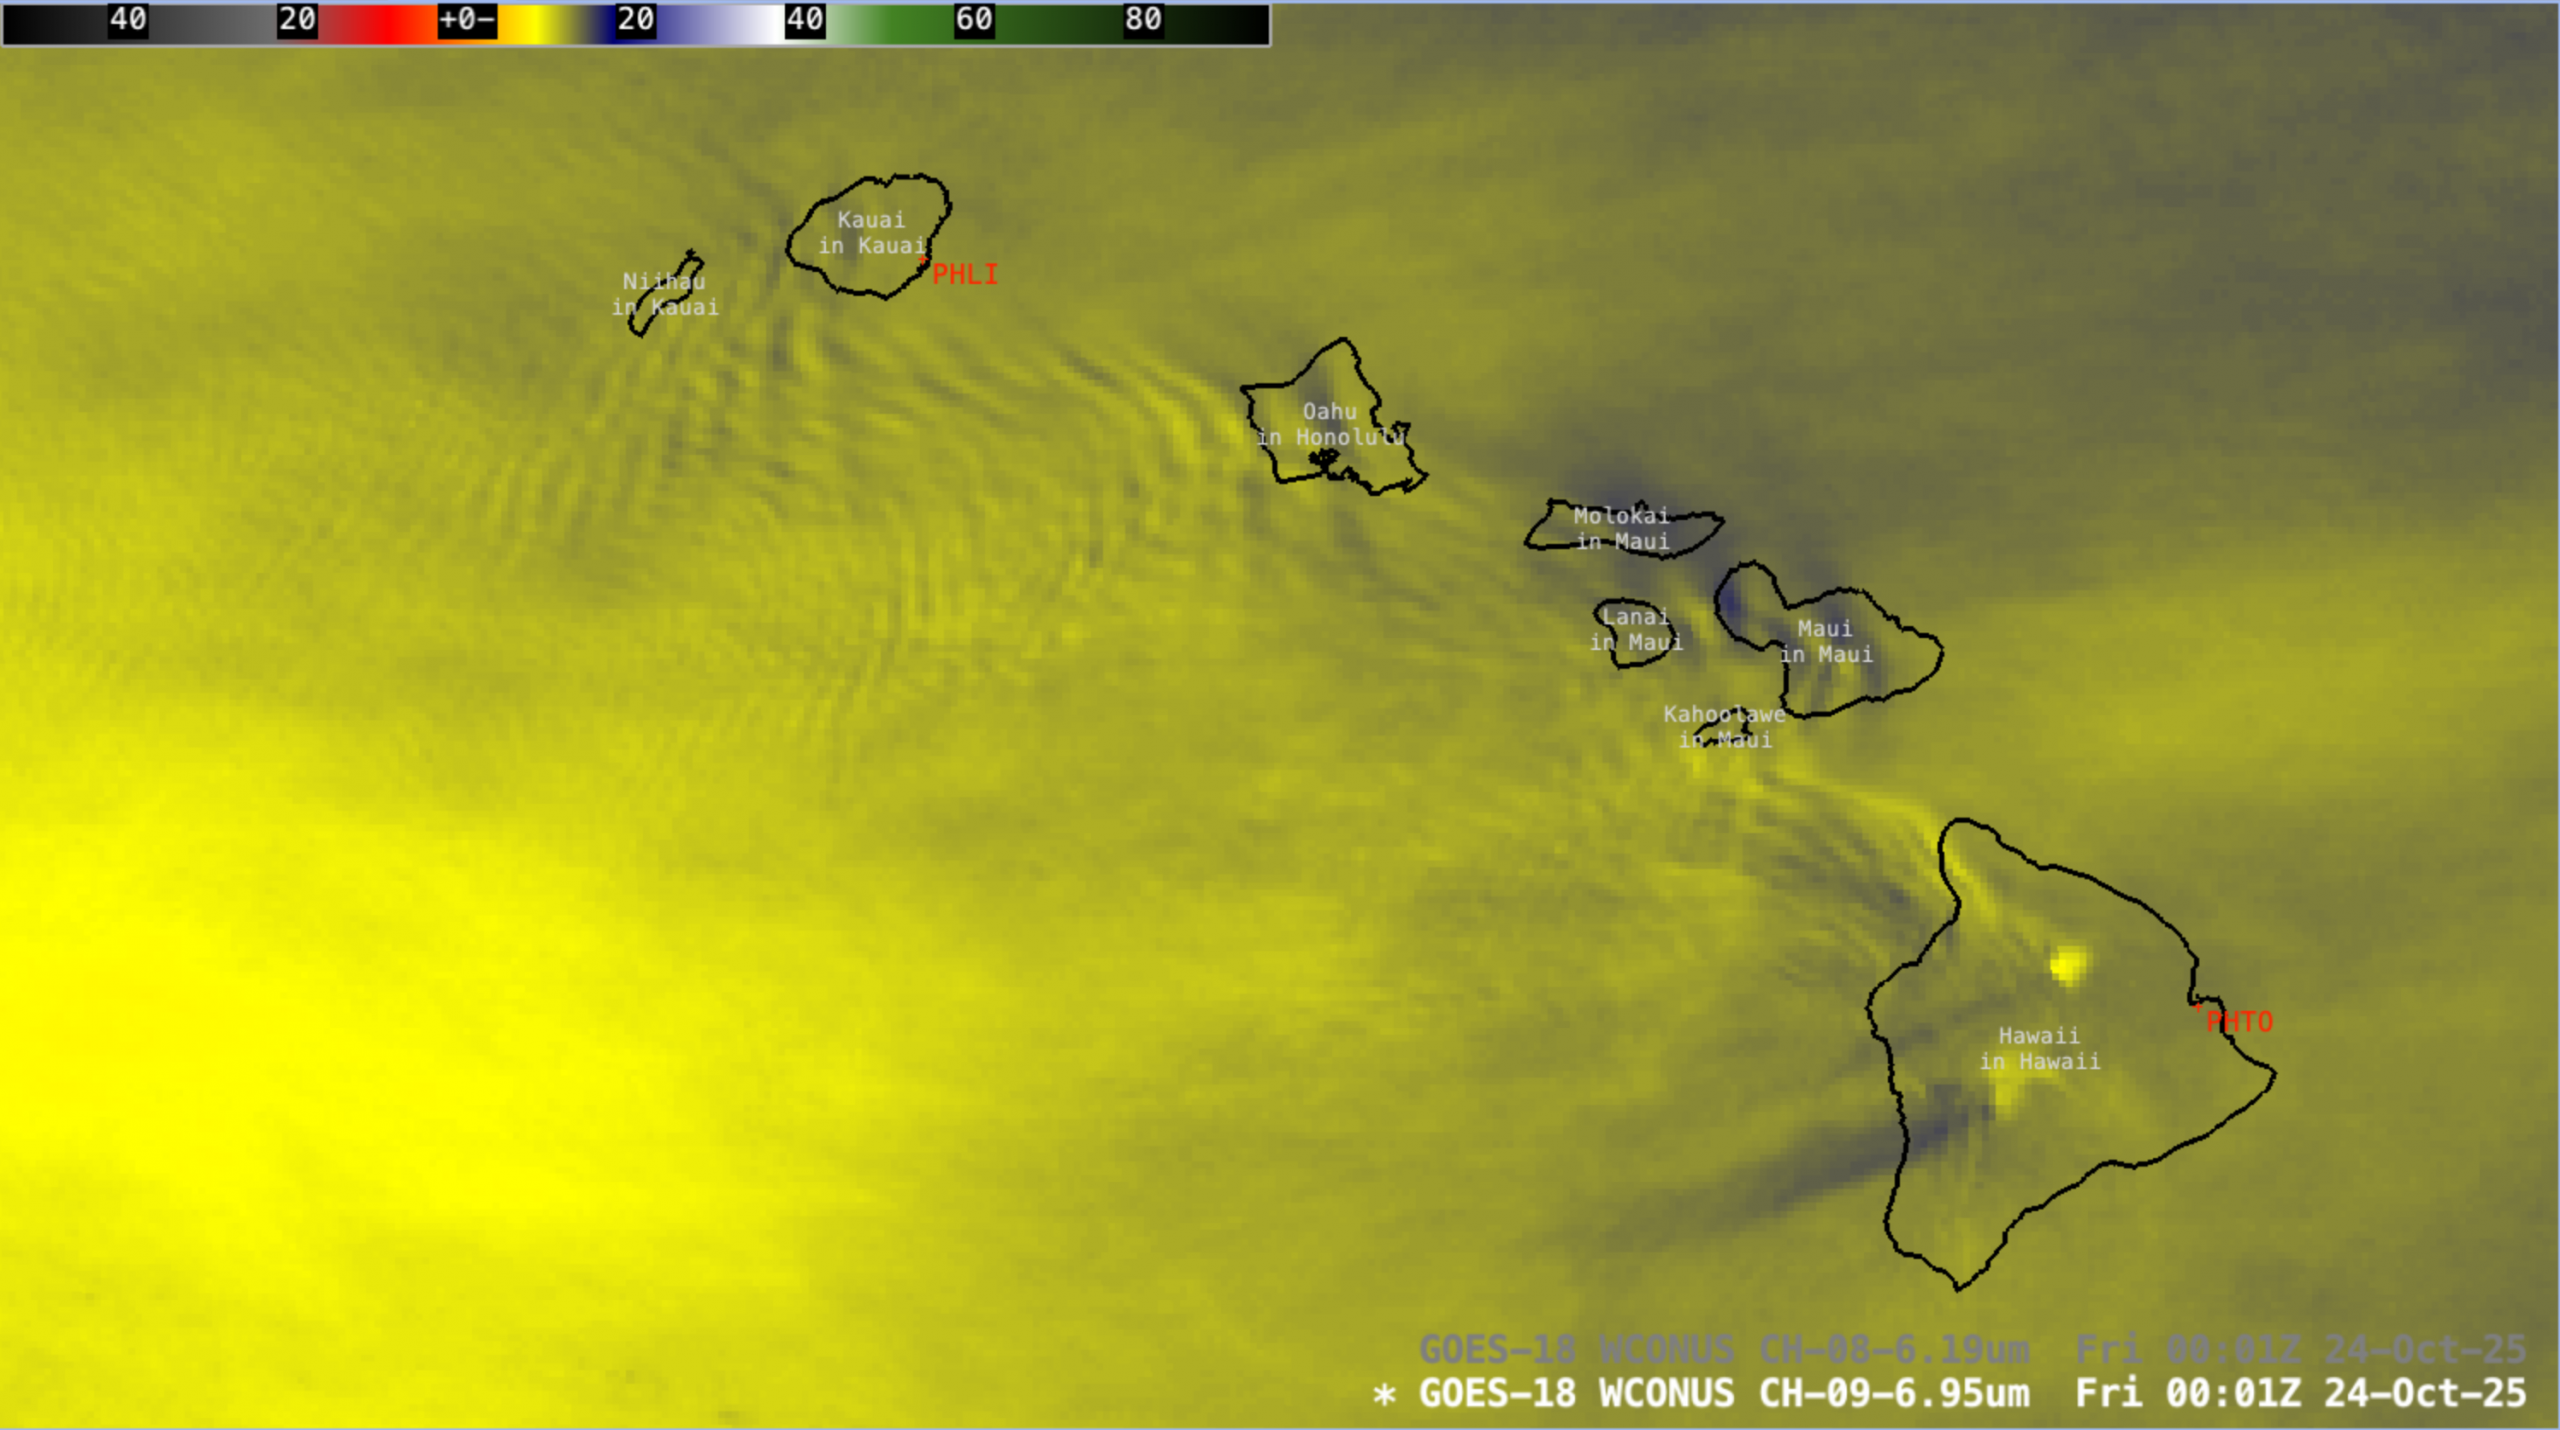
5-minute PACUS Sector GOES-18 (GOES-West) Mid-level Water Vapor and Upper-level Water Vapor images (above) displayed orographic waves downwind (southwest) of the Hawaiian Islands on 23 October 2025. With a ridge of high pressure north of Hawai’i (surface analyses), boundary layer flow from the northeast interacted with the topography of the island chain... Read More
GOES-18 Mid-level Water Vapor (6.9 µm) and Upper-level Water Vapor (6.2 µm) images, from 0601 UTC on 23 October to 0001 UTC on 24 October [click to play MP4 animation]
5-minute PACUS Sector GOES-18 (GOES-West) Mid-level Water Vapor and Upper-level Water Vapor images (above) displayed orographic waves downwind (southwest) of the Hawaiian Islands on 23 October 2025. With a ridge of high pressure north of Hawai’i (surface analyses), boundary layer flow from the northeast interacted with the topography of the island chain — generating vertically-propagating waves that were apparent in Mid-level (and to a lesser extent, even Upper-level) Water Vapor imagery (below).
GOES-18 Mid-level Water Vapor (6.9 µm) image and Topography [click to enlarge]
Northwest of the Big Island of Hawai’i, there was one Pilot Report of continuous light turbulence between the altitudes of 18000-20000 ft (below).
GOES-18 Mid-level Water Vapor (6.9 µm) image at 0001 UTC on 24 October, with a cursor sample of a Pilot Report at 0011 UTC [click to enlarge]
One item of interest was the diurnal change in thermal signatures of the Mauna Kea and Mauna Loa summits — transitioning from cooler (darker shades of blue) during the nighttime at 1201 UTC to warmer (brighter shades of yellow) during the daytime at 0001 UTC (below).
GOES-18 Mid-level Water Vapor (6.9 µm) images at 1201 UTC on 23 October and 0001 UTC on 24 October [click to enlarge]
Plots of Weighting Functions for the GOES-18 Mid-level and Upper-level Water Vapor spectral bands — derived using rawinsonde data from Hilo (PHTO) — showed the profiles of Band 08 and Band 09 weighting functions at 1200 UTC on 23 October to 0000 UTC on 24 October (below). The summits of Mauna Kea and Mauna Loa extend upward to near the 600 hPa pressure level — close to the level of strong weighting function contributions for Water Vapor spectral band 09 at each of those 2 times.
Weighting Function plots of GOES-18 Mid-level Water Vapor (6.9 µm / Band 09, cyan) and Upper-level Water Vapor (6.2 µm / Band 08, brown) spectral bands near the Big Island of Hawai`i [click to enlarge]
This diurnal variability of Mauna Kea and Mauna Loa thermal signatures in Water Vapor imagery has been discussed in previous blog posts here, here and here.
In a sign that the seasons are changing, the lake effect is now clearly visible over the Great Lakes. While most commonly associated with heavy snowfalls downwind of the Great Lakes, in these early pre-freezing times of the year it can be associated with the enhancement of rainfall as well.... Read More
In a sign that the seasons are changing, the lake effect is now clearly visible over the Great Lakes. While most commonly associated with heavy snowfalls downwind of the Great Lakes, in these early pre-freezing times of the year it can be associated with the enhancement of rainfall as well. The lake effect has two principal causes: colder air that originated over land is advected over warmer lake water causing latent heat transfer into the cold air mass, while the topographical lift and sudden increase in friction at the opposite shore forces additional upward motion, leading to precipitation enhancement. Lake effect clouds are generally shallow compared to more synoptically-forced precipitation systems.
The lake effect is easily detectable via satellite as parallel bands of clouds oriented along the direction of the wind flow. However, advanced tools allow us to gain some additional insight about the lake effect and its underlying processes from satellites. For example, here is the Day Cloud Phase Distinction RGB from GOES-19. In this product, three GOES ABI channels with various cloud microphysical characteristics are assigned the red, green, or blue color in the animation to help highlight various characteristics of the clouds. In this product, low level liquid-phase clouds are lavender or cyan, thicker liquid clouds are yellow, glaciating clouds are green, and thin cirrus are salmon.
To begin with, the ASOS observations plotted on the above animation show northeasterly winds on either side of the Lake Michigan shore, being driven by a large midlatitude cyclone centered over northern Quebec (see the surface map here to know more about the synoptic situation). Bands of shallow convection are visible from the central axis of Lake Michigan streaming to the southeast. These clouds are a light cyan to periwinkle in color in this RGB, which indicates that they are likely low-level liquid clouds. This is consistent with what we’d expect for lake effect precipitaiton, especially in mid-October.
As the clouds propagate toward the Michigan shore, they become more congested and are changing to a greenish-yellow. This color shift indicates that they clouds are deepening and changing phase to ice at their tops. In fact, these clouds are growing deep enough to precipitate. Since surface temperatures on the western edge of the lower peninsula of Michigan are well into the mid 40s, this takes the form of rain. A contemporaneous view of the NEXRAD radar mosaic is seen below.
Of course, the key factor in the development of lake effect precipitation is a difference in the temperature of the air that originated over the land relative to the temperature of the water surface. The Great Lakes Surface Enivronmental Analysis produced by our colleagues at NOAA’s Great Lakes Environmental Research Laboratory shows that mid-lake temperatures are in the low-to-mid 60s.
However, the surface temperatures over Wisconsin depicted in the initial animation show that the airmass likely has a temperature in the mid 40s. That is a substantial difference between the lake and the air that is advecting over it, and so it should not be a surprise that this is having an impact on the precipitation patterns.
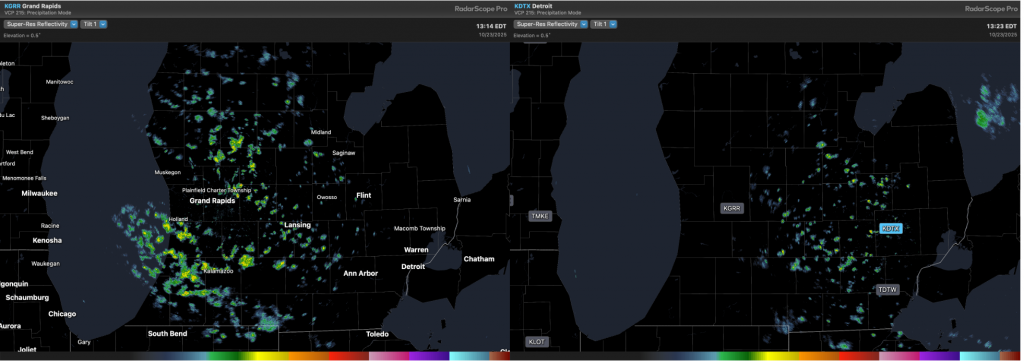
As noted above, lake effect precipitation is shallow. One way to illustrate this is by looking at two adjacent radars. The minimum elevation angle for a NEXRAD weather radar is typically set to 0.5 degrees above the horizon while the surface of the earth is curving away from the beam. This means the further away from a radar one goes, the farther above the surface the bottommost radar beam is. While deep precipitation systems are tall enough to be easily visible from multiple radars, shallow systems can often sneak below the minimum beam height. Here, contemporaneous radar images from Grand Rapids, Michigan(left), and Detroit (right), are shown. Note how the Detroit radar is unable to detect the rain in the western half of the state: it’s just too shallow to appear on that radar.
The lake effect will likely be contributing to rain and snow over the next few months as the large thermal mass of the lake generally means it remains warmer than the surrounding land for much of the fall and winter. (In the spring, the temperature gradient reverses and lake breezes are born instead).
Tropical Storm Melissa developed in the Caribbean Sea on 21 October 2025 — and 1-minute Mesoscale Domain Sector GOES-19 (GOES-East) Infrared and Visible images (above) showed that most of the deep convection (which often exhibited abundant GLM-detected lightning activity) remained west of Melissa’s surface center of circulation, due to moderate west-southwesterly deep-layer wind... Read More
1-minute GOES-19 Infrared and Visible images with plots of GLM Flash Points, from 1401-2230 UTC on 21 October [click to play MP4 animation]
Tropical Storm Melissa developed in the Caribbean Sea on 21 October 2025 — and 1-minute Mesoscale Domain Sector GOES-19 (GOES-East) Infrared and Visible images (above) showed that most of the deep convection (which often exhibited abundant GLM-detected lightning activity) remained west of Melissa’s surface center of circulation, due to moderate west-southwesterly deep-layer wind shear (below).
GOES-19 Infrared images, with an overlay of contours and streamlines of deep-layer wind shear at 0200 UTC on 22 October
Melissa was moving across very warm waters, where high values of Sea Surface Temperature and Ocean Heat Content were present (below).
Sea Surface Temperature on 21 October, with a plot of Melissa’s track ending at 1800 UTC
Ocean Heat Content on 21 October, with a plot of Melissa’s track ending at 1800 UTC
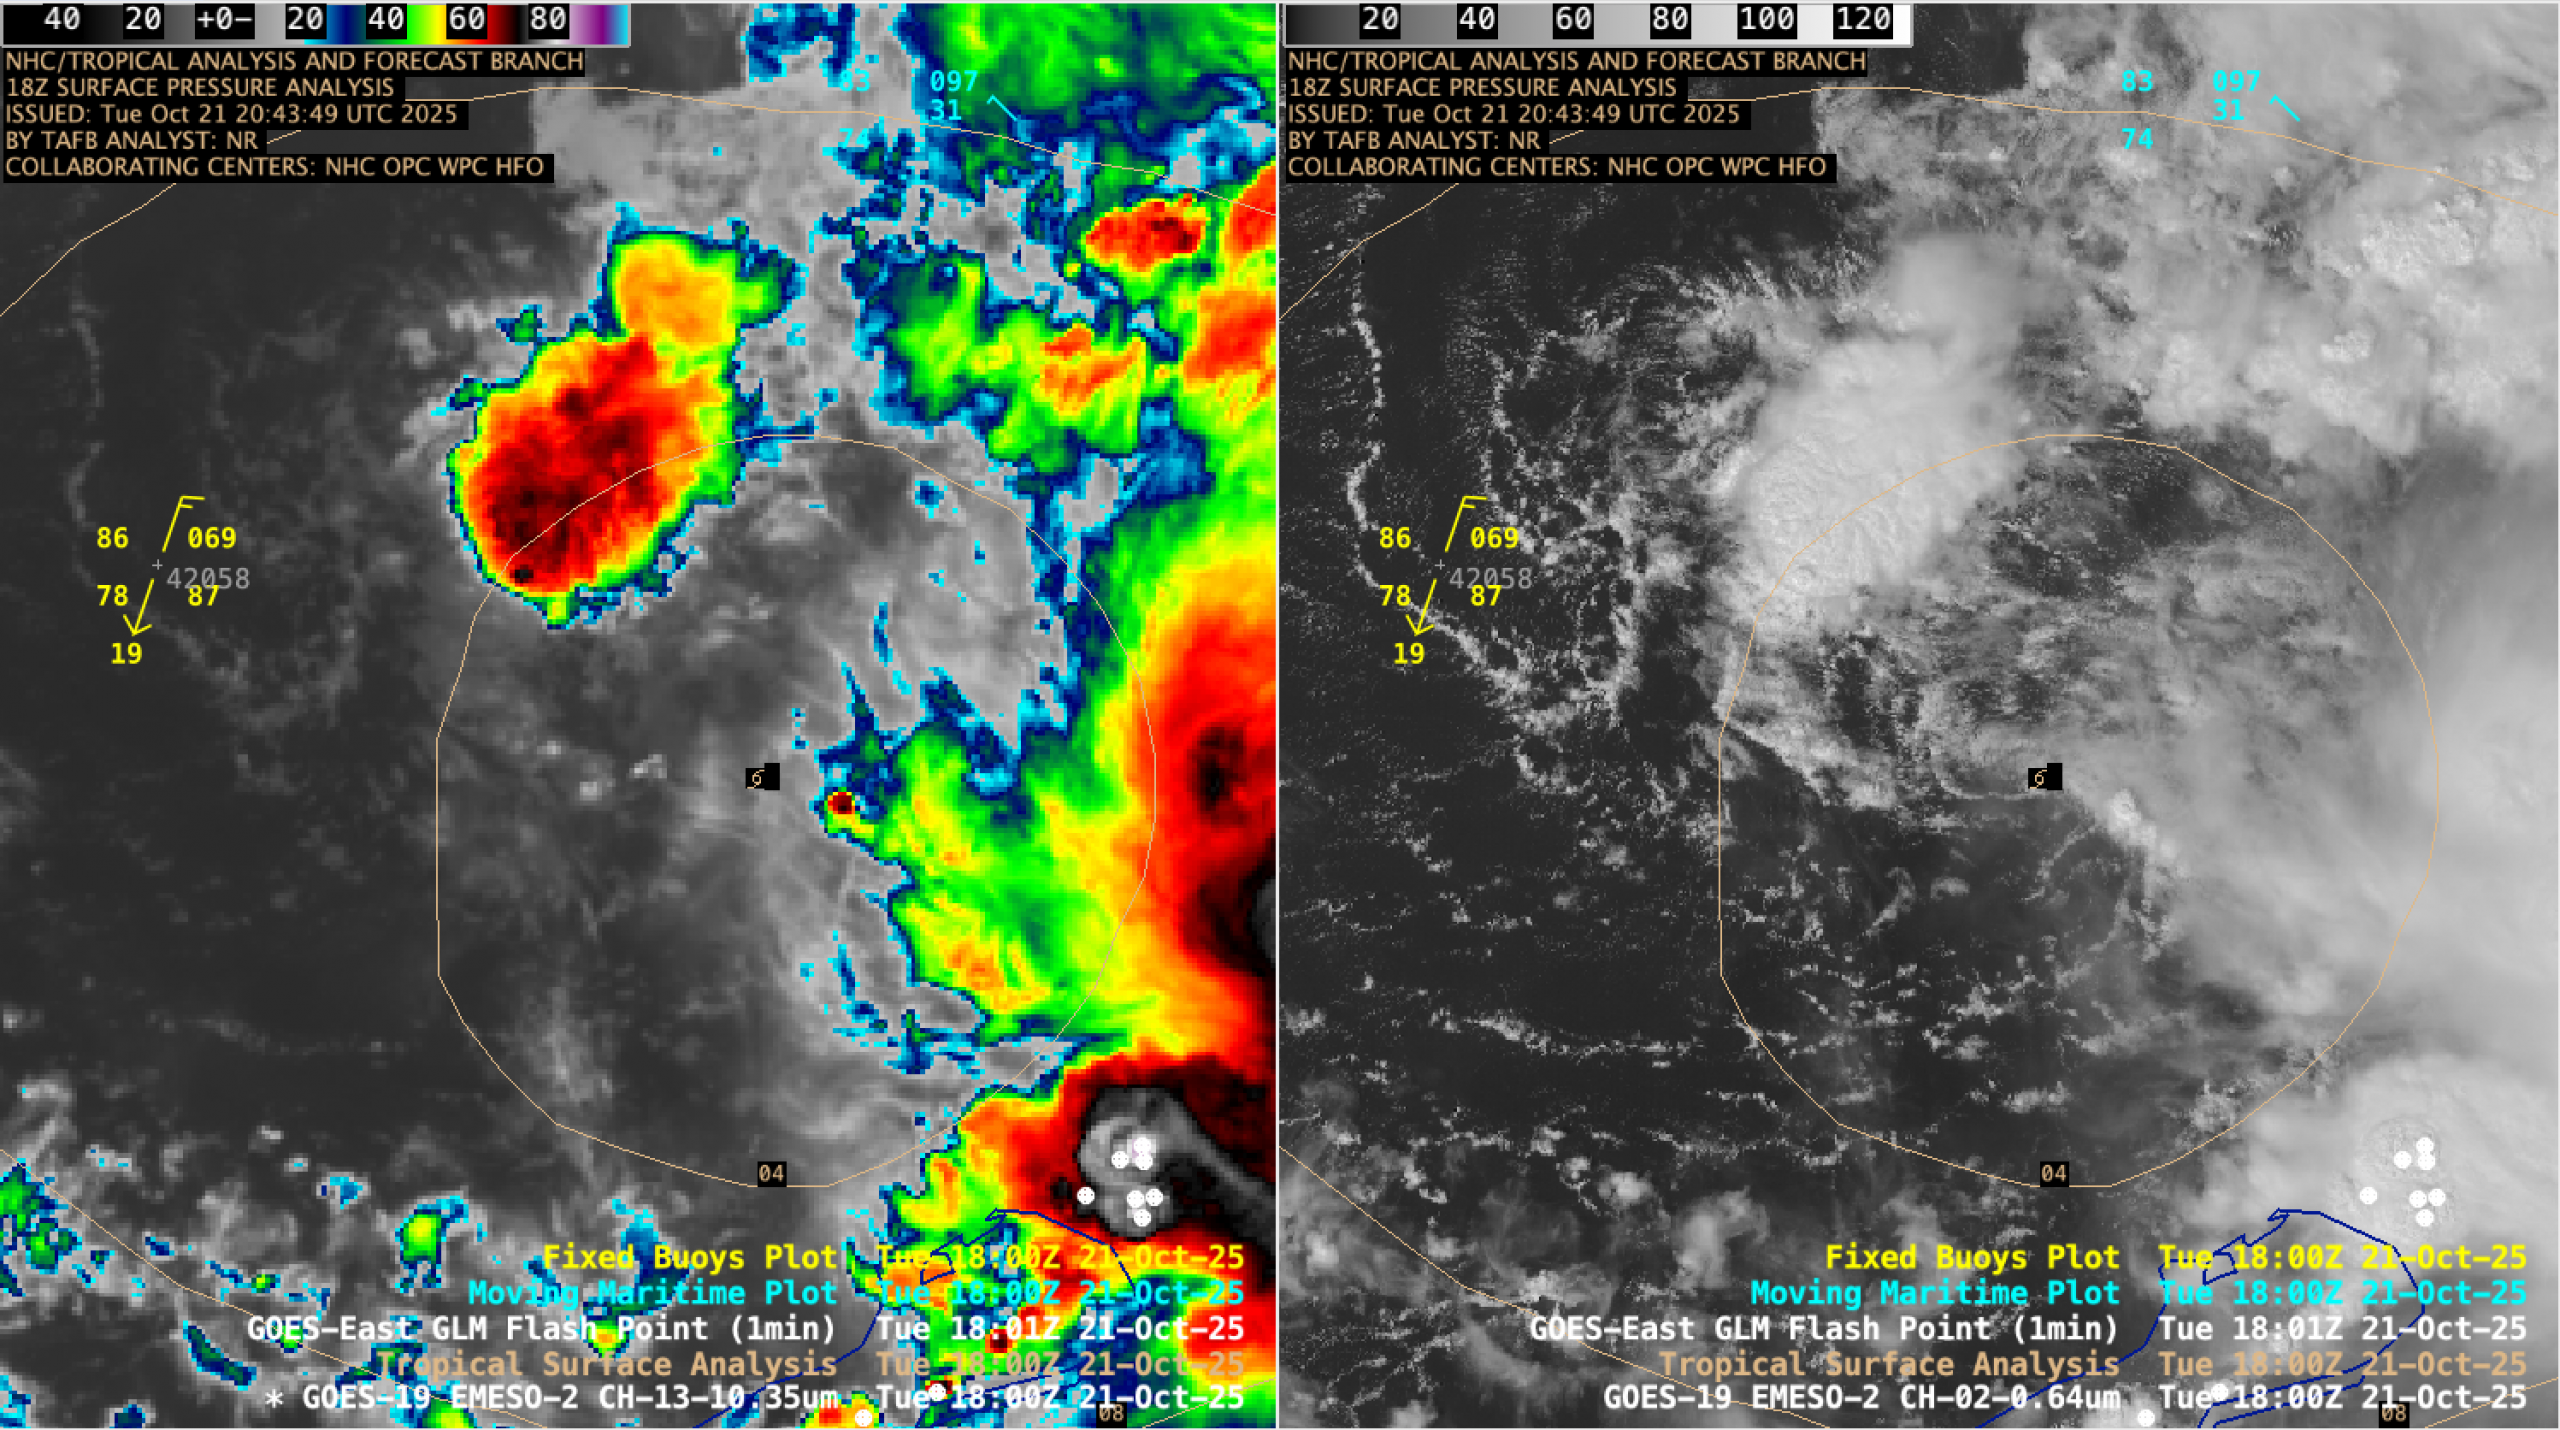
Surface scatterometer data from OCEANSAT and ASCAT (below) indicated that the strongest winds existed east of the storm center.
OCEANSAT scatterometer winds at 1710 UTC on 21 October
GOES-19 Infrared image at 0121 UTC on 22 October, with a cursor sample of 30-knot ASCAT winds [click to enlarge]
GOES-19 Infrared image at 0121 UTC on 22 October, with a cursor sample of 30-knot ASCAT winds [click to enlarge]
===== 22 October Update =====
1-minute GOES-19 Infrared images with plots of GLM Flash Points, from 1801 UTC on 21 October to 1800 UTC on 22 October [click to play MP4 animation]
24 hours of 1-minute GOES-19 Infrared images + GLM Flash Points (above) showed that while the areal coverage of deep convection associated with Tropical Storm Melissa had been increasing, it still remained displaced to the east of the storm center (due to persistent westerly wind shear).
Cloud-top infrared brightness temperatures of convective overshooting tops closer to the center of Melissa have been as cold as -96.57ºC below).
GOES-19 Infrared image with GLM Flash Points at 1347 UTC, with a cursor sample of the coldest cloud-top infrared brightness temperature at that time [click to enlarge]


