GOES-13 Infrared Window (10.7 µm) images (above) showed a large Mesoscale Convective System (MCS) that developed in far eastern New Mexico after 2000 UTC on 11 June 2016, then moved eastward and eventually southward over West Texas during the nighttime hours on 12 June. The MCS produced wind gusts to 75 mph and... Read More
![GOES-13 Infrared Window (10.7 µm) images [click to play animation]](https://cimss.ssec.wisc.edu/satellite-blog/wp-content/uploads/sites/5/2016/06/960x1280_EASTL_B4_GOES13_IR_MCS_TX_12JUNE2016_2016164_071500_0001PANEL.GIF)
GOES-13 Infrared Window (10.7 µm) images [click to play animation]
GOES-13 Infrared Window (10.7 µm) images
(above) showed a large Mesoscale Convective System (MCS) that developed in far eastern New Mexico after 2000 UTC on
11 June 2016, then moved eastward and eventually southward over West Texas during the nighttime hours on
12 June. The MCS produced wind gusts to 75 mph and hail of 1.00 inch in diameter in Texas (
SPC storm reports).
![Suomi NPP VIIRS Infrared Window (11.45 µm) and Day/Night Band (0.7 µm) images [click to enlarge]](https://cimss.ssec.wisc.edu/satellite-blog/wp-content/uploads/sites/5/2016/06/160612_0801utc_suomi_viirs_Infrared_Day_Night_Band_TX_mcs_anim.gif)
Suomi NPP VIIRS Infrared Window (11.45 µm) and Day/Night Band (0.7 µm) images [click to enlarge]
Suomi NPP VIIRS Infrared Window (11.45 µm) and Day/Night Band (0.7 µm) images at 0801 UTC or 3:01 am local time
(above) showed cloud-top infrared brightness temperatures were as cold as -83º C
(violet color enhancement), along with a number of bright streaks on the Day/Night Band image due to cloud illumination by intense lightning activity (there were around 5000 cloud-to-ground lightning strikes associated with this MCS). On the infrared image, note the presence of cloud-top gravity waves propagating outward away from the core of overshooting tops.
This MCS produced heavy rainfall, with as much as 3.44 inches reported near Lomax (NWS Midland TX rainfall map | PNS). An animation of radar reflectivity (below, courtesy of Brian Curran, NWS Midland) showed the strong convective cells moving southward (before the Midland radar was struck by lightning and temporarily rendered out of service).
![Midland, Texas radar reflectivity [click to play MP4 animation]](https://cimss.ssec.wisc.edu/satellite-blog/wp-content/uploads/sites/5/2016/06/160612_kmaf_radar.jpg)
Midland, Texas radar reflectivity [click to play MP4 animation]
During the subsequent daytime hours, GOES-13 Visible (0.63 µm) images
(below) revealed the presence of a large and well-defined
Mesoscale Convective Vortex (MCV) as the cirrus canopy from the decaying MCS eroded. A fantastic explanation of this MCV was included in the afternoon
forecast discussion from NWS Dallas/Fort Worth. New thunderstorms were seen to develop over North Texas during the late afternoon and early evening hours as the MCV approached — there were isolated reports of hail and damaging winds with this new convection (
SPC storm reports). Initiation of this new convection may have also been aided by convergence of the MCV with a convective outflow boundary moving southward from Oklahoma.
![GOES-13 Visible (0.63 µm) images [click to play animation]](https://cimss.ssec.wisc.edu/satellite-blog/wp-content/uploads/sites/5/2016/06/960x1280_EASTL_B1_GOES13_VIS_MCV_TX_12JUNE2016_2016164_195500_0001PANEL.GIF)
GOES-13 Visible (0.63 µm) images [click to play animation]
A sequence of Visible images from POES AVHRR (0.86 µm), Terra MODIS (0.65 µm), and Suomi NPP VIIRS (0.64 µm)
(below) showed snapshots of the MCV at various times during the day.
![Visible images from POES AVHRR (0.86 µm), Terra MODIS (0.65 µm), and Suomi NPP VIIRS (0.64 µm) [click to enlarge]](https://cimss.ssec.wisc.edu/satellite-blog/wp-content/uploads/sites/5/2016/06/160612_avhrr_modis_viirs_Visible_TX_mcv_anim.gif)
Visible images from POES AVHRR (0.86 µm), Terra MODIS (0.65 µm), and Suomi NPP VIIRS (0.64 µm) [click to enlarge]
View only this post
Read Less
![GOES-13 Infrared Window (10.7 µm) images [click to play animation]](https://cimss.ssec.wisc.edu/satellite-blog/wp-content/uploads/sites/5/2016/06/160611-12_goes13_infrared_TX_mcs_anim.gif)
![GOES-13 Visible (0.63 µm) images [click to play animation]](https://cimss.ssec.wisc.edu/satellite-blog/wp-content/uploads/sites/5/2016/06/160612_goes13_visible_TX_mcv_anim.gif)
![GOES-13 Visible (0.63 um, top) and Infrared Window (10.7 um, bottom) images [click to play animation]](https://cimss.ssec.wisc.edu/satellite-blog/wp-content/uploads/sites/5/2016/06/160609_goes13_visible_infrared_Manitoba_severe_thunderstorm_anim.gif)
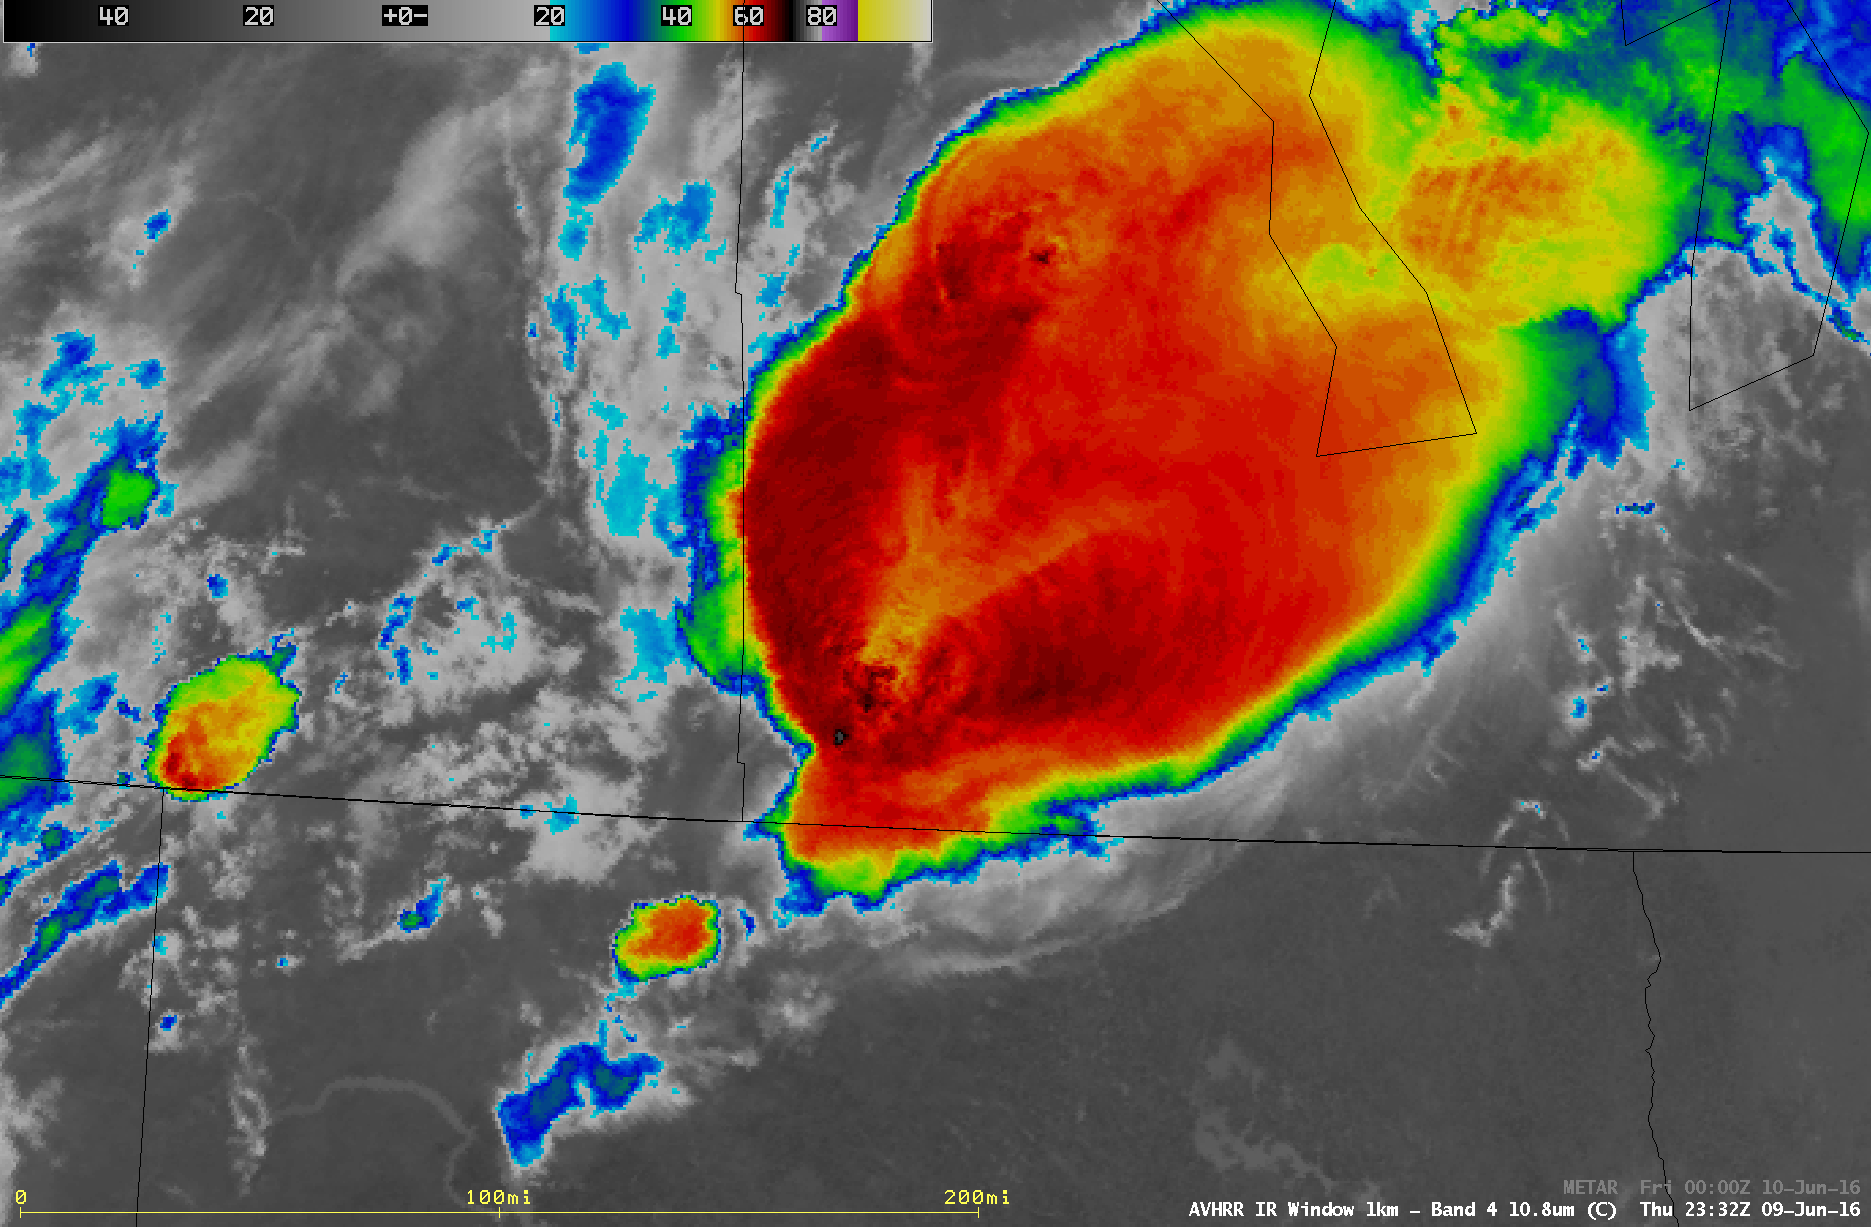
![POES AVHRR Visible (0.86 um) and Infrared (12.0 um) images, with surface reports [click to enlarge]](https://cimss.ssec.wisc.edu/satellite-blog/wp-content/uploads/sites/5/2016/06/160609_2332utc_poes_avhrr_visible_infrared_Manitoba_thunderstorm_anim.gif)
![POES AVHRR Cloud Top Temperature and Cloud Top Height products [click to enlarge]](https://cimss.ssec.wisc.edu/satellite-blog/wp-content/uploads/sites/5/2016/06/160609_2332utc_poes_avhrr_ctt_cth_Manitoba_storm_anim.gif)
![POES AVHRR Infrared (12.0 µm) image, with surface fronts and RTMA surface winds [click to enlarge]](https://cimss.ssec.wisc.edu/satellite-blog/wp-content/uploads/sites/5/2016/06/160609_2332utc_avhrr_ir_00utc_fronts_surface_winds_anim.gif)
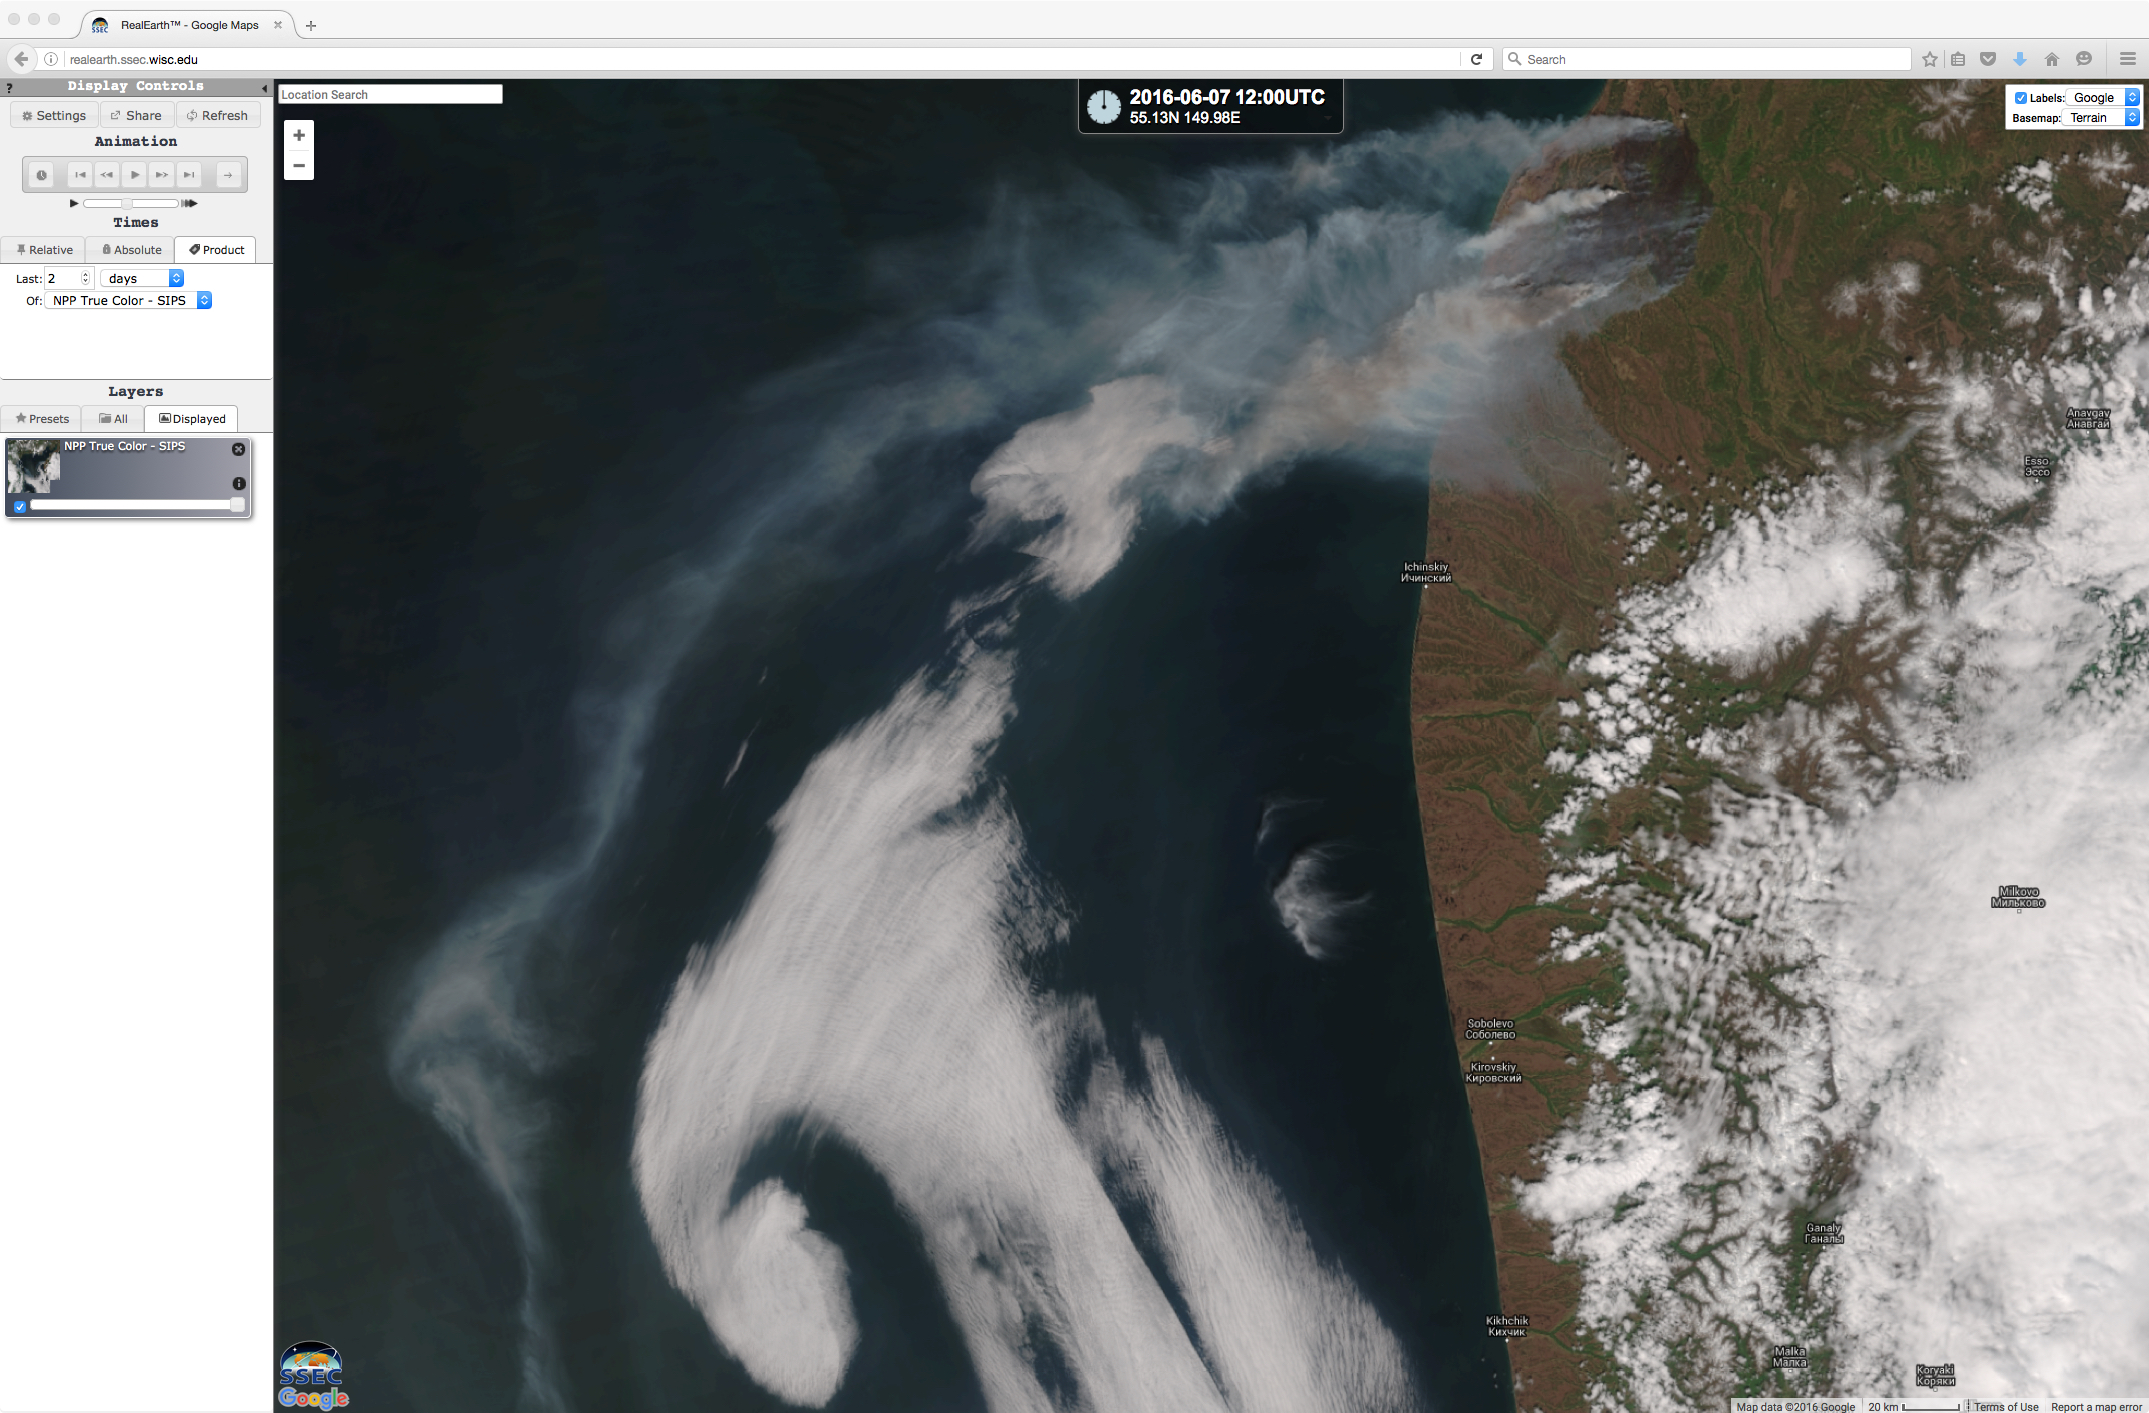
![Himawari-8 Visible (0.64 µm) images [click to play animation]](https://cimss.ssec.wisc.edu/satellite-blog/wp-content/uploads/sites/5/2016/06/160606-07_himawari8_visible_Kamchatka_fire_anim.gif)
![Himawari-8 0.64 µm Visible (top) and 3.9 µm Shortwave Infrared (bottom) images [click to play animation]](https://cimss.ssec.wisc.edu/satellite-blog/wp-content/uploads/sites/5/2016/06/160606-07_himawari8_visible_shortwaveIR_Kamchatka_wildfire_anim.gif)
![Suomi NPP VIIRS true-color image [click to enlarge]](https://cimss.ssec.wisc.edu/satellite-blog/wp-content/uploads/sites/5/2016/06/160607_suomi_npp_viirs_truecolor.jpg)
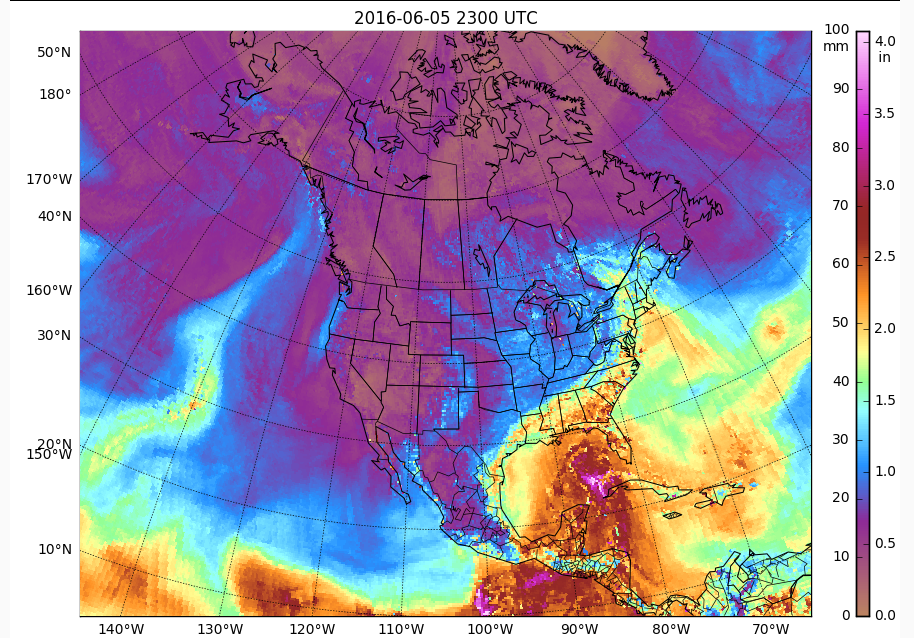
![MIMIC Total Precipitable Water derived from Microwave imagery, 2300 UTC 02 June - 2200 UTC 05 June [click to enlarge]](https://cimss.ssec.wisc.edu/satellite-blog/wp-content/uploads/sites/5/2016/06/MIMICTPW72hrs_Ending2200UTC_5June2016.gif)
![MIRS-based Total Precipitable Water, 2300 UTC 05 June [click to enlarge]](https://cimss.ssec.wisc.edu/satellite-blog/wp-content/uploads/sites/5/2016/06/MIRSMorphedTPW_2300UTC_05June2016.png)
![POES AVHRR Visible (0.86 µm) and Infrared (12.0 µm) images [click to enlarge]](https://cimss.ssec.wisc.edu/satellite-blog/wp-content/uploads/sites/5/2016/06/160606_1530utc_poes_avhrr_visible_infrared_TS_Colin_anim.gif)
