Tropical Depression 2 was upgraded to Tropical Storm Bonnie at 2100 UTC on Saturday 28 May, the second named storm of the 2016 Atlantic Season (Hurricane Alex, which formed in January, was the first named storm). The water vapor animation above shows that Bonnie’s initial spin may be traced to a front associated with an occluded... Read More
![GOES-13 6.5 µm Water Vapor Infrared images [click to play animation]](https://cimss.ssec.wisc.edu/satellite-blog/wp-content/uploads/sites/5/2016/05/BONNIEWV_28MAY2016_2345FULL.GIF)
GOES-13 6.5 µm Water Vapor Infrared images[click to play animation]
Tropical Depression 2 was upgraded to Tropical Storm Bonnie at
2100 UTC on Saturday 28 May, the second named storm of the 2016 Atlantic Season (
Hurricane Alex, which formed in January, was the first named storm). The water vapor animation above shows that Bonnie’s initial spin may be traced to a front associated with an occluded system which crawled through the eastern United States, exiting on about 23 May 2016. It’s not uncommon for vorticity associated with extratropical cyclone fronts to sow the seed of a tropical cyclone, especially early (or late) in the season. In this case, the cold front failed to pass Bermuda, and by 27 May, persistent thunderstorms about halfway between Bermuda and the Bahamas suggested tropical cyclogenesis was underway (GOES-13 visible image animations:
26 May |
27 May).
![MIMIC Total Precipitable Water derived from Microwave imagery, 1800 UTC 28 May - 1700 UTC 30 May [click to enlarge]](https://cimss.ssec.wisc.edu/satellite-blog/wp-content/uploads/sites/5/2016/05/MIMIC_TPW_Bonnie_72hrs_ending1700UTC_30May.gif)
MIMIC Total Precipitable Water derived from Microwave imagery, 1800 UTC 28 May – 1700 UTC 30 May [click to enlarge]
Total Precipitable Water fields from the microwave
MIMIC product, above, show the system was embedded deep within tropical moisture (
24-26 May animation). Tropical moisture associated with the storm moved up the east coast of the United States into the mid-Atlantic States with local flooding reported.
This longer animation (from 21 through 28 May) shows that persistent westward motion of moisture occurred over the tropical Atlantic well in advance of Bonnie’s formation.
![Rapidscat Scatterometer Winds, 1012 UTC on 27 May [click to enlarge]](https://cimss.ssec.wisc.edu/satellite-blog/wp-content/uploads/sites/5/2016/05/160527_1012utc_rapidscat_Invest91L.gif)
Rapidscat Scatterometer Winds, 1012 UTC on 27 May [click to enlarge]
The tropical wave that produced Bonnie showed a closed circulation as early as 1012 UTC on 27 May according to Rapidscat scatterometer winds, above, and MODIS Sea Surface Temperatures, below, showed very warm water (with SST values of 80º F) over the Gulf Stream.
![MODIS-based Sea Surface Temperatures, 1848 UTC on 27 May [click to enlarge]](https://cimss.ssec.wisc.edu/satellite-blog/wp-content/uploads/sites/5/2016/05/MODIS_SST_20160527_1848.png)
MODIS-based Sea Surface Temperatures, 1848 UTC on 27 May [click to enlarge]
![Suomi NPP VIIRS Day/Night Band (0.70 µm Visible) and Infrared (11.45 µm) Imagery at 0621 UTC on 27 May 2016 [click to enlarge]](https://cimss.ssec.wisc.edu/satellite-blog/wp-content/uploads/sites/5/2016/05/DNB_NPP_11.45_27May2016_0621toggle.gif)
Suomi NPP VIIRS Day/Night Band (0.70 µm Visible) and Infrared (11.45 µm) Imagery at 0621 UTC on 27 May 2016 [click to enlarge]
Suomi NPP overflew this tropical system at various times during its lifecycle. Shortly after midnight on 27 May 2016, above, strong convection was centered just north of the apparent surface circulation (as inferred by the curved bands of low-level clouds, clouds made visible by moonlight in the night-time VIIRS Day/Night Band visible imagery). Twenty-four hours later, at 0742 UTC on 28 May, below, in a more zoomed-in view, the (then) Tropical Depression Number 2 is supporting strong convection that is obscuring the low-level circulation center.
![Suomi NPP VIIRS Day/Night Band (0.70 µm Visible) and Infrared (11.45 µm) Imagery at 0742 UTC on 28 May 2016 [click to enlarge]](https://cimss.ssec.wisc.edu/satellite-blog/wp-content/uploads/sites/5/2016/05/DNB_NPP_11.45_28May2016_0742toggle.gif)
Suomi NPP VIIRS Day/Night Band (0.70 µm Visible) and Infrared (11.45 µm) Imagery at 0742 UTC on 28 May 2016 [click to enlarge]
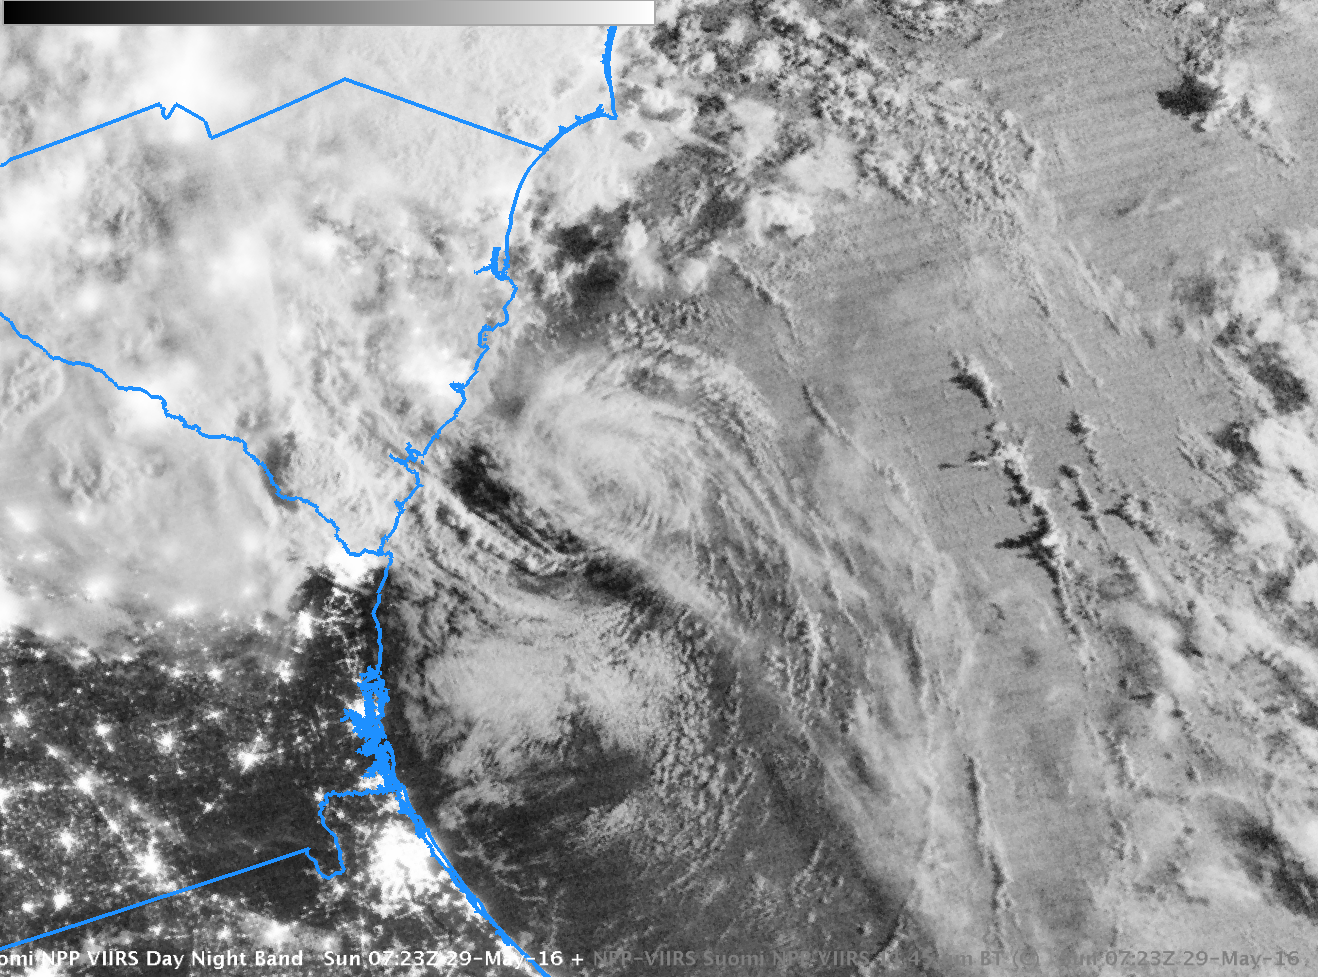
![Suomi NPP VIIRS Day/Night Band (0.70 µm Visible) and Infrared (11.45 µm) Imagery at 0723 UTC on 29 May 2016 [click to enlarge]](https://cimss.ssec.wisc.edu/satellite-blog/wp-content/uploads/sites/5/2016/05/DNB_NPP_11.45_29May2016_0723toggle.gif)
Suomi NPP VIIRS Day/Night Band (0.70 µm Visible) and Infrared (11.45 µm) Imagery at 0723 UTC on 29 May 2016 [click to enlarge]
Finally, at 0723 UTC on 29 May, (above) after strong wind shear has displaced all convection well north of the center, the low-level circulation of Tropical Storm Bonnie is southeast of the South Carolina Coast. Strong convection is over North Carolina. This shear was noted in the
0300 UTC and
0900 UTC (29 May) Discussions from the National Hurricane Center. The effect of shear is apparent in the two GOES-13 Infrared Images below, from 2045 UTC on 28 May when convection was close to the center, and from 1045 UTC on 29 May, shortly before landfall, when convection was stripped from the center and displaced well to the north.
![GOES-13 Infrared (10.7 µm) Imagery at 2045 UTC on 28 May and at 1045 UTC 29 May 2016; the Yellow Arrow points to the low-level circulation center [click to enlarge]](https://cimss.ssec.wisc.edu/satellite-blog/wp-content/uploads/sites/5/2016/05/GOES13_IR4_28MAY2016_2045_29MAY_1045toggle.gif)
GOES-13 Infrared (10.7 µm) Imagery at 2045 UTC on 28 May and at 1045 UTC 29 May 2016; the Yellow Arrow points to the low-level circulation center [click to enlarge]
Closer views of the sheared system on 28 May can be seen on
1906 UTC VIIRS and
1937 UTC AVHRR Visible and Infrared images, as well as a
GOES-13 Visible animation.
===== 01 June Update =====
![GOES-13 Visible (0.63 µm) images [click to play MP4 animation]](https://cimss.ssec.wisc.edu/satellite-blog/wp-content/uploads/sites/5/2016/06/960x1280_EASTL_B1_GOES13_VIS_BONNIE_01JUNE2016_2016153_181500_0001PANEL.GIF)
GOES-13 Visible (0.63 µm) images [click to play MP4 animation]
The remnant circulation of Bonnie moved very slowly northeastward during the 30 May – 01 June period, as seen in GOES-13 Visible (0.63 µm) images covering each of those 3 days (above; also available as a large 95 Mbyte
animated GIF). The periodic formation of deep convective clusters continued to produce
heavy rainfall over parts of far eastern North and South Carolina.
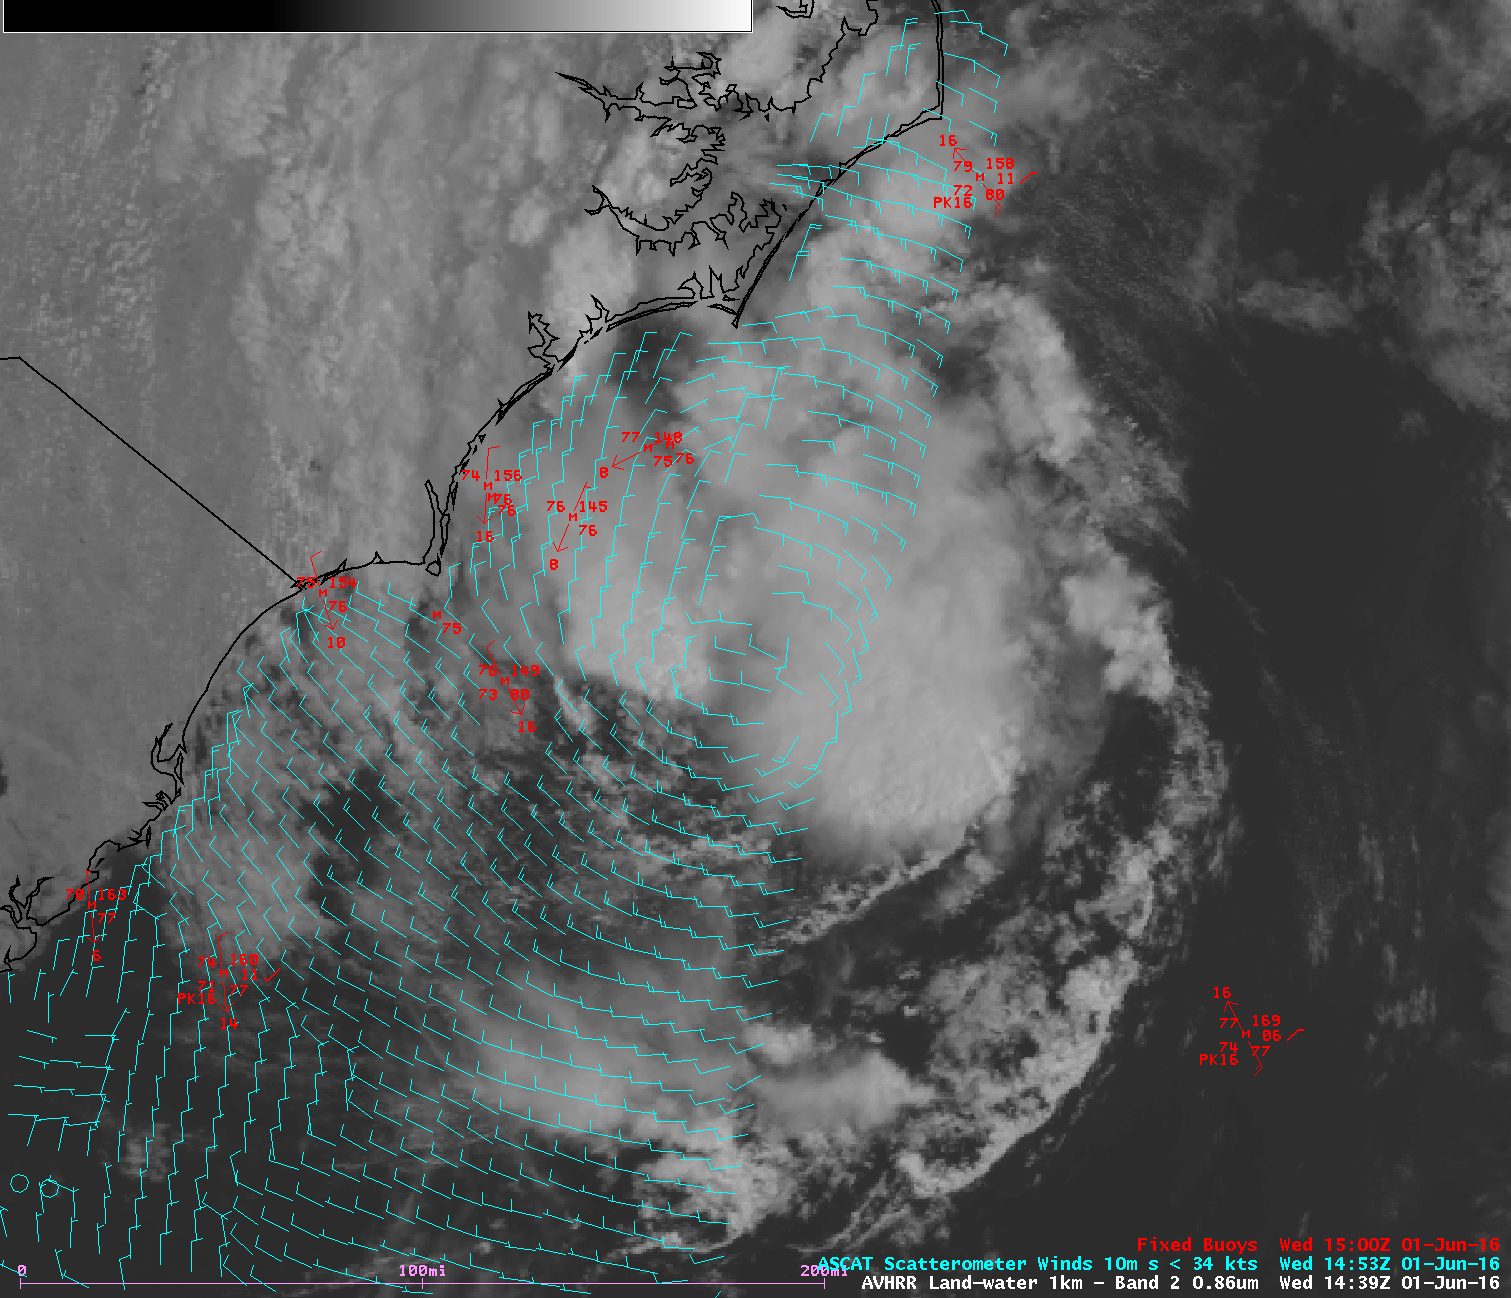
On the morning of 01 June, an overpass of the Metop-B ASCAT instrument sampled the flow around the low-level circulation center (LLCC) off the coast of North Carolina; several hours later, Suomi NPP VIIRS Visible (0.64 µm) and Infrared Window (11.45 µm) images provided a high-resolution view of the system at 1755 UTC (below). Cloud-top IR brightness temperatures were as cold as -78º C within the small convective cluster located just north of the LLCC.
![Suomi NPP VIIRS Visible (0.64 µm) and Infrared Window (11.45 µm) images [click to enlarge]](https://cimss.ssec.wisc.edu/satellite-blog/wp-content/uploads/sites/5/2016/06/160601_1752utc_viirs_visible_infrared_Bonnie_remnants_anim.gif)
Suomi NPP VIIRS Visible (0.64 µm) and Infrared Window (11.45 µm) images [click to enlarge]
View only this post
Read Less
![GOES-13 6.5 µm Water Vapor Infrared images [click to play animation]](https://cimss.ssec.wisc.edu/satellite-blog/wp-content/uploads/sites/5/2016/05/BonnieWVanim_23May_29MayFULL.gif)
![GOES-3 0.65 µm Visible (top) and 10.7 µm Infrared Window (bottom) images [click to play animation]](https://cimss.ssec.wisc.edu/satellite-blog/wp-content/uploads/sites/5/2016/05/19800518_goes03_visible_infrared_Mount_St_Helens_eruption_anim.gif)
![GOES-3 Visible (0.65 µm) and Infrared Window (11.6 µm) images [click to enlarge]](https://cimss.ssec.wisc.edu/satellite-blog/wp-content/uploads/sites/5/2016/05/19781120_goes3_visible_infrared_full_disk_anim.gif)
![GOES-13 Infrared Window (10.7 µm) images [click to play animation]](https://cimss.ssec.wisc.edu/satellite-blog/wp-content/uploads/sites/5/2016/05/160526-27_goes13_infrared_Brenham_TX_anim.gif)
![Suomi NPP VIIRS Day/Night Band (0.7 µm) and Infrared Window (11.45 µm) images [click to enlarge]](https://cimss.ssec.wisc.edu/satellite-blog/wp-content/uploads/sites/5/2016/05/160527_0801utc_suomi_npp_viirs_Day_Night_Band_IR_Metars_Brenham_TX_mcs_anim.gif)
![Time series plot of surface weather conditions at Brenham, Texas [click to enlarge]](https://cimss.ssec.wisc.edu/satellite-blog/wp-content/uploads/sites/5/2016/05/160526-27_K11R_SFCMG.GIF)
![Landsat-8 false-color RGB image [click to enlarge]](https://cimss.ssec.wisc.edu/satellite-blog/wp-content/uploads/sites/5/2016/05/160528_1657utc_landsat8_falsecolor_Brenham_Texas_flooding_anim.gif)
![INSAT-3D Infrared Window (10.8 µm) images, with hourly surface weather symbols [click to play MP4 animation]](https://cimss.ssec.wisc.edu/satellite-blog/wp-content/uploads/sites/5/2016/05/960x1280_INSAT3D_B5_INSAT3D_IR_ROANU_17-21MAY2016_2016139_000000_0001PANEL.GIF)
![Hourly Infrared satellite images, with METAR surface reports [click to play animation]](https://cimss.ssec.wisc.edu/satellite-blog/wp-content/uploads/sites/5/2016/05/160519_infrared_metars_India_anim.gif)
![INSAT-3D Visible (0.65 µm) images, with hourly surface wind barbs (knots) and temperatures (ºF) [click to play animation]](https://cimss.ssec.wisc.edu/satellite-blog/wp-content/uploads/sites/5/2016/05/160519_insat3d_visible_winds_temperatures_India_anim.gif)
![Time series plot of surface data for Ahmadabad, India [click to enlarge]](https://cimss.ssec.wisc.edu/satellite-blog/wp-content/uploads/sites/5/2016/05/160519_VAAH_SFCMG.GIF)
