GOES-15 (GOES-West) Water Vapor (6.5 µm) images (above) showed the southeastward migration of an upper-level low across the North Slope and the eastern Brooks Range of Alaska during the 21 June – 22 June 2016 period. A potential vorticity (PV) anomaly was associated with this disturbance, which brought the dynamic... Read More
![GOES-15 Water Vapor (6.5 µm) images [click to play animation]](https://cimss.ssec.wisc.edu/satellite-blog/wp-content/uploads/sites/5/2016/06/960x1280_WESTL_B3_GOES15_WV_AK_21JUNE2016_2016174_000000_0001PANEL.GIF)
GOES-15 Water Vapor (6.5 µm) images [click to play animation]
GOES-15
(GOES-West) Water Vapor (6.5 µm) images
(above) showed the southeastward migration of an upper-level low across the North Slope and the eastern Brooks Range of Alaska during the 21 June – 22 June 2016 period. A potential vorticity (PV) anomaly was associated with this disturbance, which brought the
dynamic tropopause — taken to be the
pressure of the PV 1.5 surface — downward to below the 600 hPa pressure level over northern Alaska.
Several inches of snow were forecast to fall in higher elevations of the eastern portion of the Brooks Range.
With the very large satellite viewing angle (or “zenith angle”) associated with GOES-15 imagery over Alaska — which turns out to be 73.8 degrees for Fairbanks — the altitude of the peak of the Imager 6.5 µm water vapor weighting function (below) was shifted to higher altitudes (in this case, calculated using rawinsonde data from 12 UTC on 22 June, near the 300 hPa pressure level).
![GOES-15 Imager water vapor (Band 3, 6.5 µm) weighting function [click to enlarge]](https://cimss.ssec.wisc.edu/satellite-blog/wp-content/uploads/sites/5/2016/06/160622_12z_pafa_wv_wf.png)
GOES-15 Imager water vapor (Band 3, 6.5 µm) weighting function [click to enlarge]
The
ABI instrument on
GOES-R will have 3 water vapor bands, roughly comparable to the 3 water vapor bands on the GOES-15
Sounder — the weighting functions for those 3 GOES-15 Sounder water vapor bands (calculated using the same Fairbanks rawinsonde data) are shown below. Assuming a similar spatial resolution as the Imager, the GOES-15 Sounder bands 11
(7.0 µm, green) and 12
(7.4 µm, red) would have allowed better sampling and visualization of the lower-altitude portion of this particular storm system. The 3 ABI water vapor bands are nearly identical to those on the Himawari-8
AHI instrument; an example of AHI water vapor imagery over part of Alaska can be seen
here.
![GOES-15 Sounder water vapor weighting function plots [click to enlarge]](https://cimss.ssec.wisc.edu/satellite-blog/wp-content/uploads/sites/5/2016/06/160622_12z_pafa_wv_sounder_water_vapor_weighting_functions_anim.gif)
GOES-15 Sounder water vapor weighting function plots [click to enlarge]
As the system departed and the clouds began to dissipate on 22 June, GOES-13 Visible (0.63 µm) images
(below) did indeed show evidence of bright white snow-covered terrain on the northern slopes and highest elevations of the Brooks Range.
![GOES-15 Visible (0.63 µm) images [click to play animation]](https://cimss.ssec.wisc.edu/satellite-blog/wp-content/uploads/sites/5/2016/06/960x1280_WESTL_B1_GOES15_VIS_AK_22JUNE2016_2016174_190000_0001PANEL.GIF)
GOES-15 Visible (0.63 µm) images [click to play animation]
A sequence of 1-km resolution POES AVHRR Visible (0.86 µm) images
(below) showed a view of the storm during the 21-22 June period, along with the resultant snow cover on 22 June. However, the snow quickly began to melt as the surface air temperature rebounded into the 50’s and 60’s F at some locations.
![POES AVHRR Visible (0.86 µm) images [click to play animation]](https://cimss.ssec.wisc.edu/satellite-blog/wp-content/uploads/sites/5/2016/06/avhrr_vis_AK-20160622_204200.png)
POES AVHRR Visible (0.86 µm) images [click to play animation]
The increase in fresh snow cover along the northern slopes and the highest elevations of the central and northeastern Brooks Range — most notably from Anaktuvuk Pass to Fort Yukon to Sagwon — was evident in a comparison of Suomi NPP VIIRS true-color Red/Green/Blue (RGB) images from 17 June and 22 June, as viewed using
RealEarth (below). The actual time of the satellite
overpass on 22 June was 2134 UTC.
![Suomi NPP VIIRS true-color RGB images, 17 June and 22 June [click to enlarge]](https://cimss.ssec.wisc.edu/satellite-blog/wp-content/uploads/sites/5/2016/06/160617_160622_suomi_npp_viirs_truecolor_Brooks_Range_Alaska_anim.gif)
Suomi NPP VIIRS true-color RGB images, 17 June and 22 June [click to enlarge]
View only this post
Read Less
![GOES-15 Water Vapor (6.5 µm) images [click to play animation]](https://cimss.ssec.wisc.edu/satellite-blog/wp-content/uploads/sites/5/2016/06/160621_goes15_water_vapor_AK_anim.gif)
![GOES-15 Visible (0.63 µm) images [click to play animation]](https://cimss.ssec.wisc.edu/satellite-blog/wp-content/uploads/sites/5/2016/06/160622_goes15_visible_AK_anim.gif)
![POES AVHRR Visible (0.86 µm) images [click to play animation]](https://cimss.ssec.wisc.edu/satellite-blog/wp-content/uploads/sites/5/2016/06/160621-22_poes_avhrr_visible_AK_anim.gif)
![Suomi NPP VIIRS Day/Night Band (0.7 µm), Shortwave Infrared (3.74 µm) and Infrared Window (11.45 µm) images [click to enlarge]](https://cimss.ssec.wisc.edu/satellite-blog/wp-content/uploads/sites/5/2016/06/160620_0853utc_suomi_npp_viirs_DayNightBand_ShortwaveIR_IRWindow_Cedar_Fire_Arizona_anim.gif)
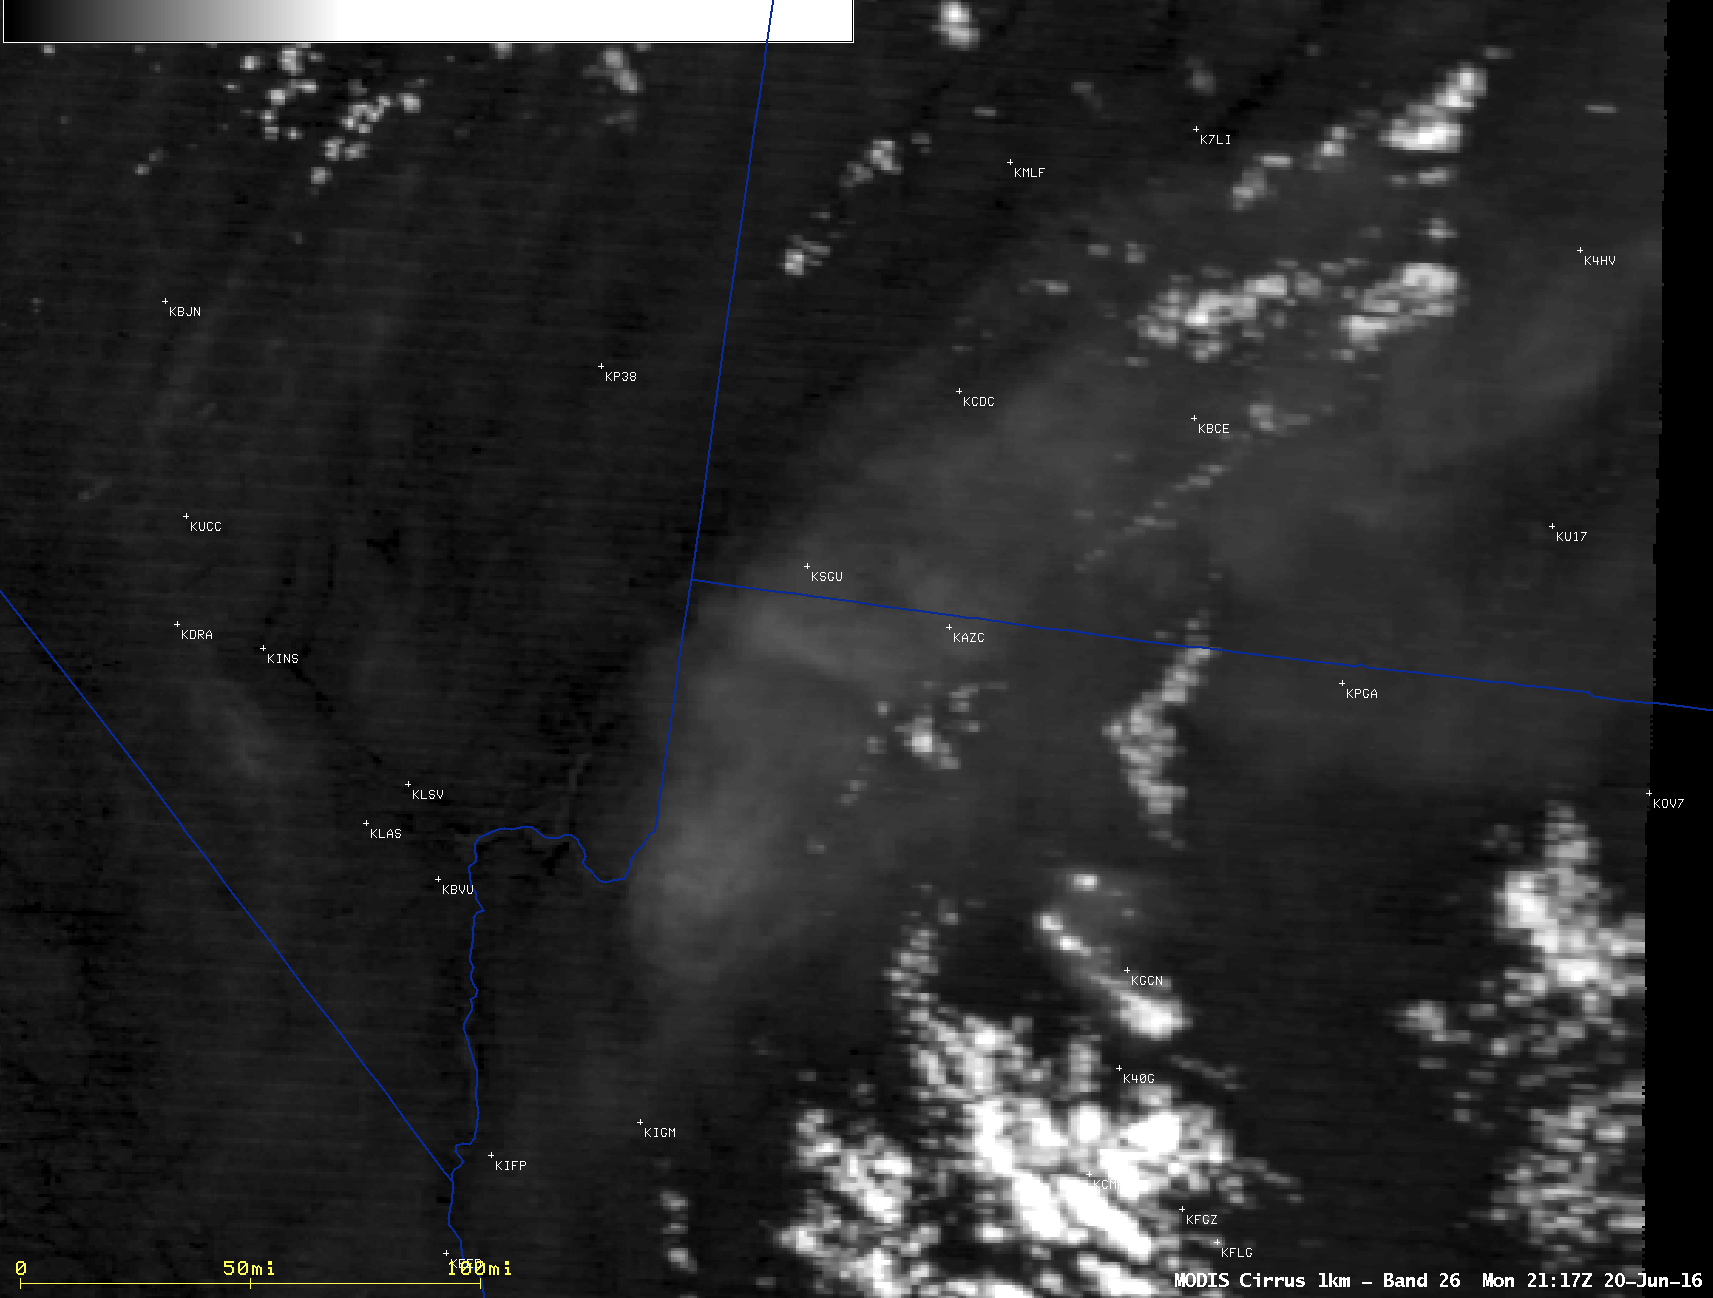
![Aqua MODIS Near-Infrared Cirrus (1.16 µm), Visible (0.65 µm), Infrared Window (11.0 µm), and Topography images [click to enlarge]](https://cimss.ssec.wisc.edu/satellite-blog/wp-content/uploads/sites/5/2016/06/160620_2117utc_modis_visible_cirrus_ir_topo_AZ_anim.gif)
![GOES-15 Visible (0.63 µm) images [click to play animation]](https://cimss.ssec.wisc.edu/satellite-blog/wp-content/uploads/sites/5/2016/06/160620_goes15_visible_CA_NV_AZ_anim.gif)
![GOES-13 Infrared Window (10.7 µm) images [click to play animation]](https://cimss.ssec.wisc.edu/satellite-blog/wp-content/uploads/sites/5/2016/06/160614-15_goes13_infrared_S_WI_flooding_anim.gif)
![Landsat-8 false-color image [click to enlarge]](https://cimss.ssec.wisc.edu/satellite-blog/wp-content/uploads/sites/5/2016/06/160615_1641utc_landsat8_falsecolor_Dane_County_Wisconsin_anim.gif)
![Landsat-8 derived water change, 30 May vs 15 June 2016 [click to enlarge]](https://cimss.ssec.wisc.edu/satellite-blog/wp-content/uploads/sites/5/2016/06/160530-160615_landsat8_Black_Earth_WI_flooding_anim.gif)
![YouTube video from drone flight near Black Earth, Wisconsin [click to play]](https://cimss.ssec.wisc.edu/satellite-blog/wp-content/uploads/sites/5/2016/06/160615_drone_flight.jpg)
![GMS-4 Infrared Window (11.5 µm) images [click to play animation]](https://cimss.ssec.wisc.edu/satellite-blog/wp-content/uploads/sites/5/2016/06/19910612-16_gms4_infrared_Pinatubo_anim.gif)
![GMS-4 Infrared Window (11.5 µm) images [click to enlarge]](https://cimss.ssec.wisc.edu/satellite-blog/wp-content/uploads/sites/5/2016/06/19910615_gms4_infrared_Pinatubo_zoom_anim.gif)
![NOAA-10 AVHRR Infrared Window (10.8 µm), Visible (0.91 µm) and Shortwave Infrared (3.7 µm) images [click to enlarge]](https://cimss.ssec.wisc.edu/satellite-blog/wp-content/uploads/sites/5/2016/06/19919615_1034utc_noaa10_avhrr_Infrared_Visible_Shortwave_Infrared_Pinatubo_anim.gif)
![NOAA-10 AVHRR Infrared Window (10.8 µm), Visible (0.91 µm) and Shortwave Infrared (3.7 µm) images [click to enlarge]](https://cimss.ssec.wisc.edu/satellite-blog/wp-content/uploads/sites/5/2016/06/19919614_2329utc_noaa10_avhrr_Infrared_Visible_ShortwaveInfrared_Pinatubo_anim.gif)

/ARCTIC2016_06_22_174_npp.gif)
/na2016_06_15_167.gif)