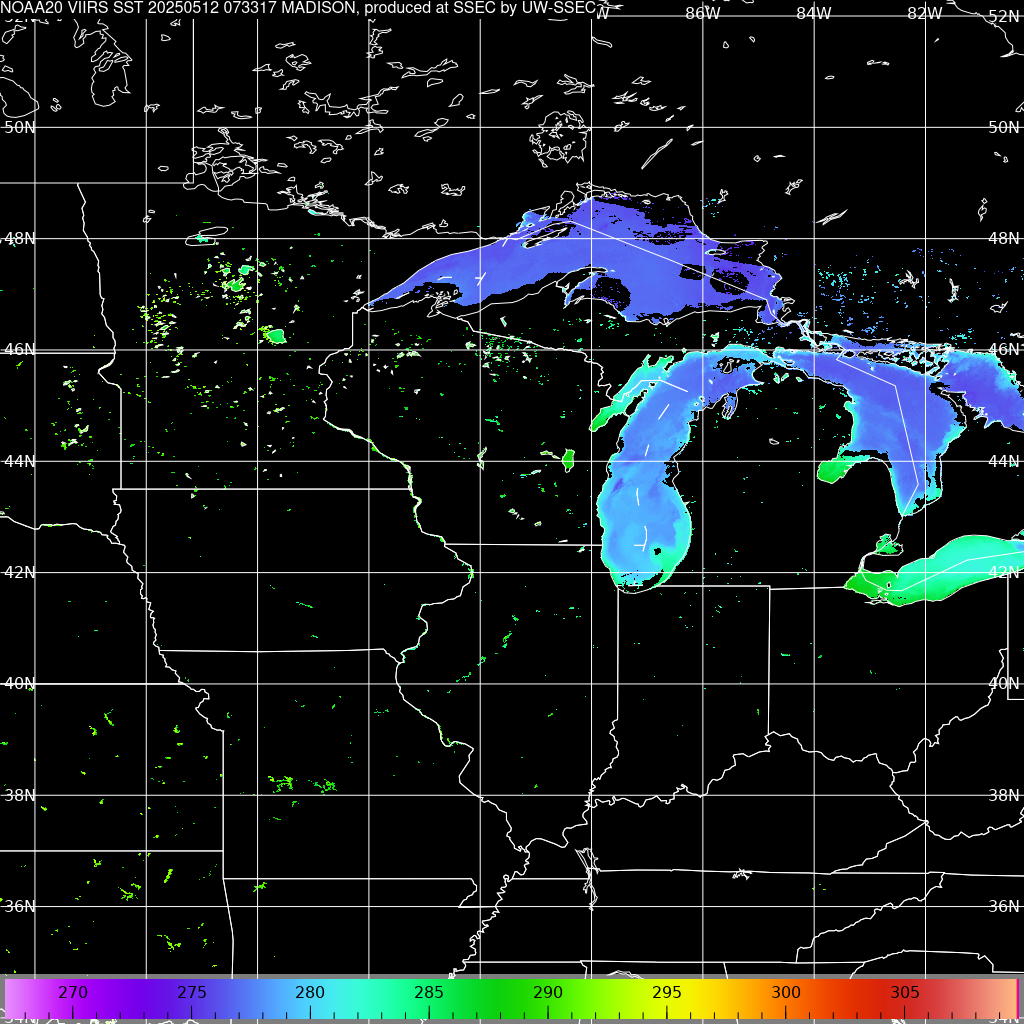
It was another clear night over the Great Lakes on 12 May 2025 and NOAA-20 had a descending orbit over western lower Michigan around 0740 UTC that allowed a view of all five Great Lakes. CSPP software running at CIMSS produces both SDR (Sensor Data Record) and EDR (Environmental Data Record) files that can be then manipulated by polar2grid to create imagery. There are sites where imagery is routinely available. The image below, for example, shows NOAA-20 ACSPO SSTs from the CIMSS DBPS website, as discussed here, but that Madison-centered image does not include Lake Ontario, and the colorbar used is a little too warm for mid-May! (Note: RealEarth also used the data)
The direct broadcast website (https://ftp.ssec.wisc.edu/pub/eosdb/) does include an image of the entire Great Lakes produced by NOAA-20 data (at this ephemeral url). Again, the colorbar is a little too warm.
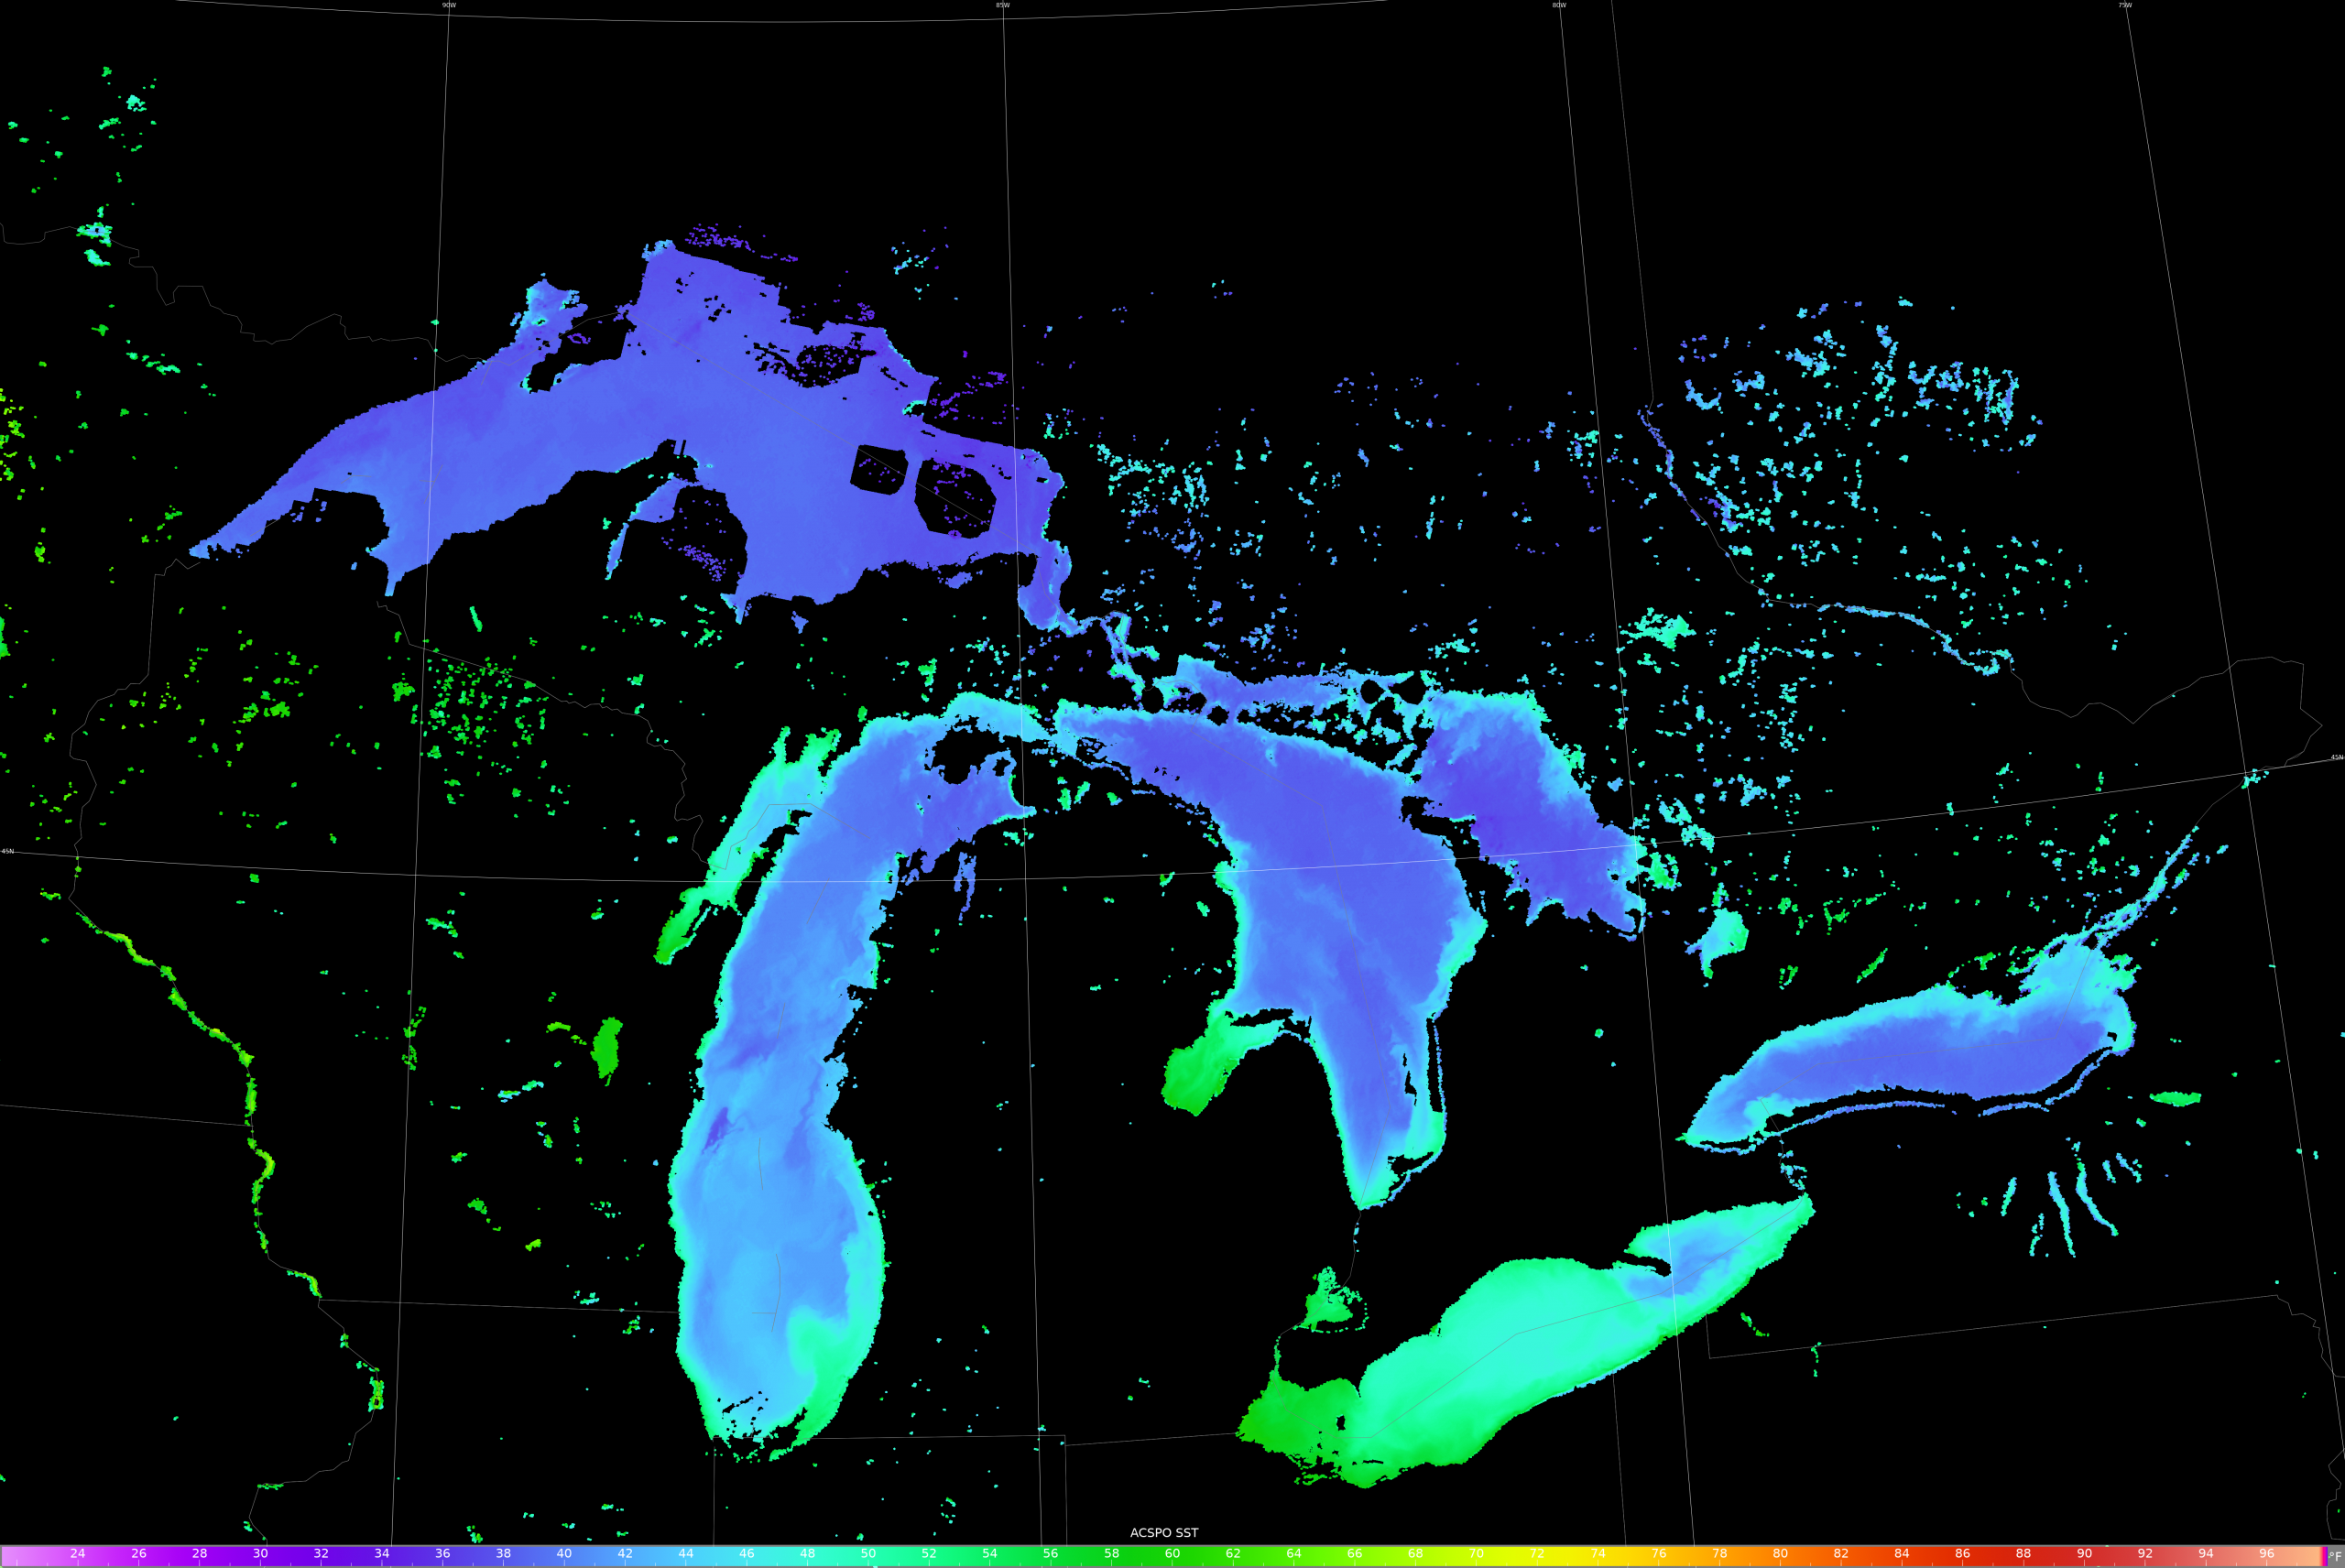
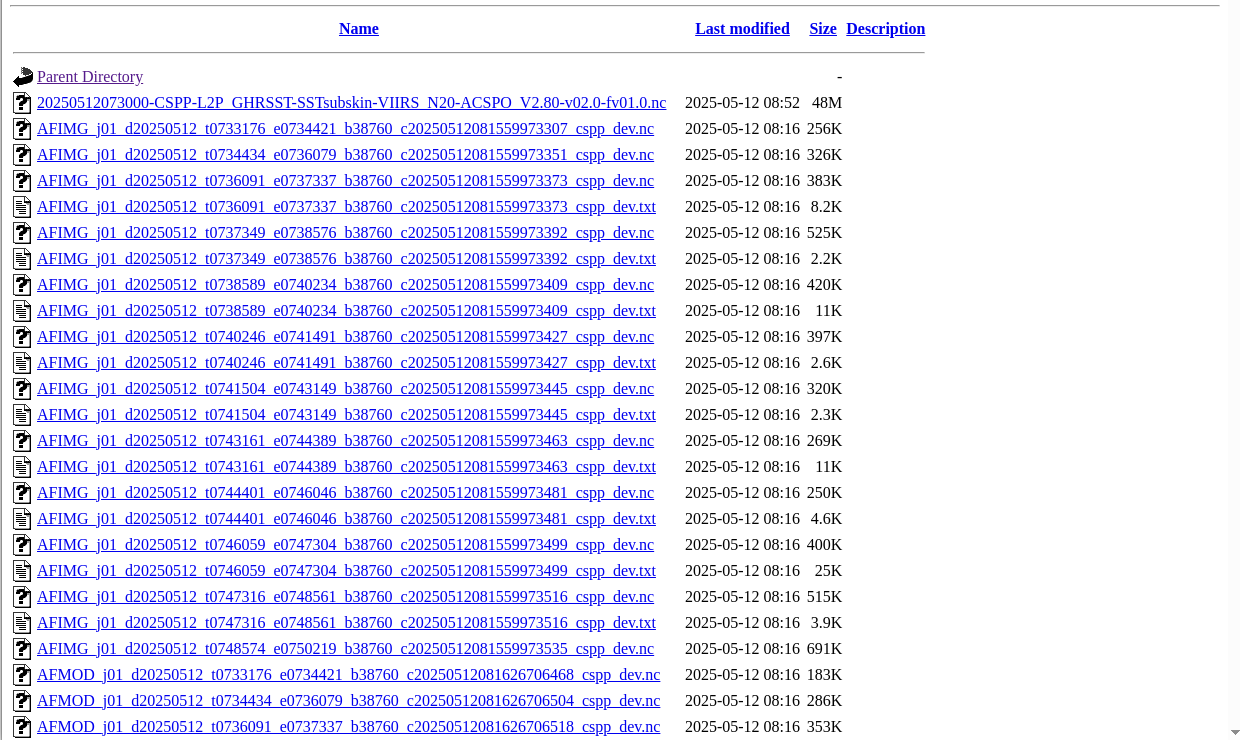
The data to create (using polar2grid) more customized imagery is available at the CIMSS ftp site mentioned above. ACSPO SSTs can be created using an EDR file (that is, the file 20250512073000-CSPP-L2P_GHRSST-SSTsubskin-VIIRS_N20-ACSPO_V2.80-v02.0-fv01.0.nc shown in this file list at https://ftp.ssec.wisc.edu/eosdb/j01/viirs/2025_05_12_132_0733/edr/. I then followed the directions in the polar2grid documentation here to produce a Lake Surface Temperature scaled from 273.15 K – 293.15 K. The commands I used are listed below. Note that ‘p2g_sst_palette.txt’ is pre-loaded within the polar2grid directories. The ‘rescale.yaml’ file is something I created following the documentation.
../p2g_grid_helper.sh greatlakes -83.5 45.1 750 -750 1800 1200 > GreatLakes.yaml
../polar2grid.sh -r acspo -w geotiff -p sst -g greatlakes --grid-configs ./GreatLakes.yaml --extra-config-path ./rescale.yaml -f /pathToVIIRS_SSTfile/20250512073000-CSPP-L2P_GHRSST-SSTsubskin-VIIRS_N20-ACSPO_V2.80-v02.0-fv01.0.nc
../add_colormap.sh ../../colormaps/p2g_sst_palette.txt noaa20_viirs_sst_20250512_073317_greatlakes.tif
../add_coastlines.sh --add-coastlines --coastlines-resolution f --add-colorbar --colorbar-height 42 --colorbar-text-size 24  --colorbar-min 0.0 --colorbar-max 20.0 noaa20_viirs_sst_20250512_073317_greatlakes.tif
The SST image created with the commands above has no value — is transparent — where there is no water. Let’s put the SSTs on top of Day Night Band imagery, and for that I needed SDR files that can be found at https://ftp.ssec.wisc.edu/eosdb/j01/viirs/2025_05_12_132_0733/sdr/ ; I downloaded all the SVDNB files (containing the data) and the GDNB0 files (containing georeferencing) to an otherwise empty directory, and created the the DNB imagery. Of the three varieties of Day Night Band imagery created (hncc, dynamic and adaptive), I decided for this day that adaptive looked the most acceptable.
../p2g_grid_helper.sh greatlakes -83.5 45.1 750 -750 1800 1200 > GreatLakes.yaml
../polar2grid.sh -r viirs_sdr -w geotiff -p hncc_dnb dynamic_dnb adaptive_dnb -g greatlakes --grid-configs ./GreatLakes.yaml -f /pathToFiles/DNB/*
../add_coastlines.sh --add-coastlines --coastlines-resolution f *dnb*.tif
I then used ImageMagick, shown below, to combine the two images.
convert -composite -gravity center noaa20_viirs_adaptive_dnb_20250512_073317_greatlakes.png noaa20_viirs_sst_20250512_073317_greatlakes.png NOAA20_VIIRS_DNB_ACSPO_SST_20250512_0733UTC.png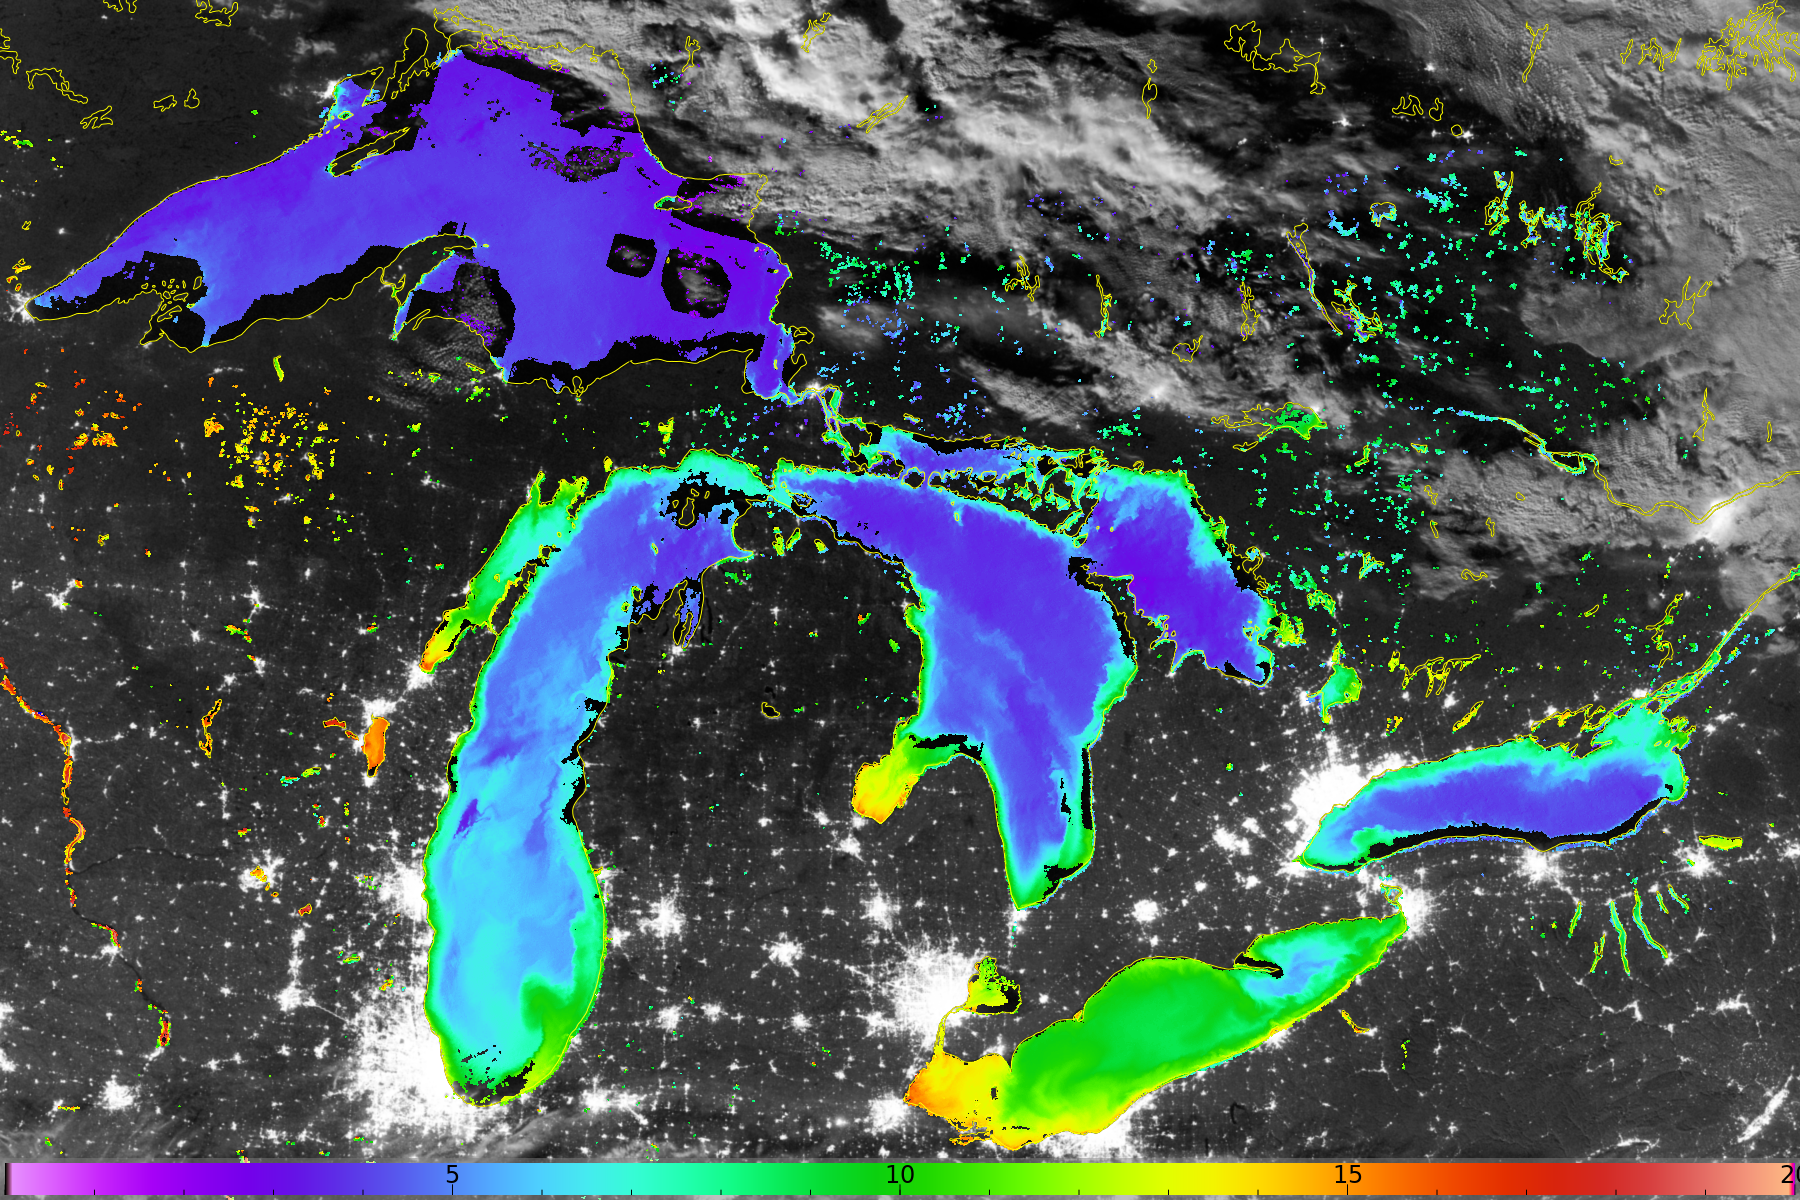
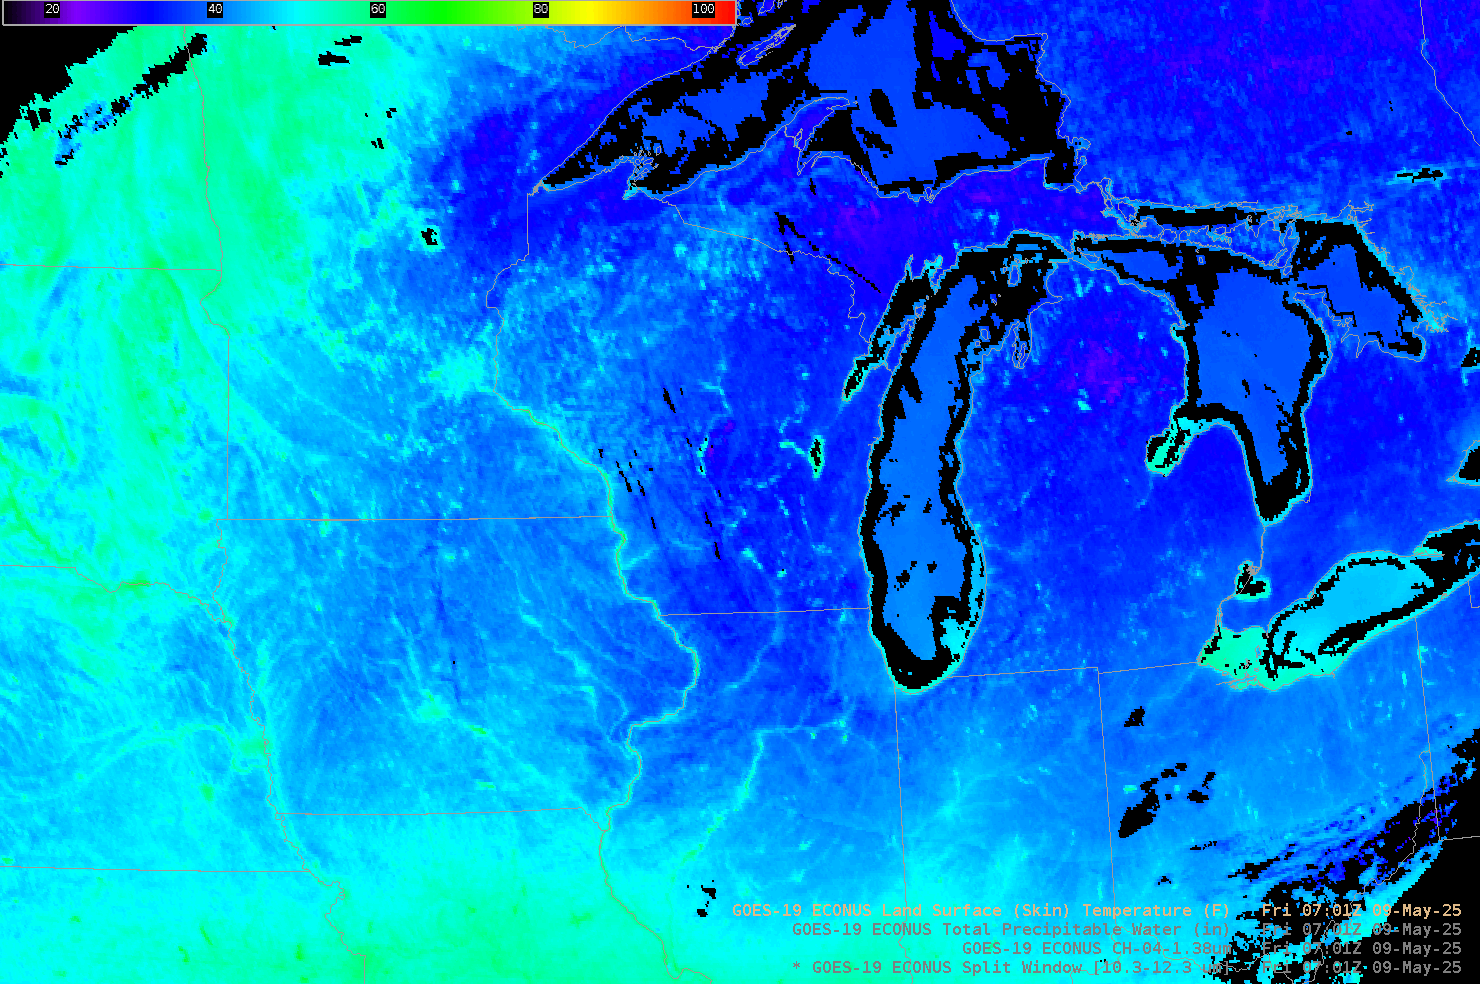
Western Lake Erie, as is typical, has the warmest waters — almost 60o F! Saginaw and Green Bays also have relatively warm water. In contrast, Lake Superior and much of Lakes Huron and Ontario remain very cold — 40o F or cooler.
View only this post Read Less


