
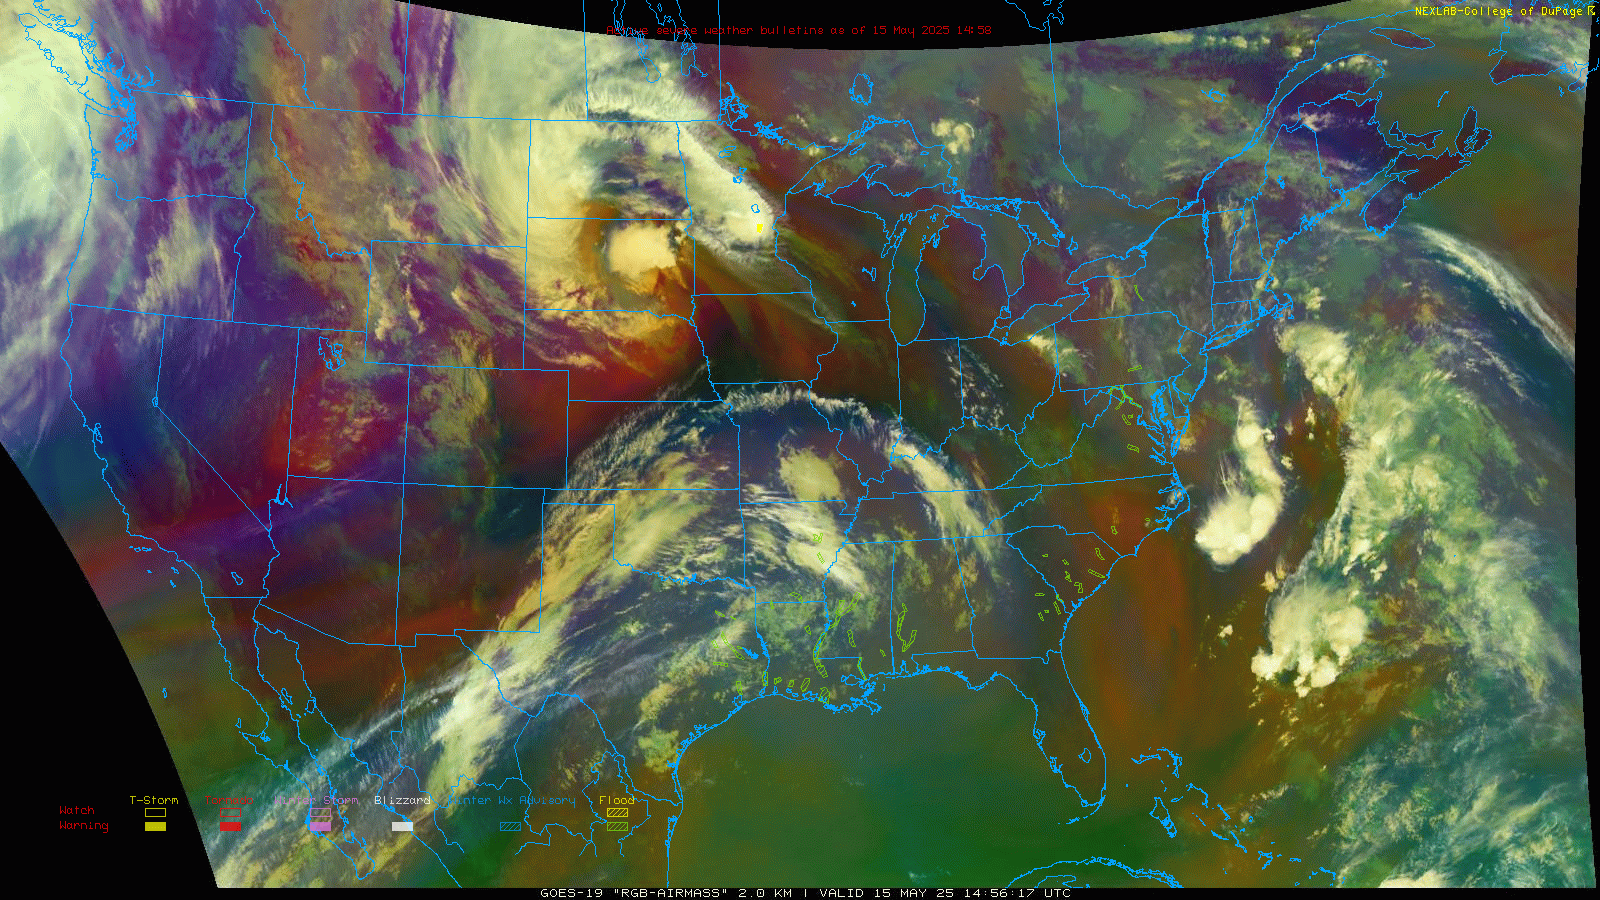
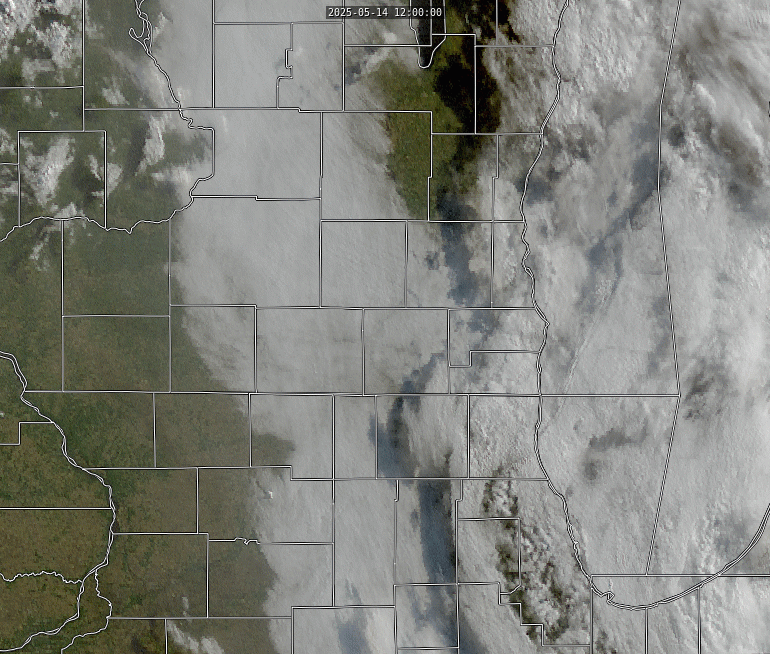
A negatively tilted shortwave trough and associated dynamical response created a rapidly deepening surface low in the Dakotas on May 15. These features worked together to bring high theta-E air from the southern U.S. up into Minnesota and Wisconsin, creating ample instability in the region. A strong mid-level jet streak provided deep-layer shear, and a surface dryline and large-scale dynamical lift provided the forcing mechanisms.
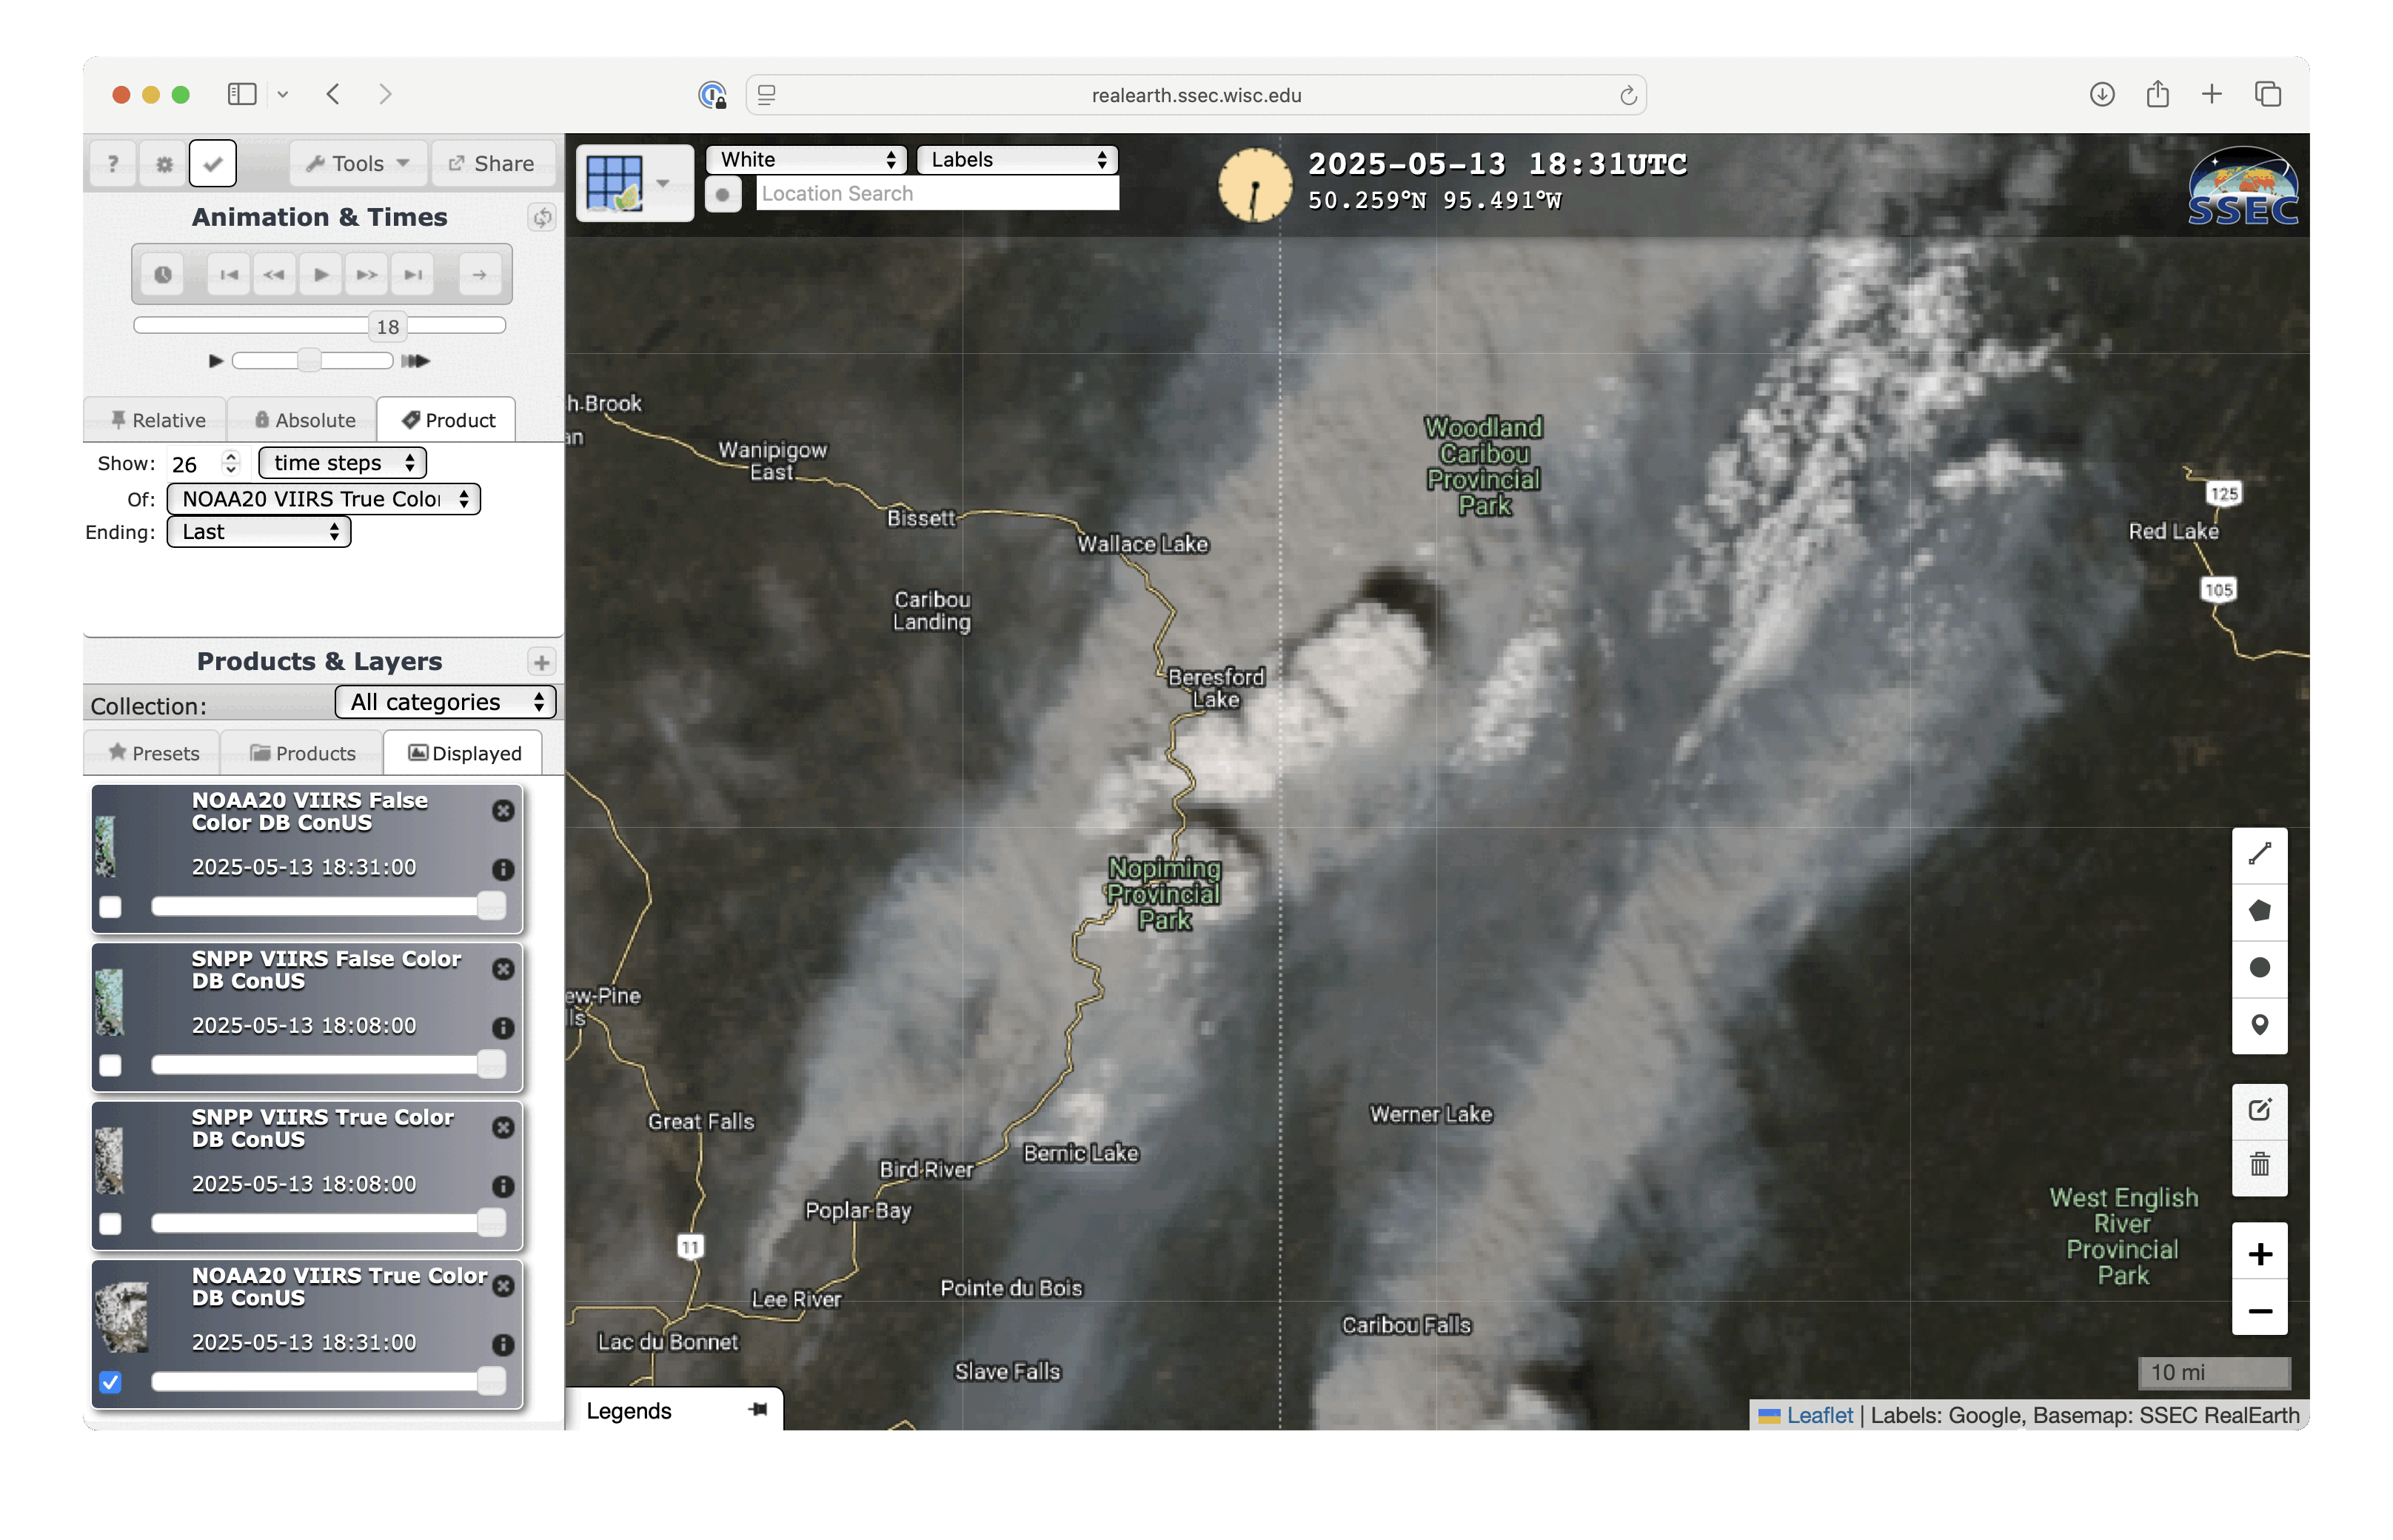
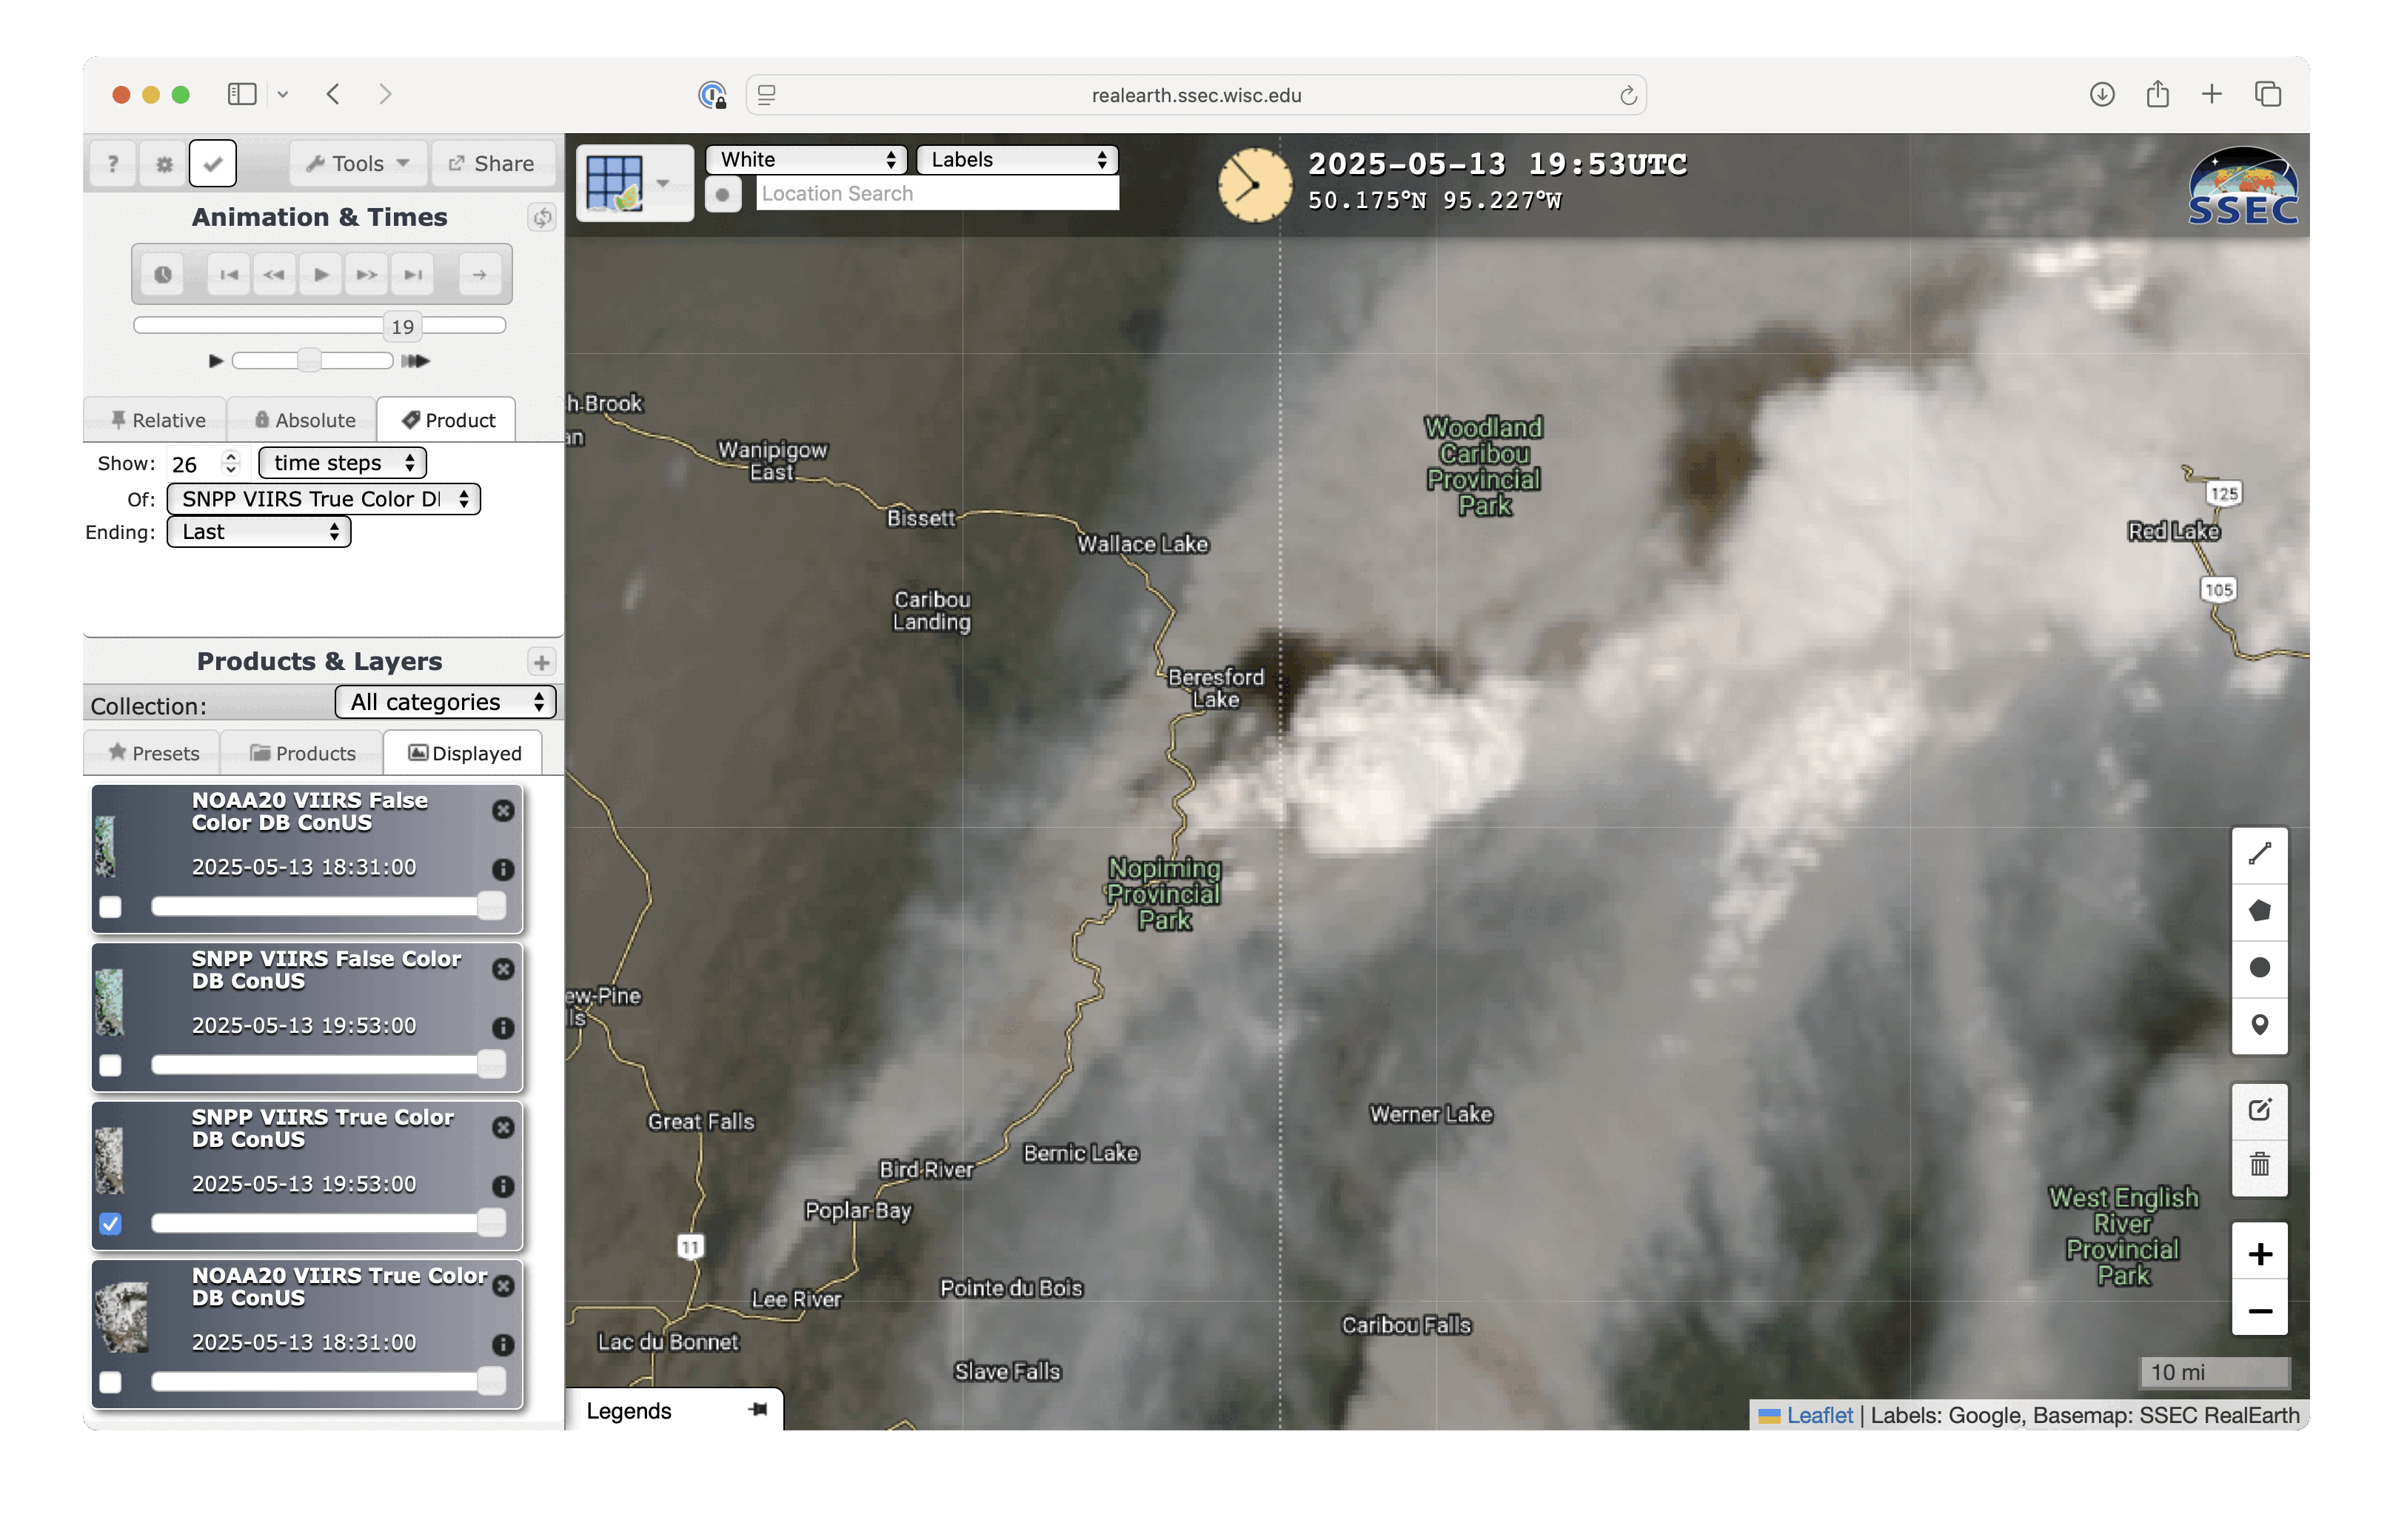
In the animation below, one can see the spiraling low pressure system in the Dakotas heading towards Minnesota. Deep convection lights up on and ahead of a surface dryline, which separates the dry air to its west from the warm, moist air to its east.
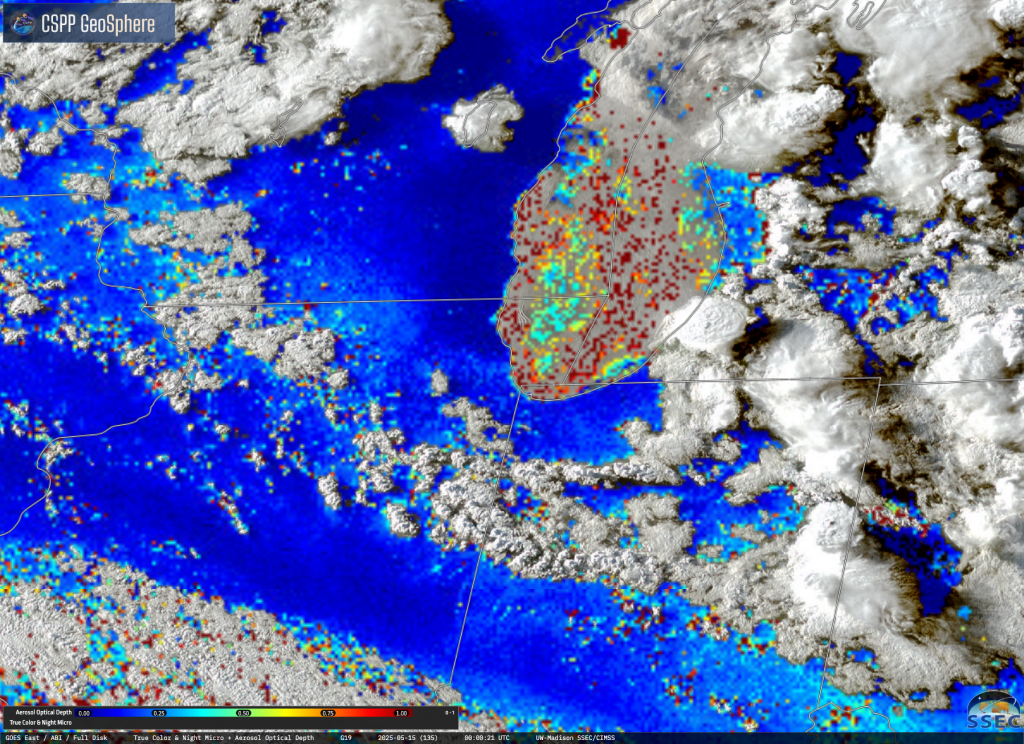
The ProbSevere LightningCast model uses AI and images of GOES-R data to predict the probability of next-hour lightning. It is expected to be operational in NOAA this summer, but NWS forecasters currently use an experimental feed from CIMSS to help monitor convection and provide messaging for decision support on lightning potential to stakeholders (e.g., event managers).
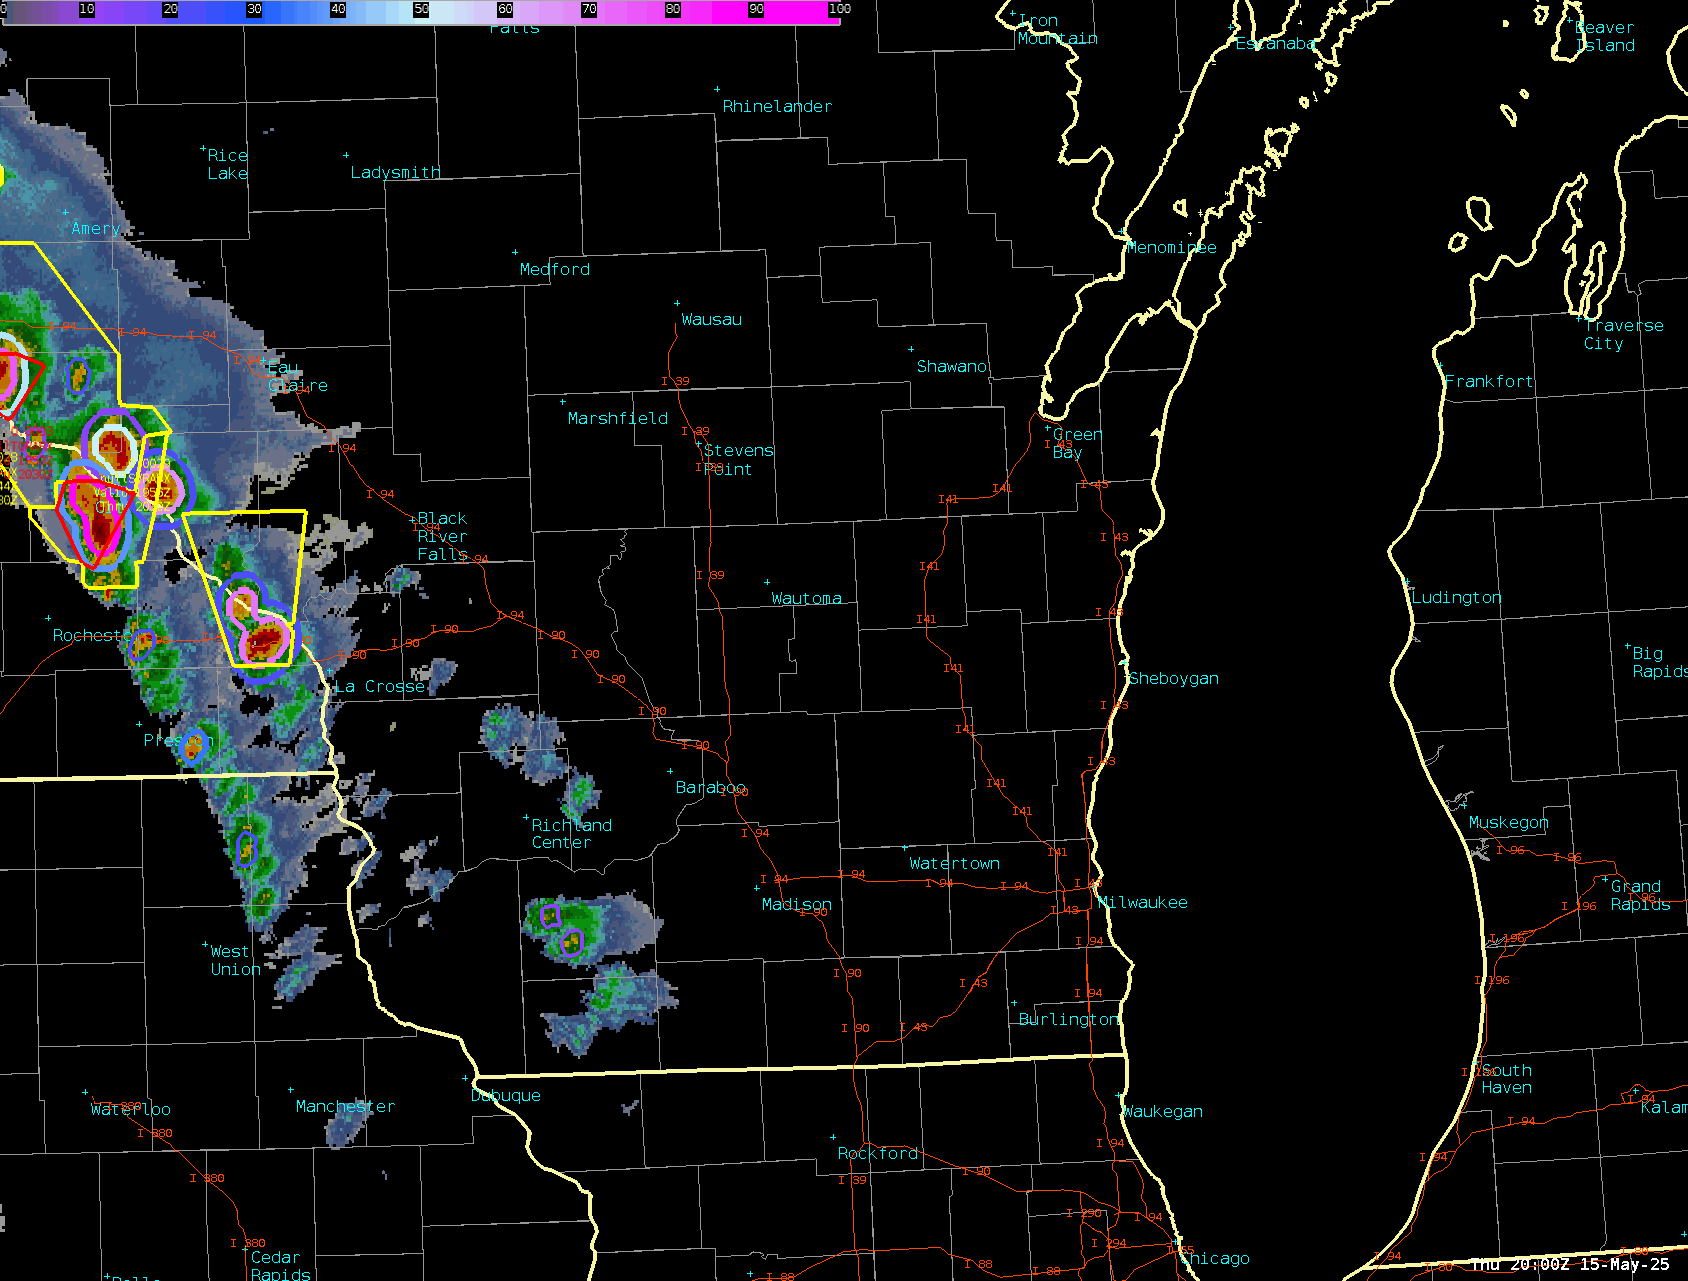
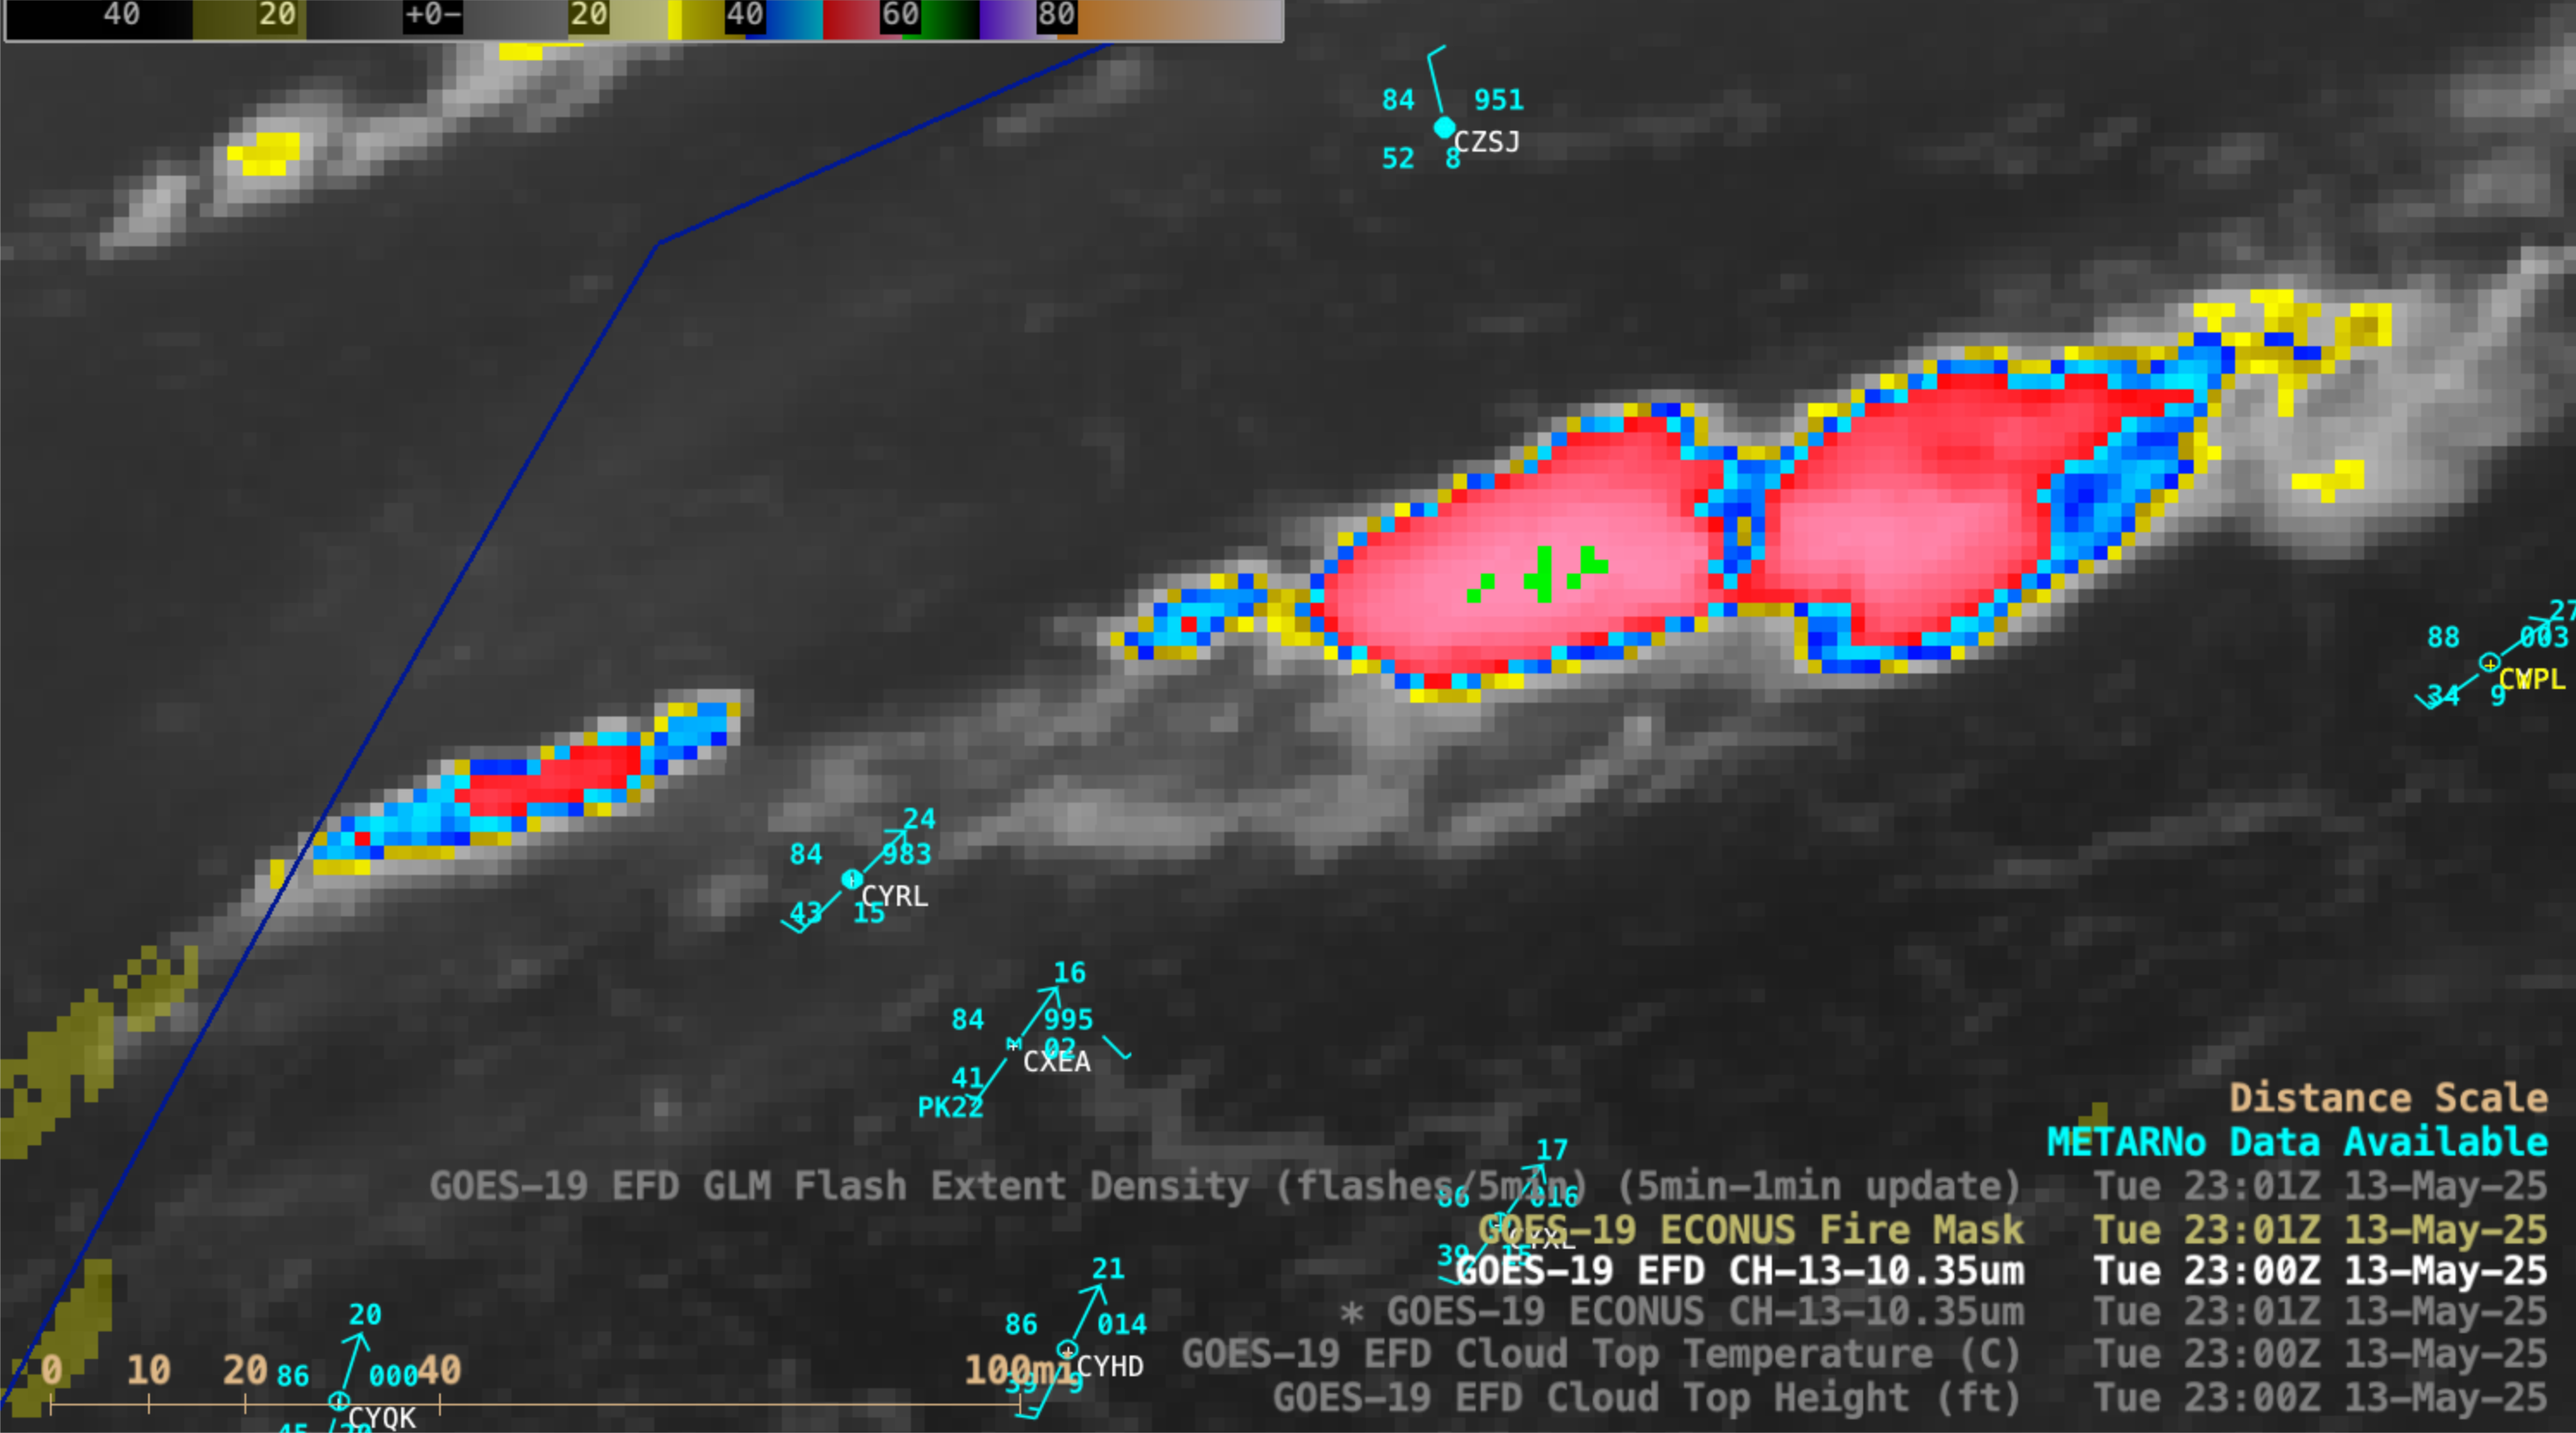
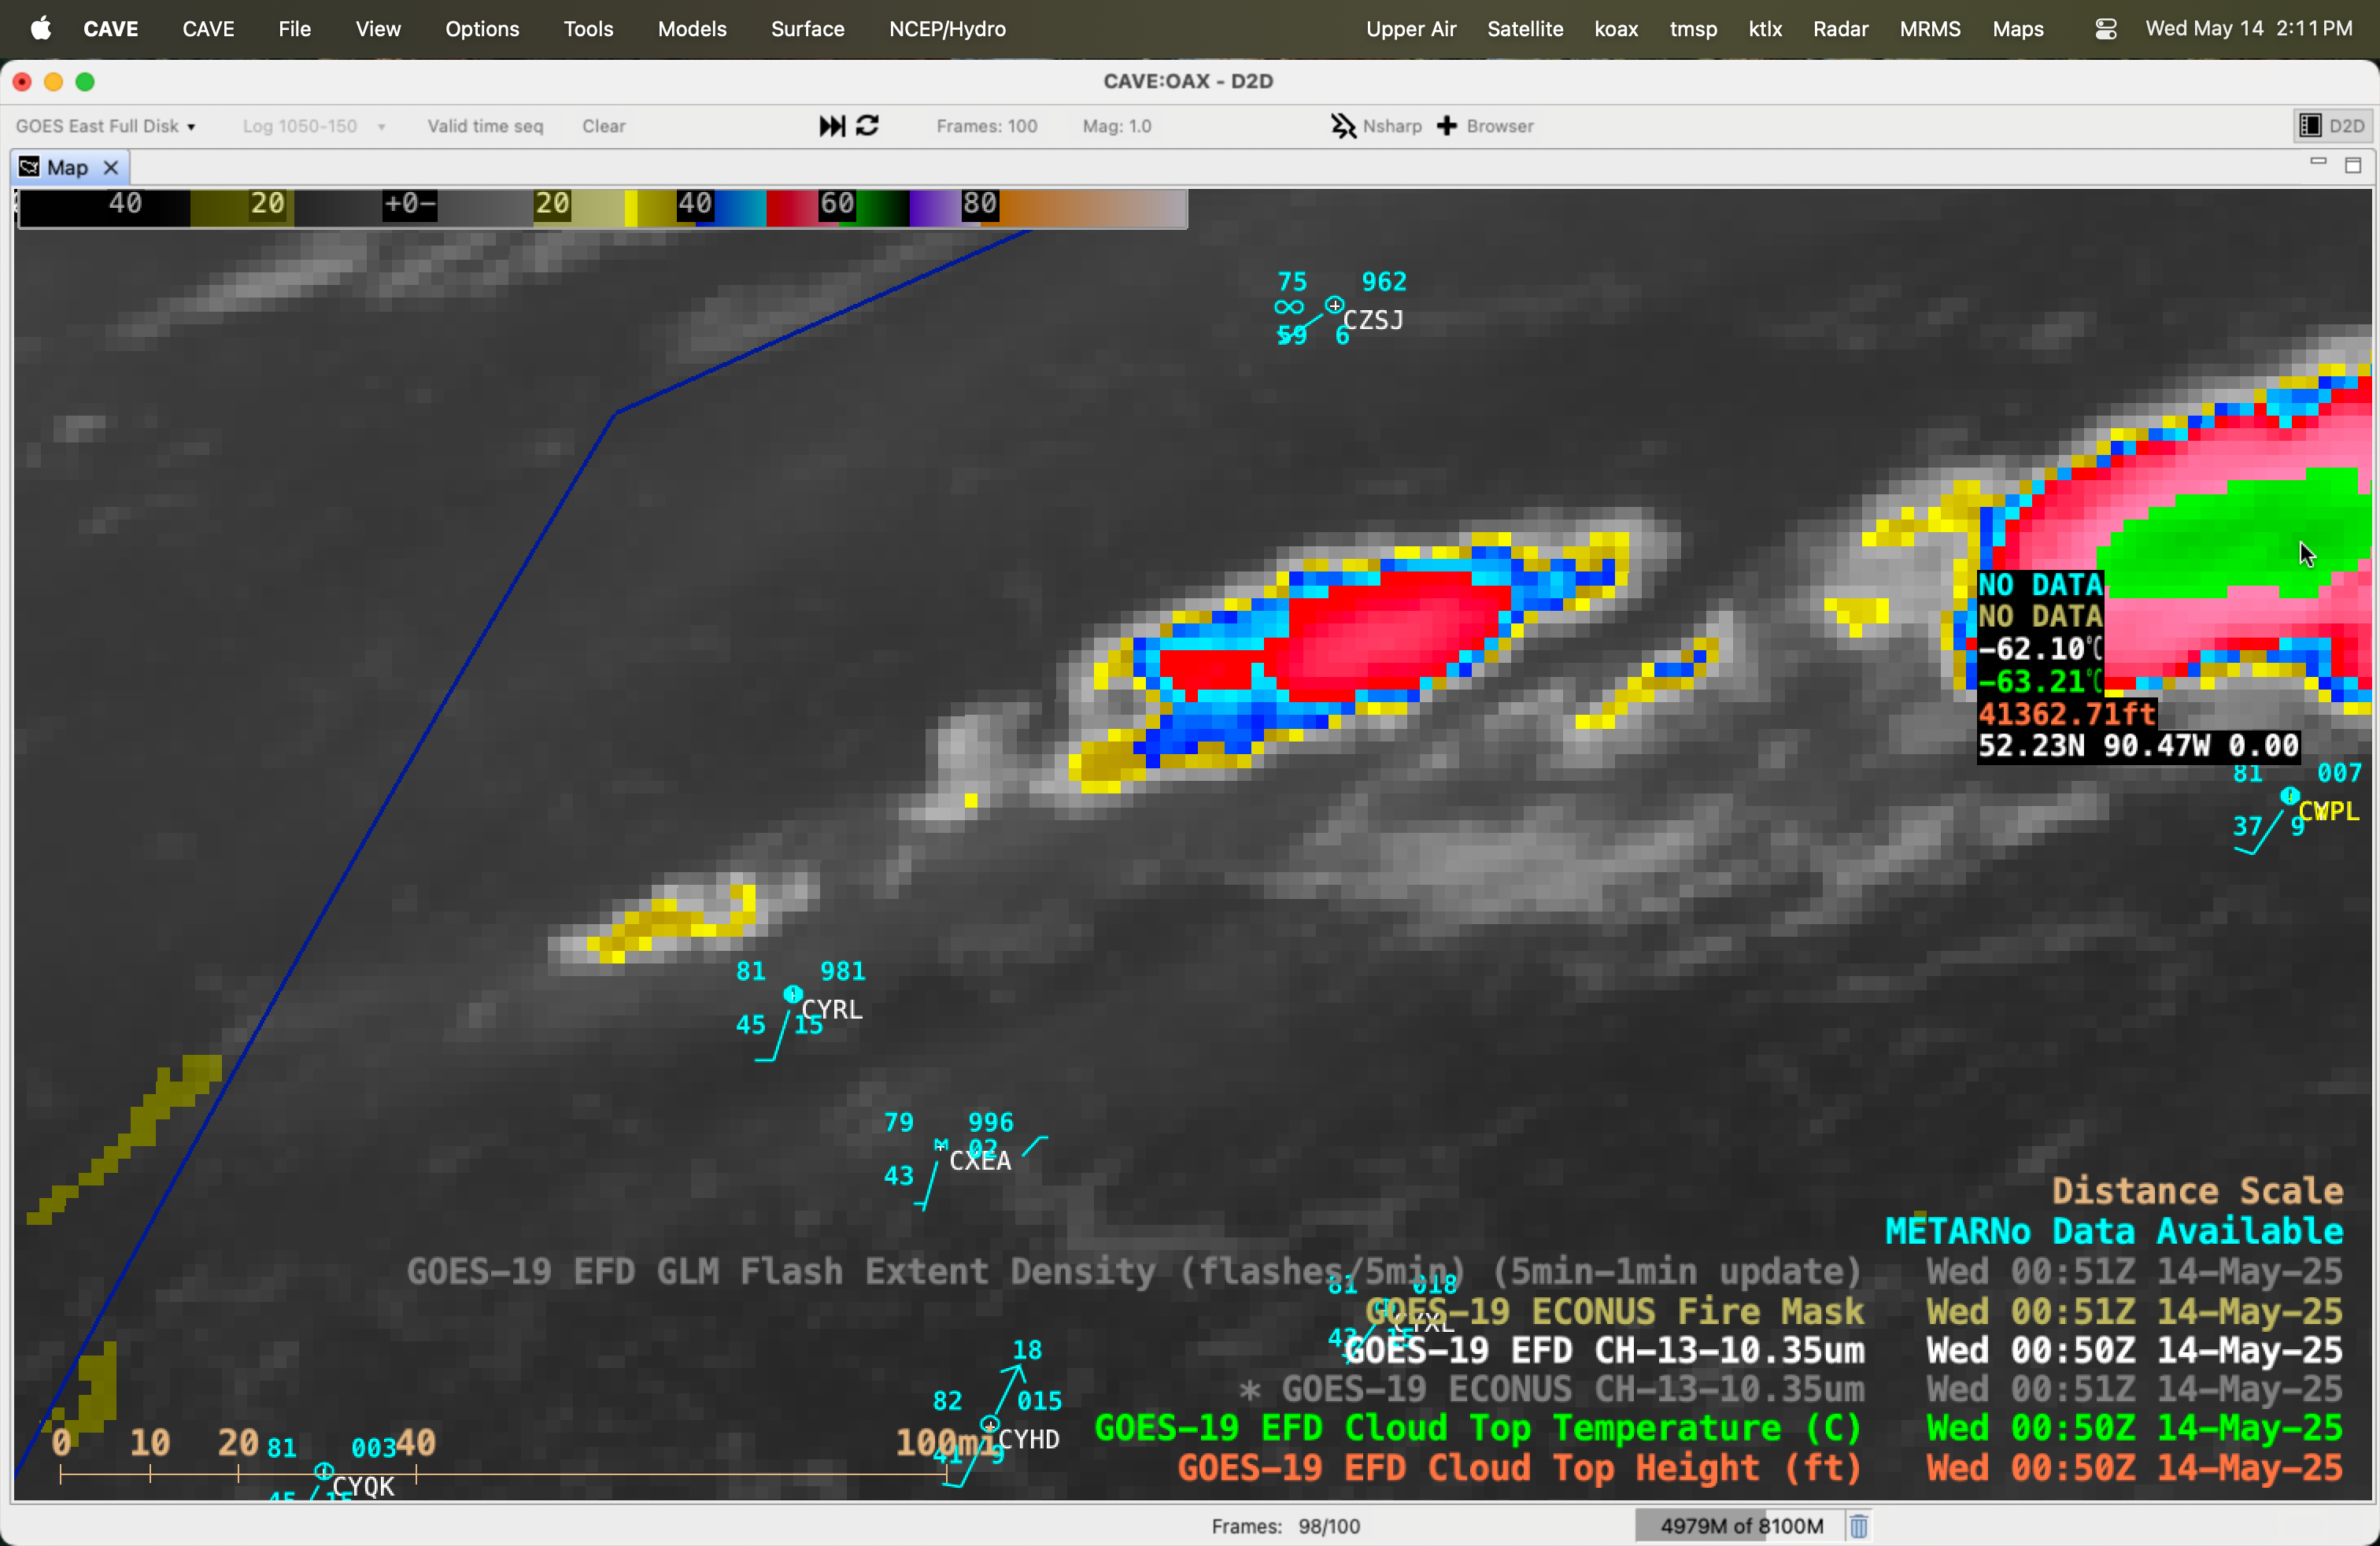
In the animation below, LightningCast probabilities were computed and displayed every minute, using a GOES-East mesoscale sector. The LightningCast output follows the deep convection heading into the Twin Cities region of Minnesota. Further south, LightningCast “sees” bubbling cumuliform clouds and anticipates electrification down the dryline by predicting higher probabilities before the observed lightning. Ahead of the dryline, LightningCast predicts increased probabilities on more-agitated cumulus clouds in southwest Wisconsin, despite some obscuring cirrus clouds (bluish-gray). Even with some explosive cloud growth, LightningCast provided 10-20 minutes of lead time to the first observed GLM flashes (GLM=Geostationary Lightning Mapper) in many new convective cores. This tool can provide automated, quantitative, calibrated guidance to forecasters for short-term lightning potential.
As many storms matured into supercells, all hazards were possible, including tornadoes. ProbSevere v3 uses satellite, radar, lightning, and NWP analysis data to predict next-hour severe-weather probabilities in a storm-object-based framework. Just about every storm had a severe-weather warning on it, issued by the NWS. ProbSevere can help forecasters perform triage in a busy situation (as this day certainly was), prioritizing threats. Many of these storms produced large hail, including 4″ hail in Eau Claire, Wisconsin and numerous 2″ hail reports across the state.
Only ProbTor and tornado warnings are plotted below (and MRMS MergedReflectivity background). From this, we can see that ProbTor does a good job highlighting the storms with enhanced tornado probabilities (blue-to-white-to-pink contours). Most of these storms had tornado warnings, and several tornadoes were reported in Wisconsin.
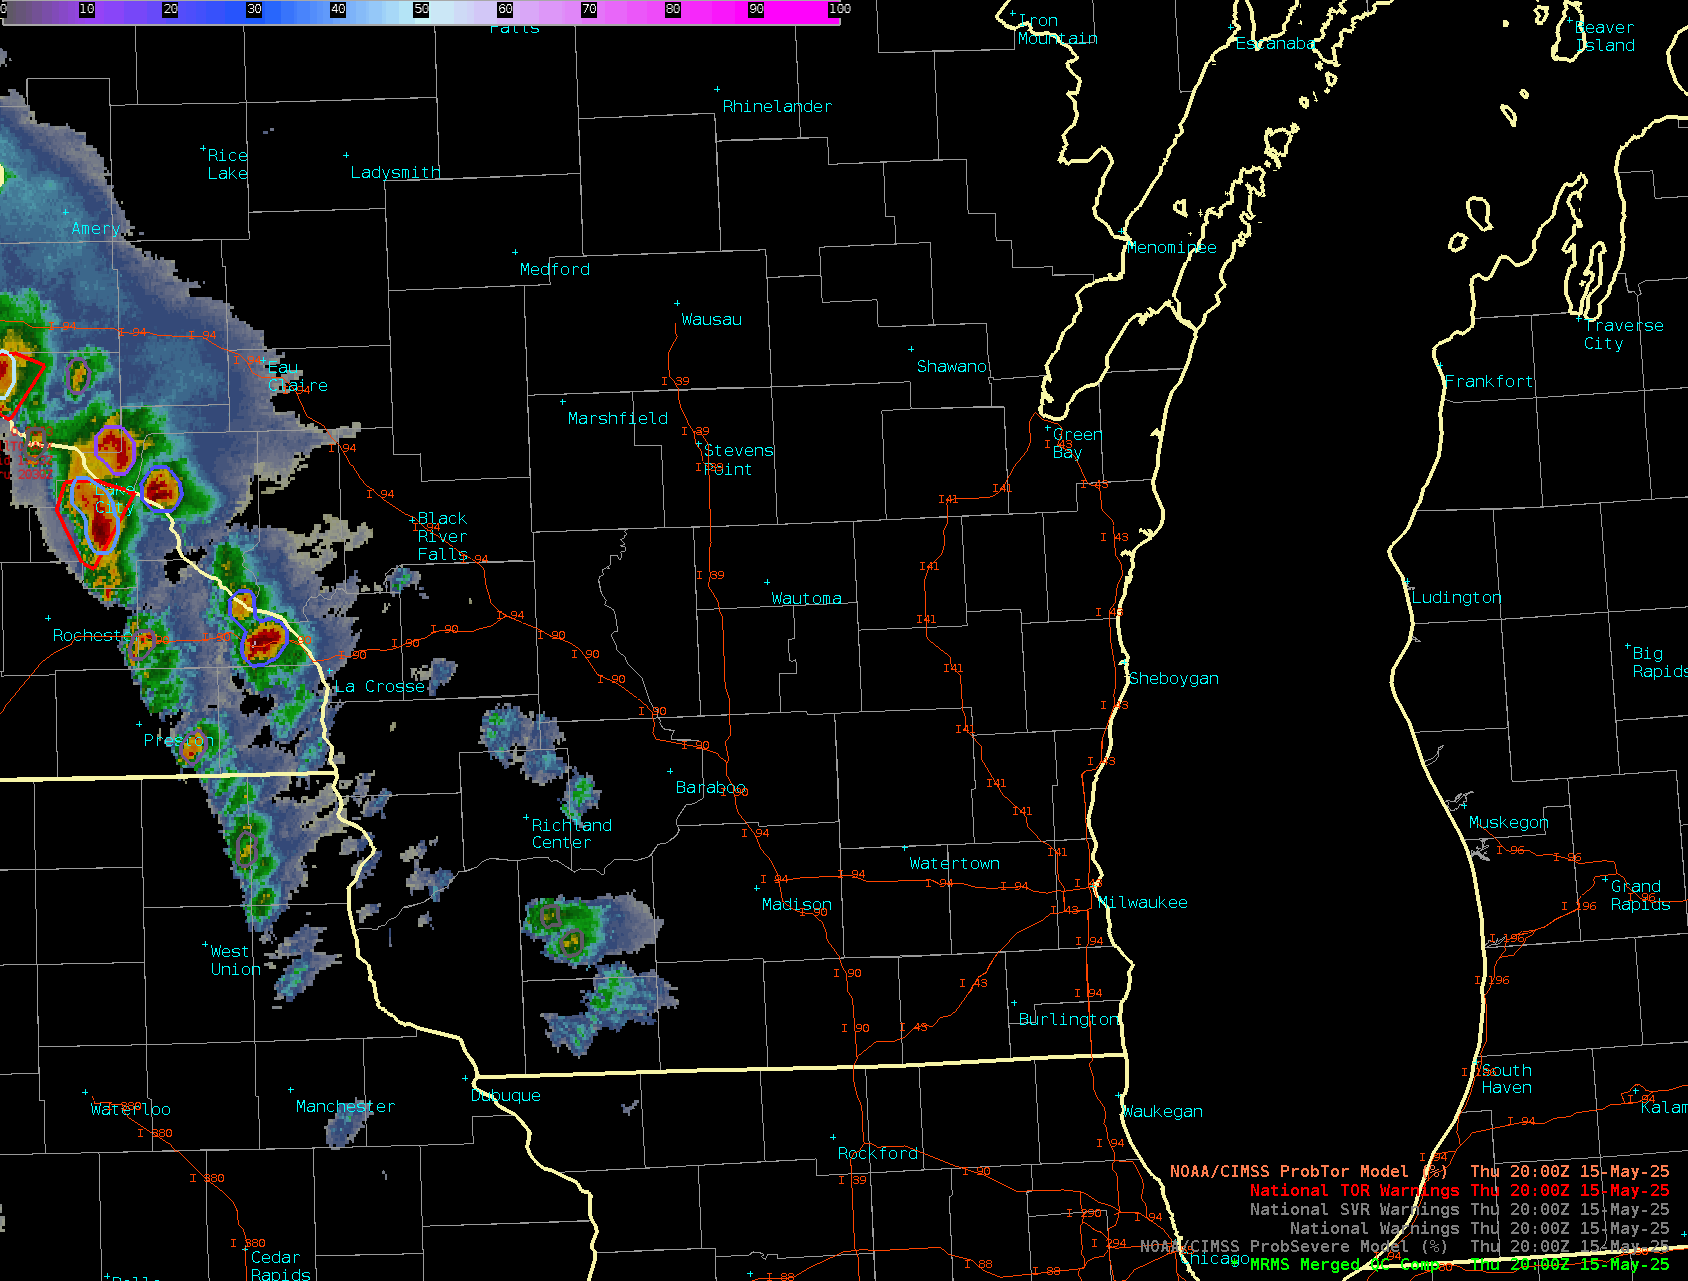
Along with the color-coded probabilities, forecasters can “hover” over storms with their cursor to see storm attributes. Let’s take a look at a couple of tornadic storms.
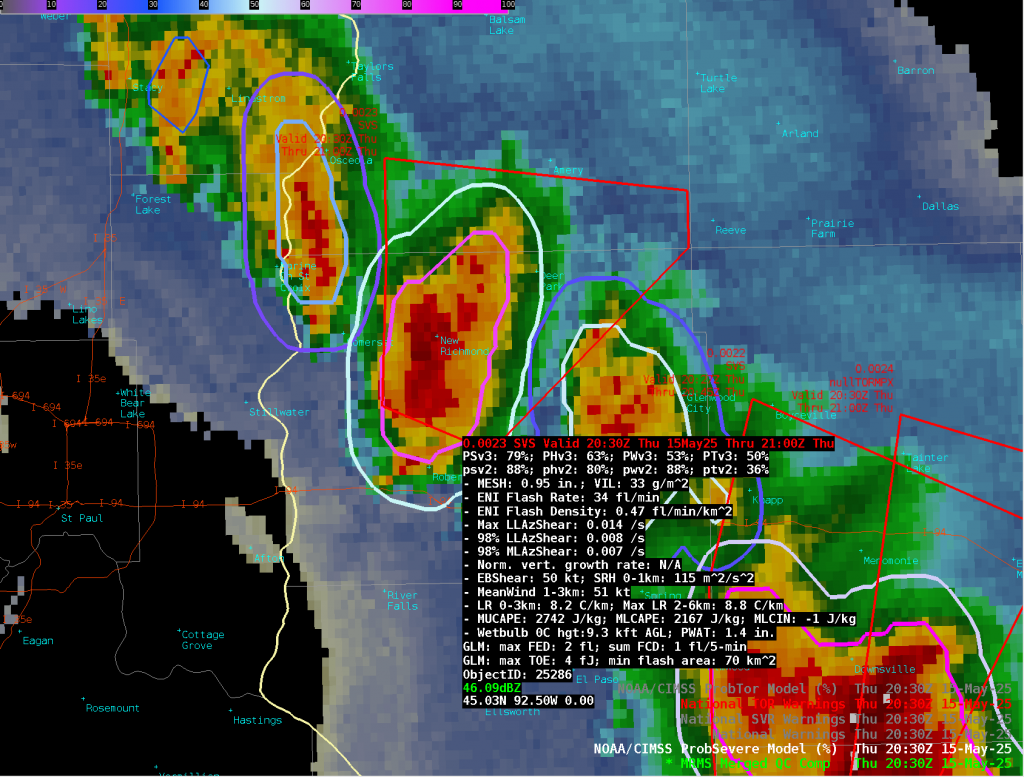
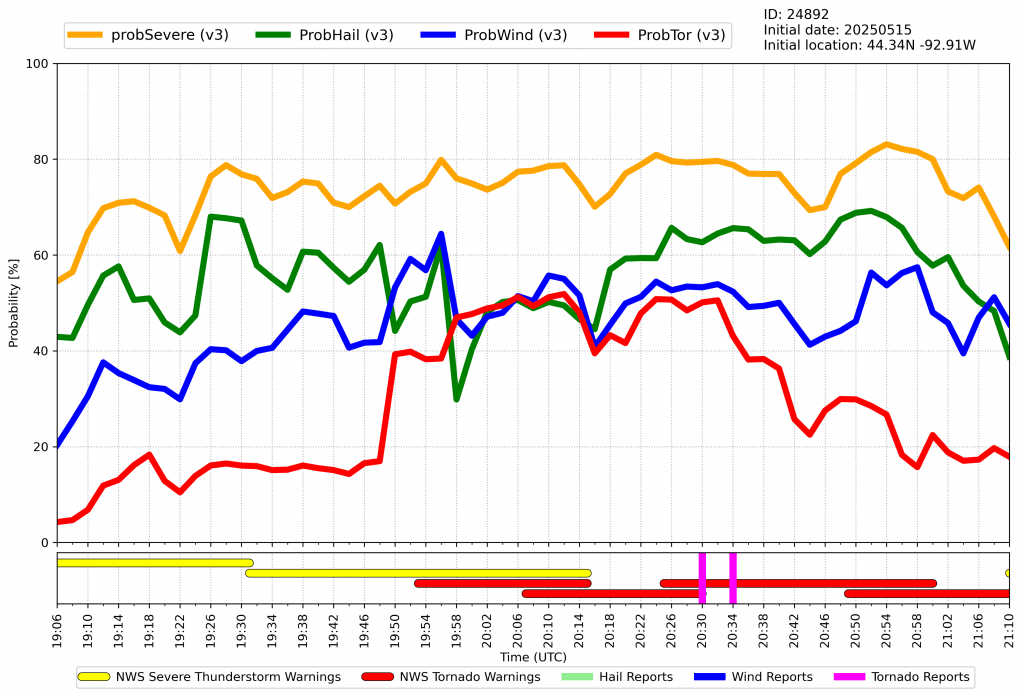
This storm east of the Twin Cities in Minnesota exhibited excellent radar rotational parameters (“AzShear”), strong deep layer shear, and very strong low-level kinematic parameters. Curiously, the ground-based total lightning flash rate was 34 flashes/min, whereas the space-based GLM lightning showed only 2 flashes in 5 minutes (FED=flash-extent density). This might be a case where the large cloud mass is dissipating the optical signal of lots of small flashes in the storm (“optical extinction”). In any event, ProbTor v3 had a 50% probability of tornado on this storm when a tornado was first reported. Users of ProbTor understand that 50% is a very high prediction for this model. The time series below (Figure 6) shows a large “jump” in tornado probability from 18% to 40%, about 4 minutes prior to the first tornado warning, due to an increase in low-level rotation. This storm went on to congeal with neighboring storms and produced numerous damaging wind reports in northwest Wisconsin.
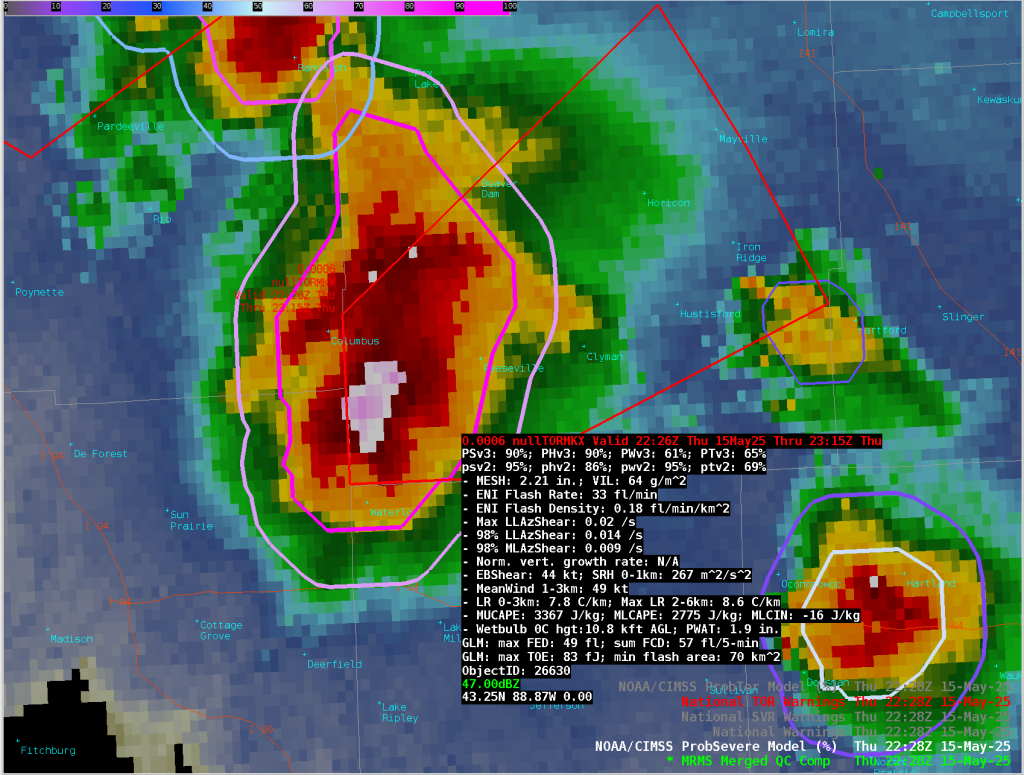
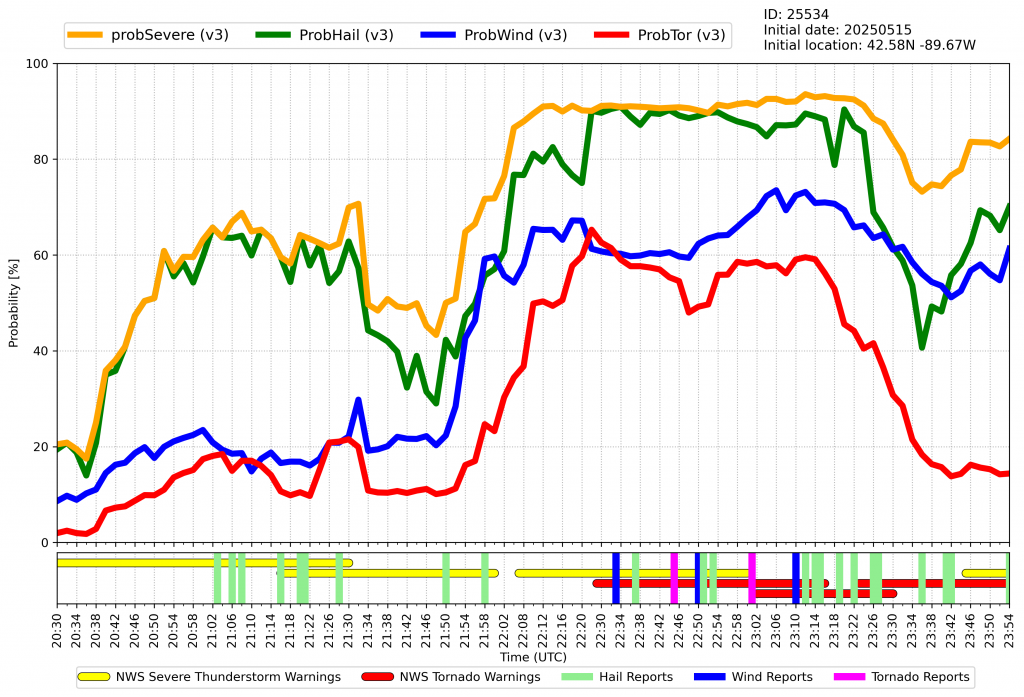
Another storm congealed from hail-producing storms in Dane County, into a large supercell that ravaged Dodge County with hail, wind, and tornadoes. In the image below, we again see that the environment was very favorable for tornadoes (high shear and storm-relative helicity), the expected hail size was large (MESH=2.21 in), the lightning flash rate was high, and the storm rotational parameters were exceptionally high. This all resulted in a probability of tornado of 65%. In the time series below, a tornado warning was issued after a steady climb in probability from 10% to 65%. While the reports in the time series are preliminary, tornadoes likely occurred in the 22:30-23:00 UTC time frame. The town of Mayville declared a state of emergency due to the extensive damage. Hopefully residents were able to take proper shelter due to the timely NWS tornado warning.
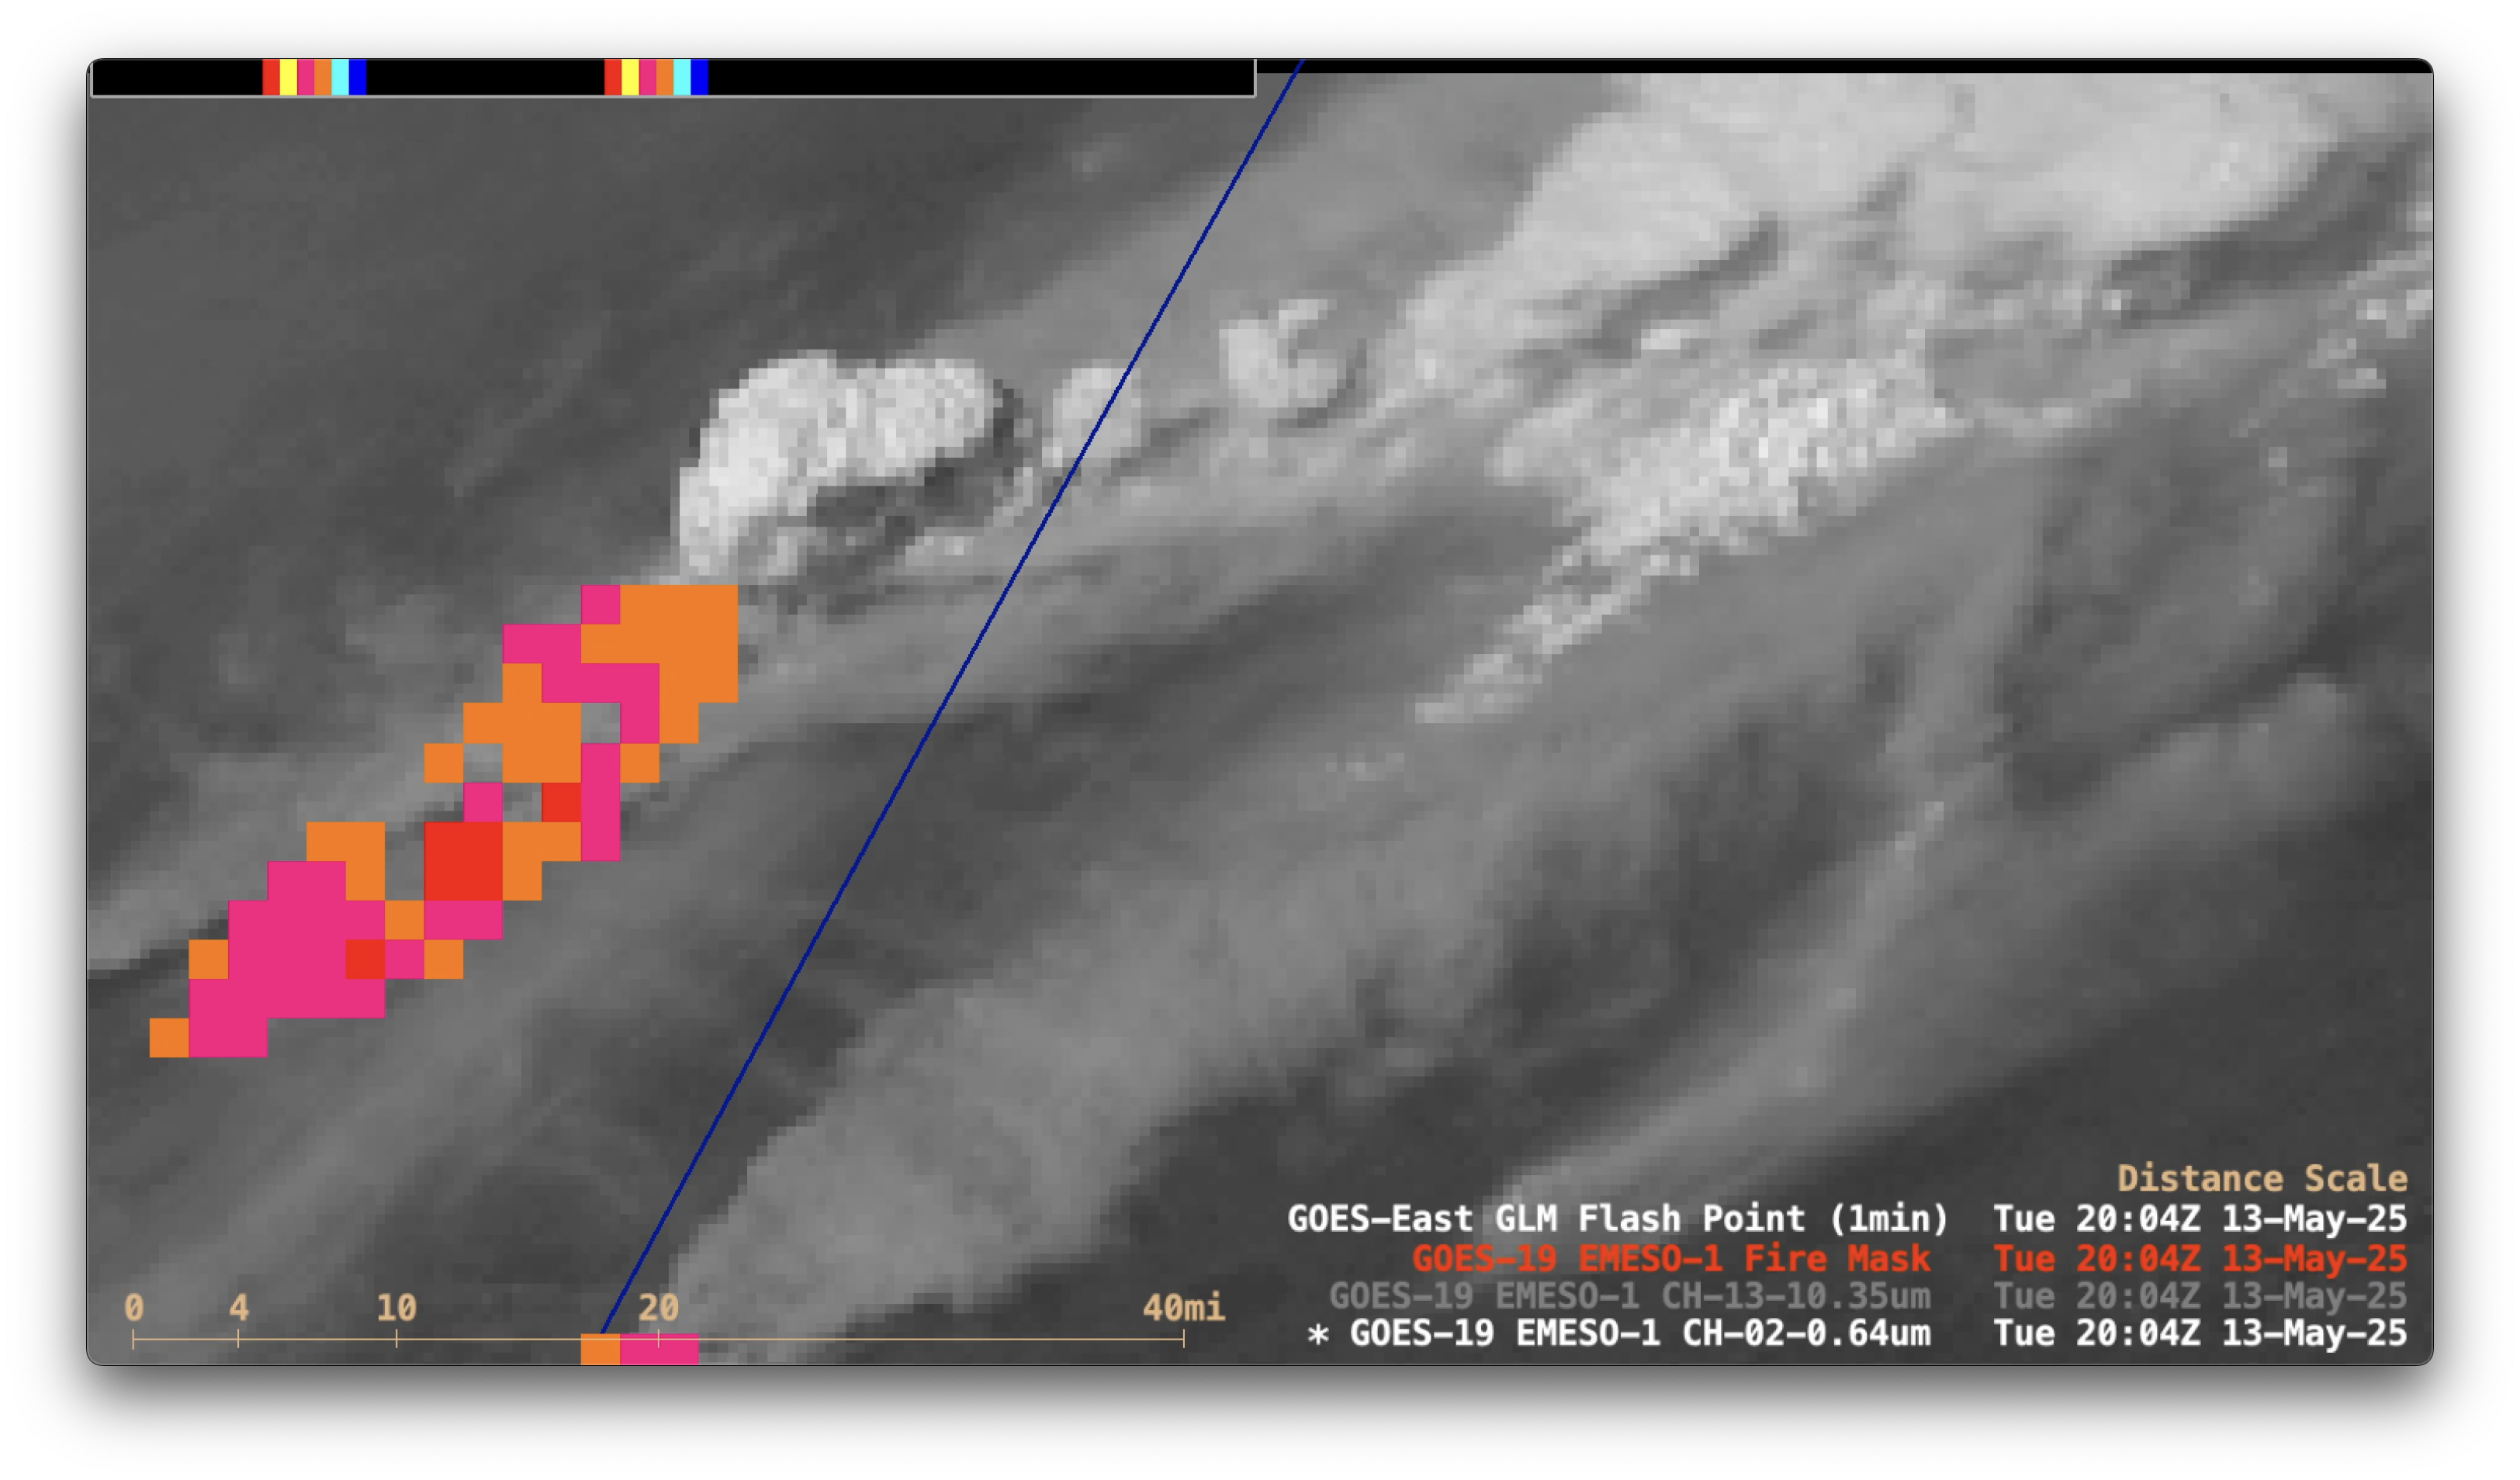
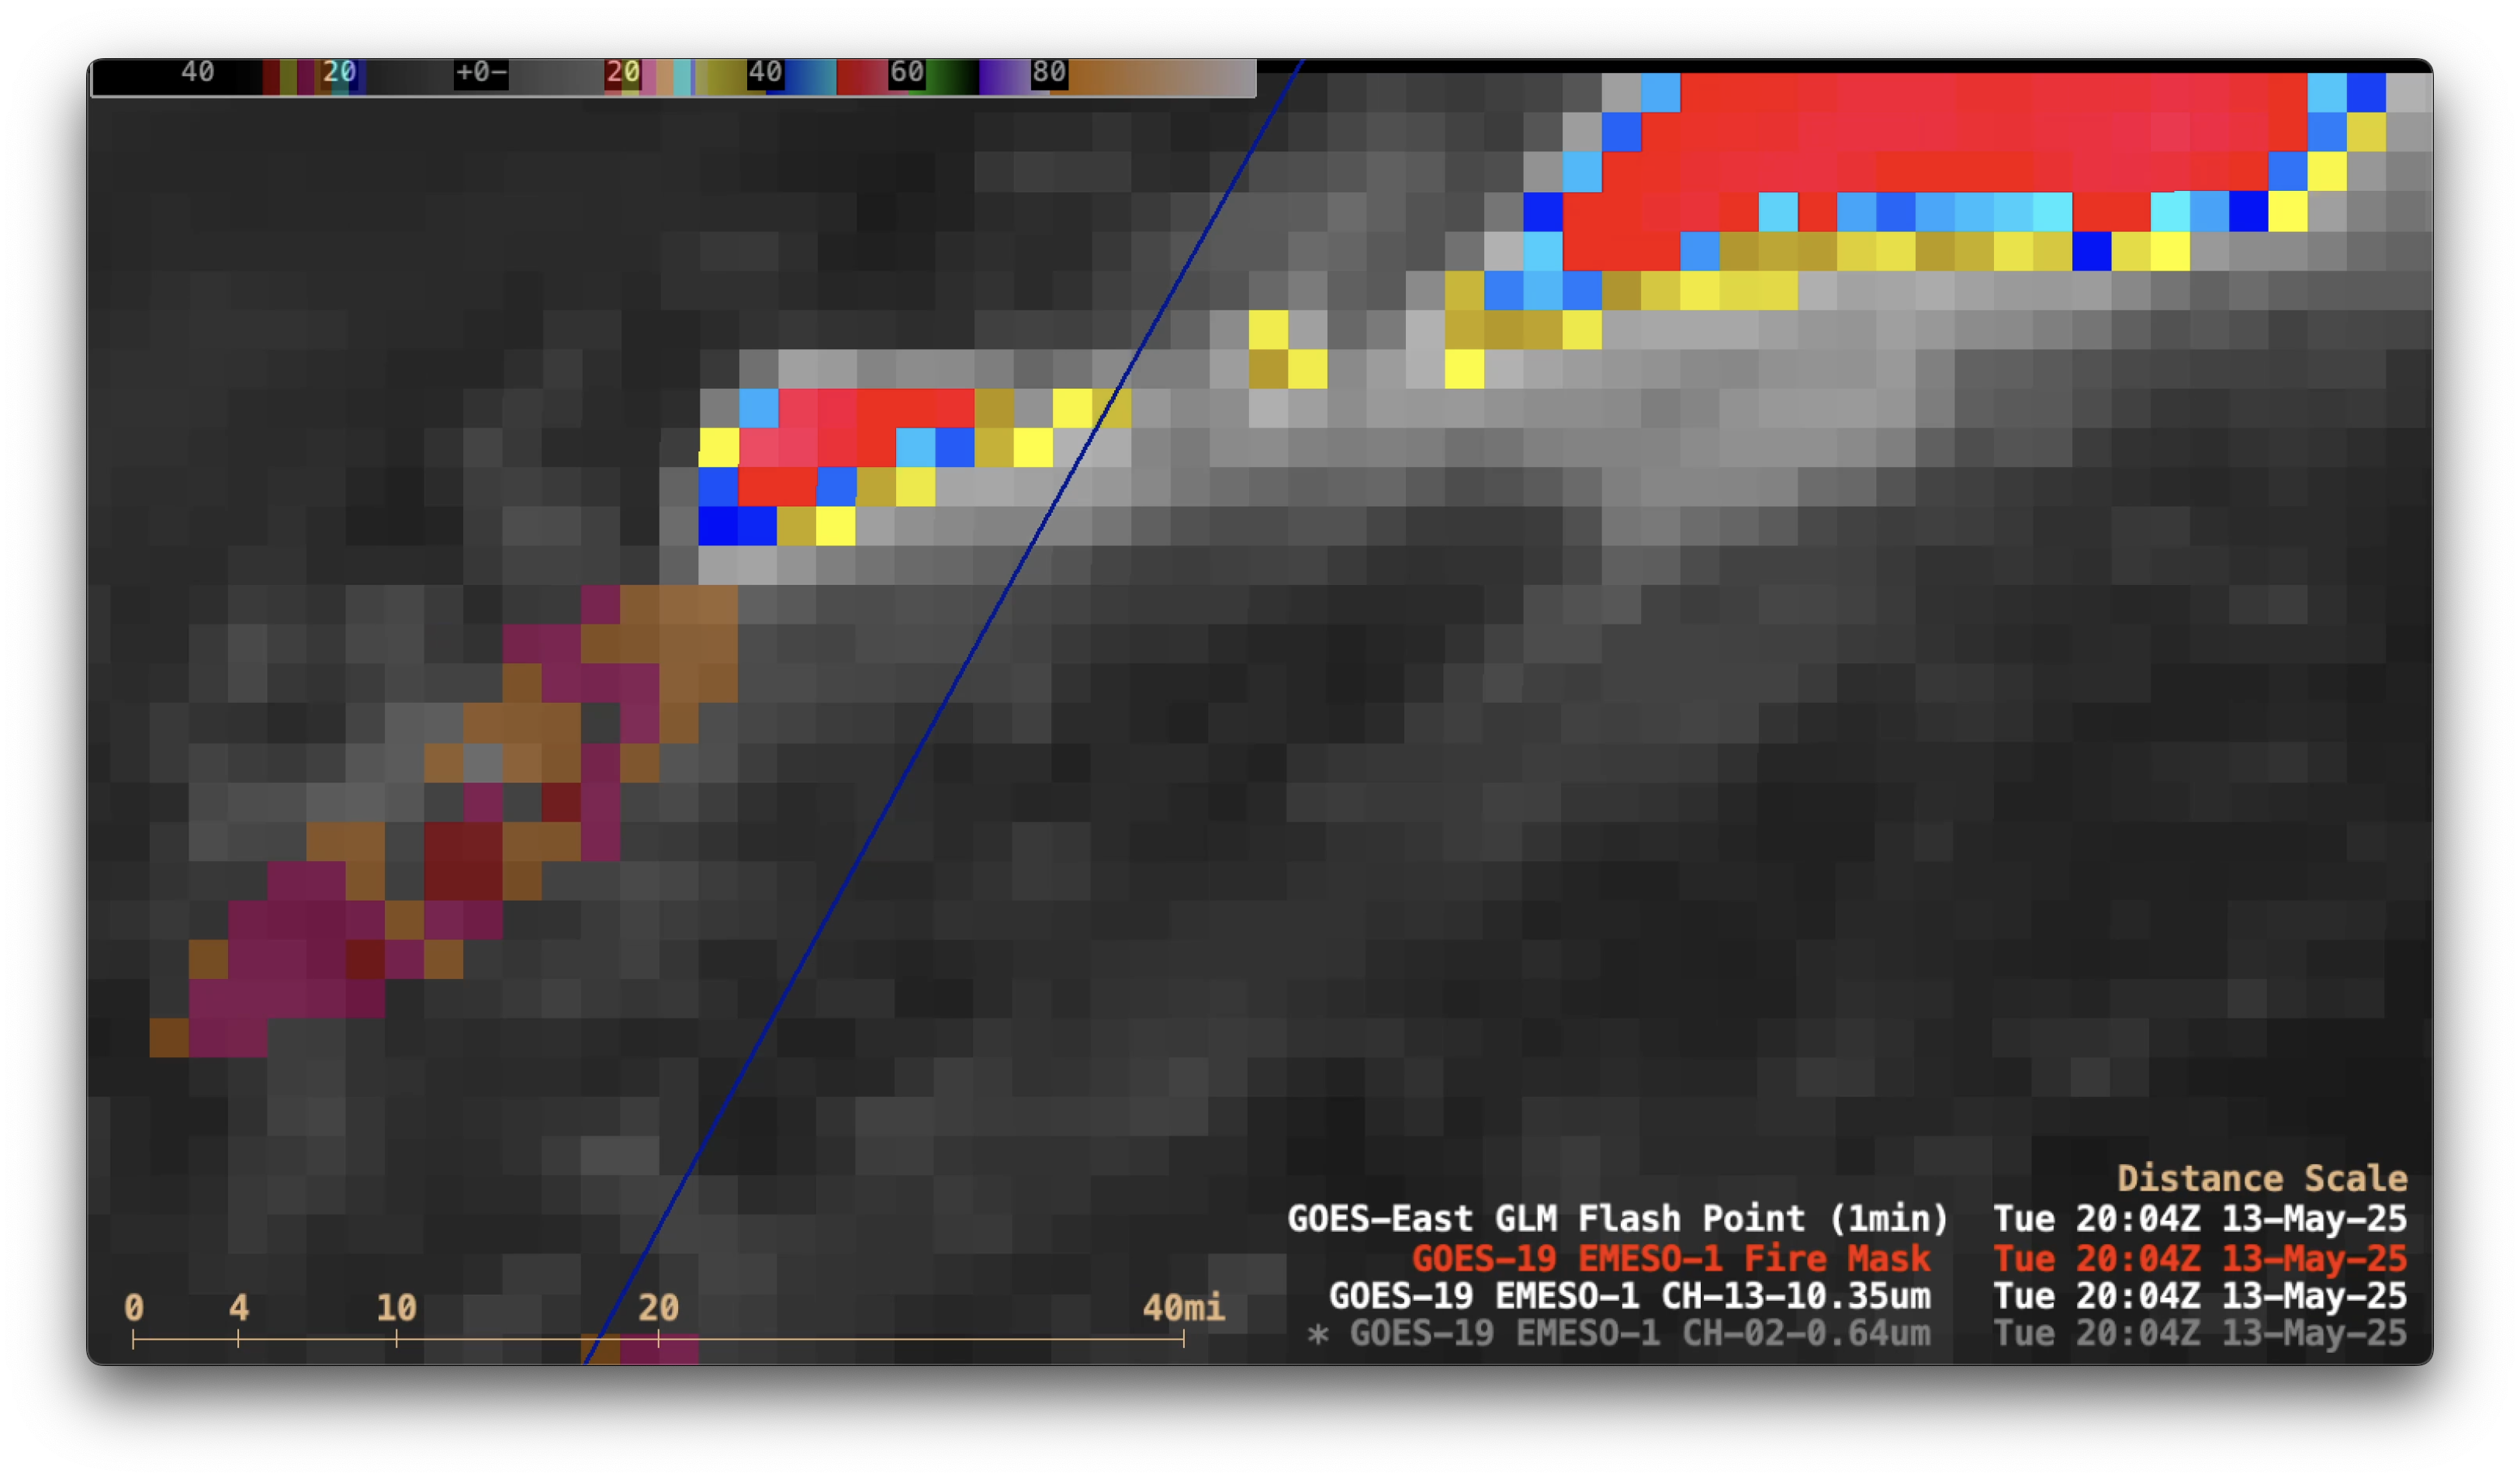
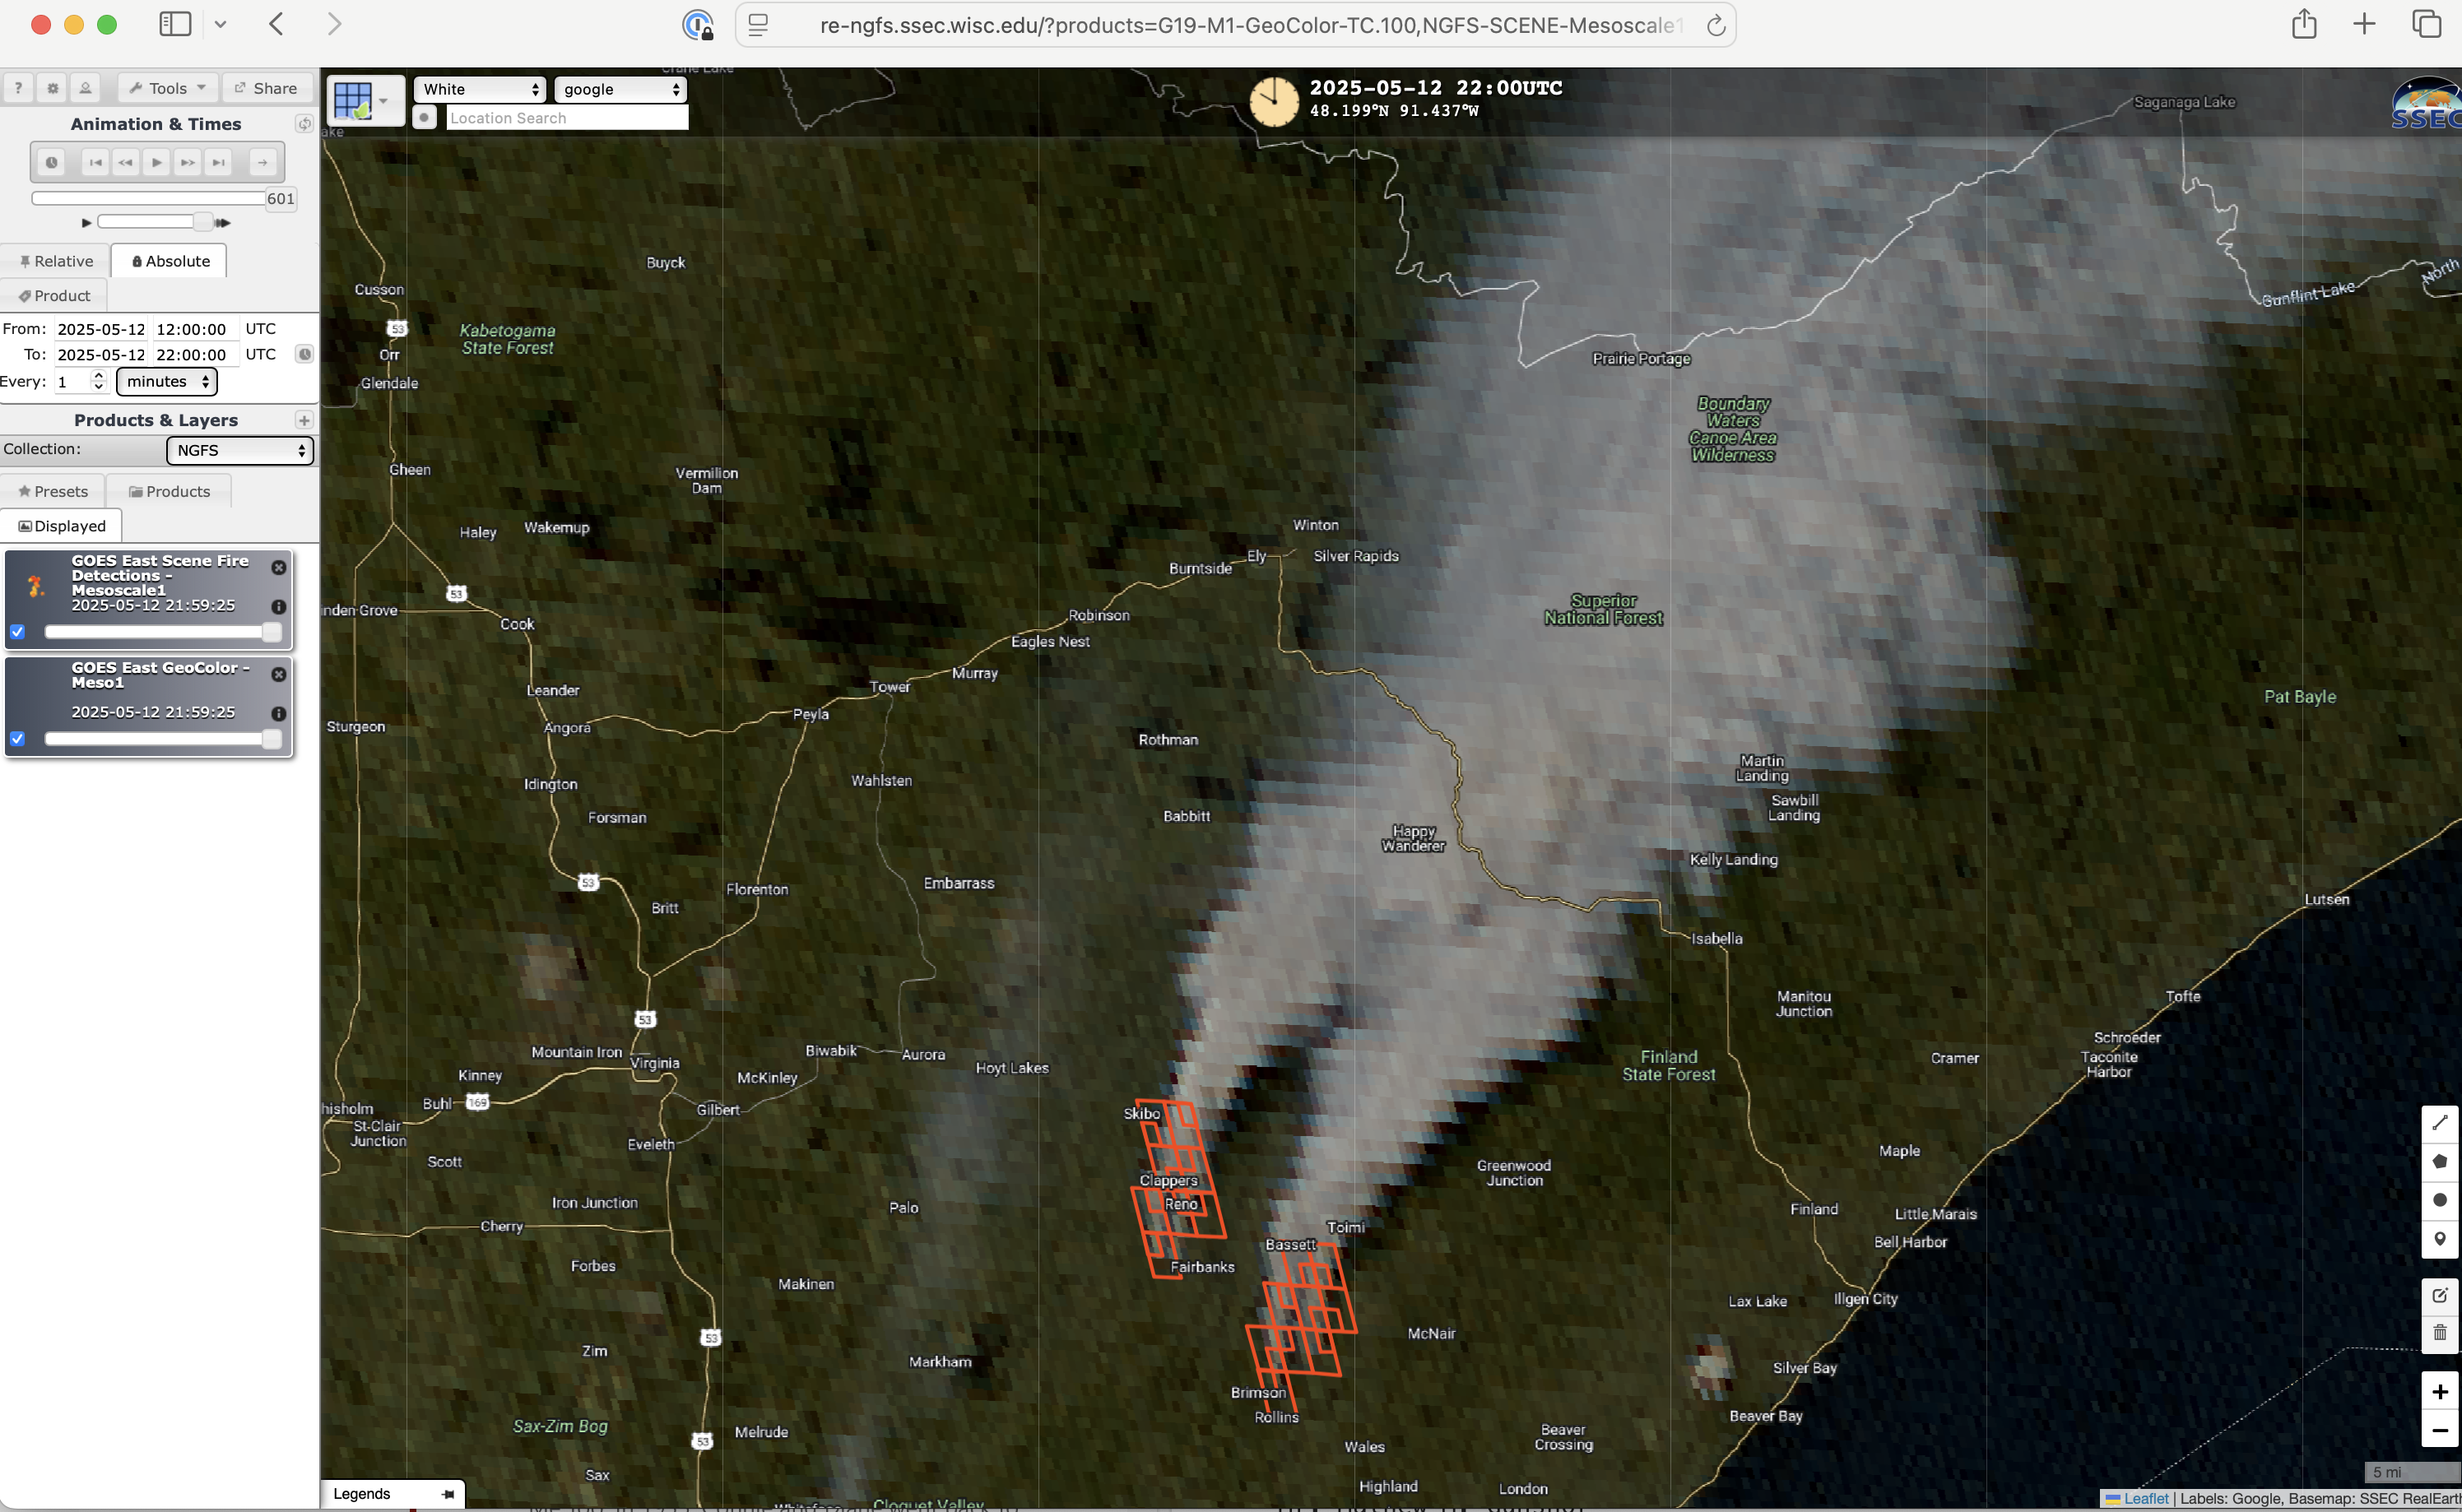
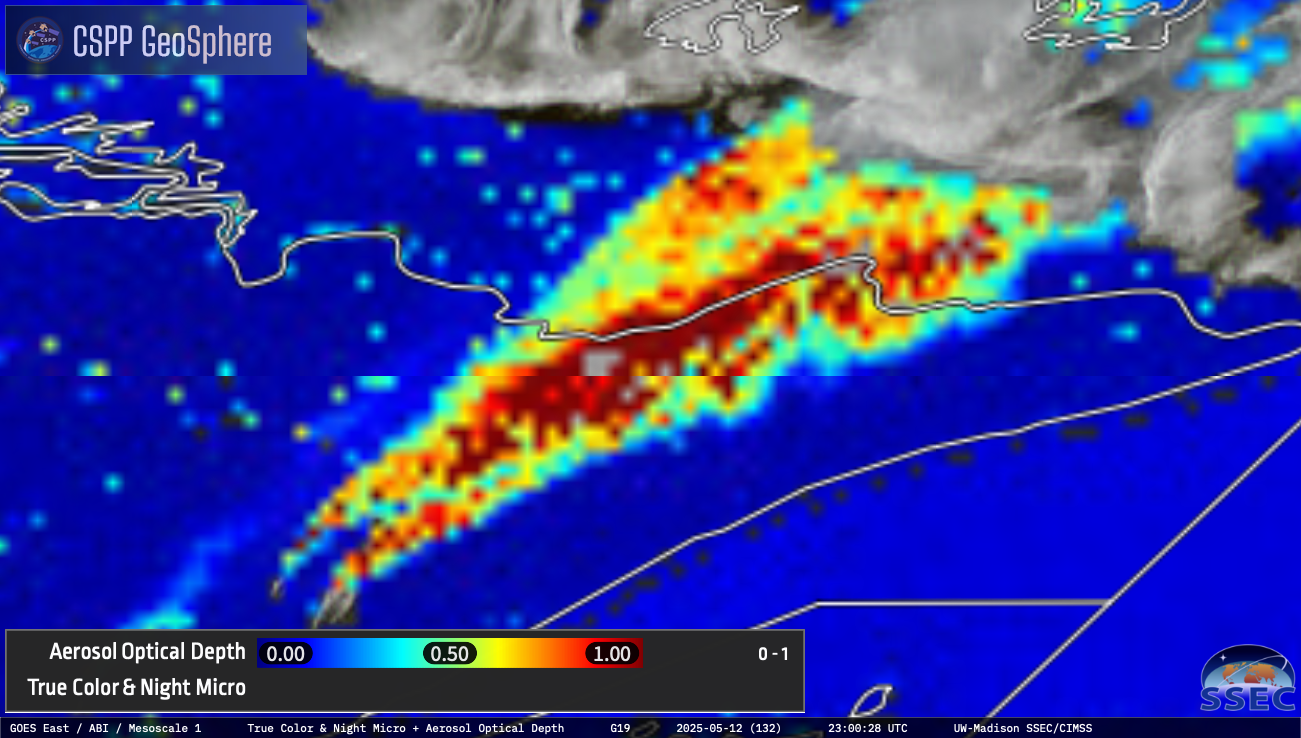
One satellite predictor of ProbSevere v3 is the “intense convection probability” from IntenseStormNet, which is computed via a trained AI model and GOES imagery. In the animation below, we can see that high values of “intensity” (> 90%) follow the storm cores from south-central to east-central Wisconsin, highlighting strong overshooting tops, high storm-top texture, and high GLM flash rates (not shown). This product is particularly valuable where radar data is sparse, but it still skillfully contributes to the ProbSevere models even in good radar coverage, by providing an assessment of storm intensity from a geostationary satellite perspective.
View only this post Read Less


