A significant outbreak of tornadoes occurred across Oklahoma and Kansas during the afternoon and evening hours on 03 May 1999 — and hail as large as 4.50 inches in diameter was reported in parts of Texas and Oklahoma (Storm Reports). NWS damage surveys indicated that widespread F4 and F5 tornado damage occurred. NOAA GOES-8... Read More
GOES-8 Visible images, from 2045 UTC on 03 May to 0015 UTC on 04 May 1999
A significant outbreak of tornadoes occurred across Oklahoma and Kansas during the afternoon and evening hours on 03 May 1999 — and hail as large as 4.50 inches in diameter was reported in parts of Texas and Oklahoma (Storm Reports). NWS damage surveys indicated that widespread F4 and F5 tornado damage occurred. NOAA GOES-8 Visible images (above) and Infrared images (below) centered on Oklahoma City (KOKC) showed the explosive development of convection across southwestern Oklahoma after 2045 UTC. Several overshooting tops were evident in the visible imagery, and Enhanced-V cloud-top signatures were seen in the Infrared imagery.
GOES-8 Infrared images, from 2045 UTC on 03 May to 0445 UTC on 04 May 1999
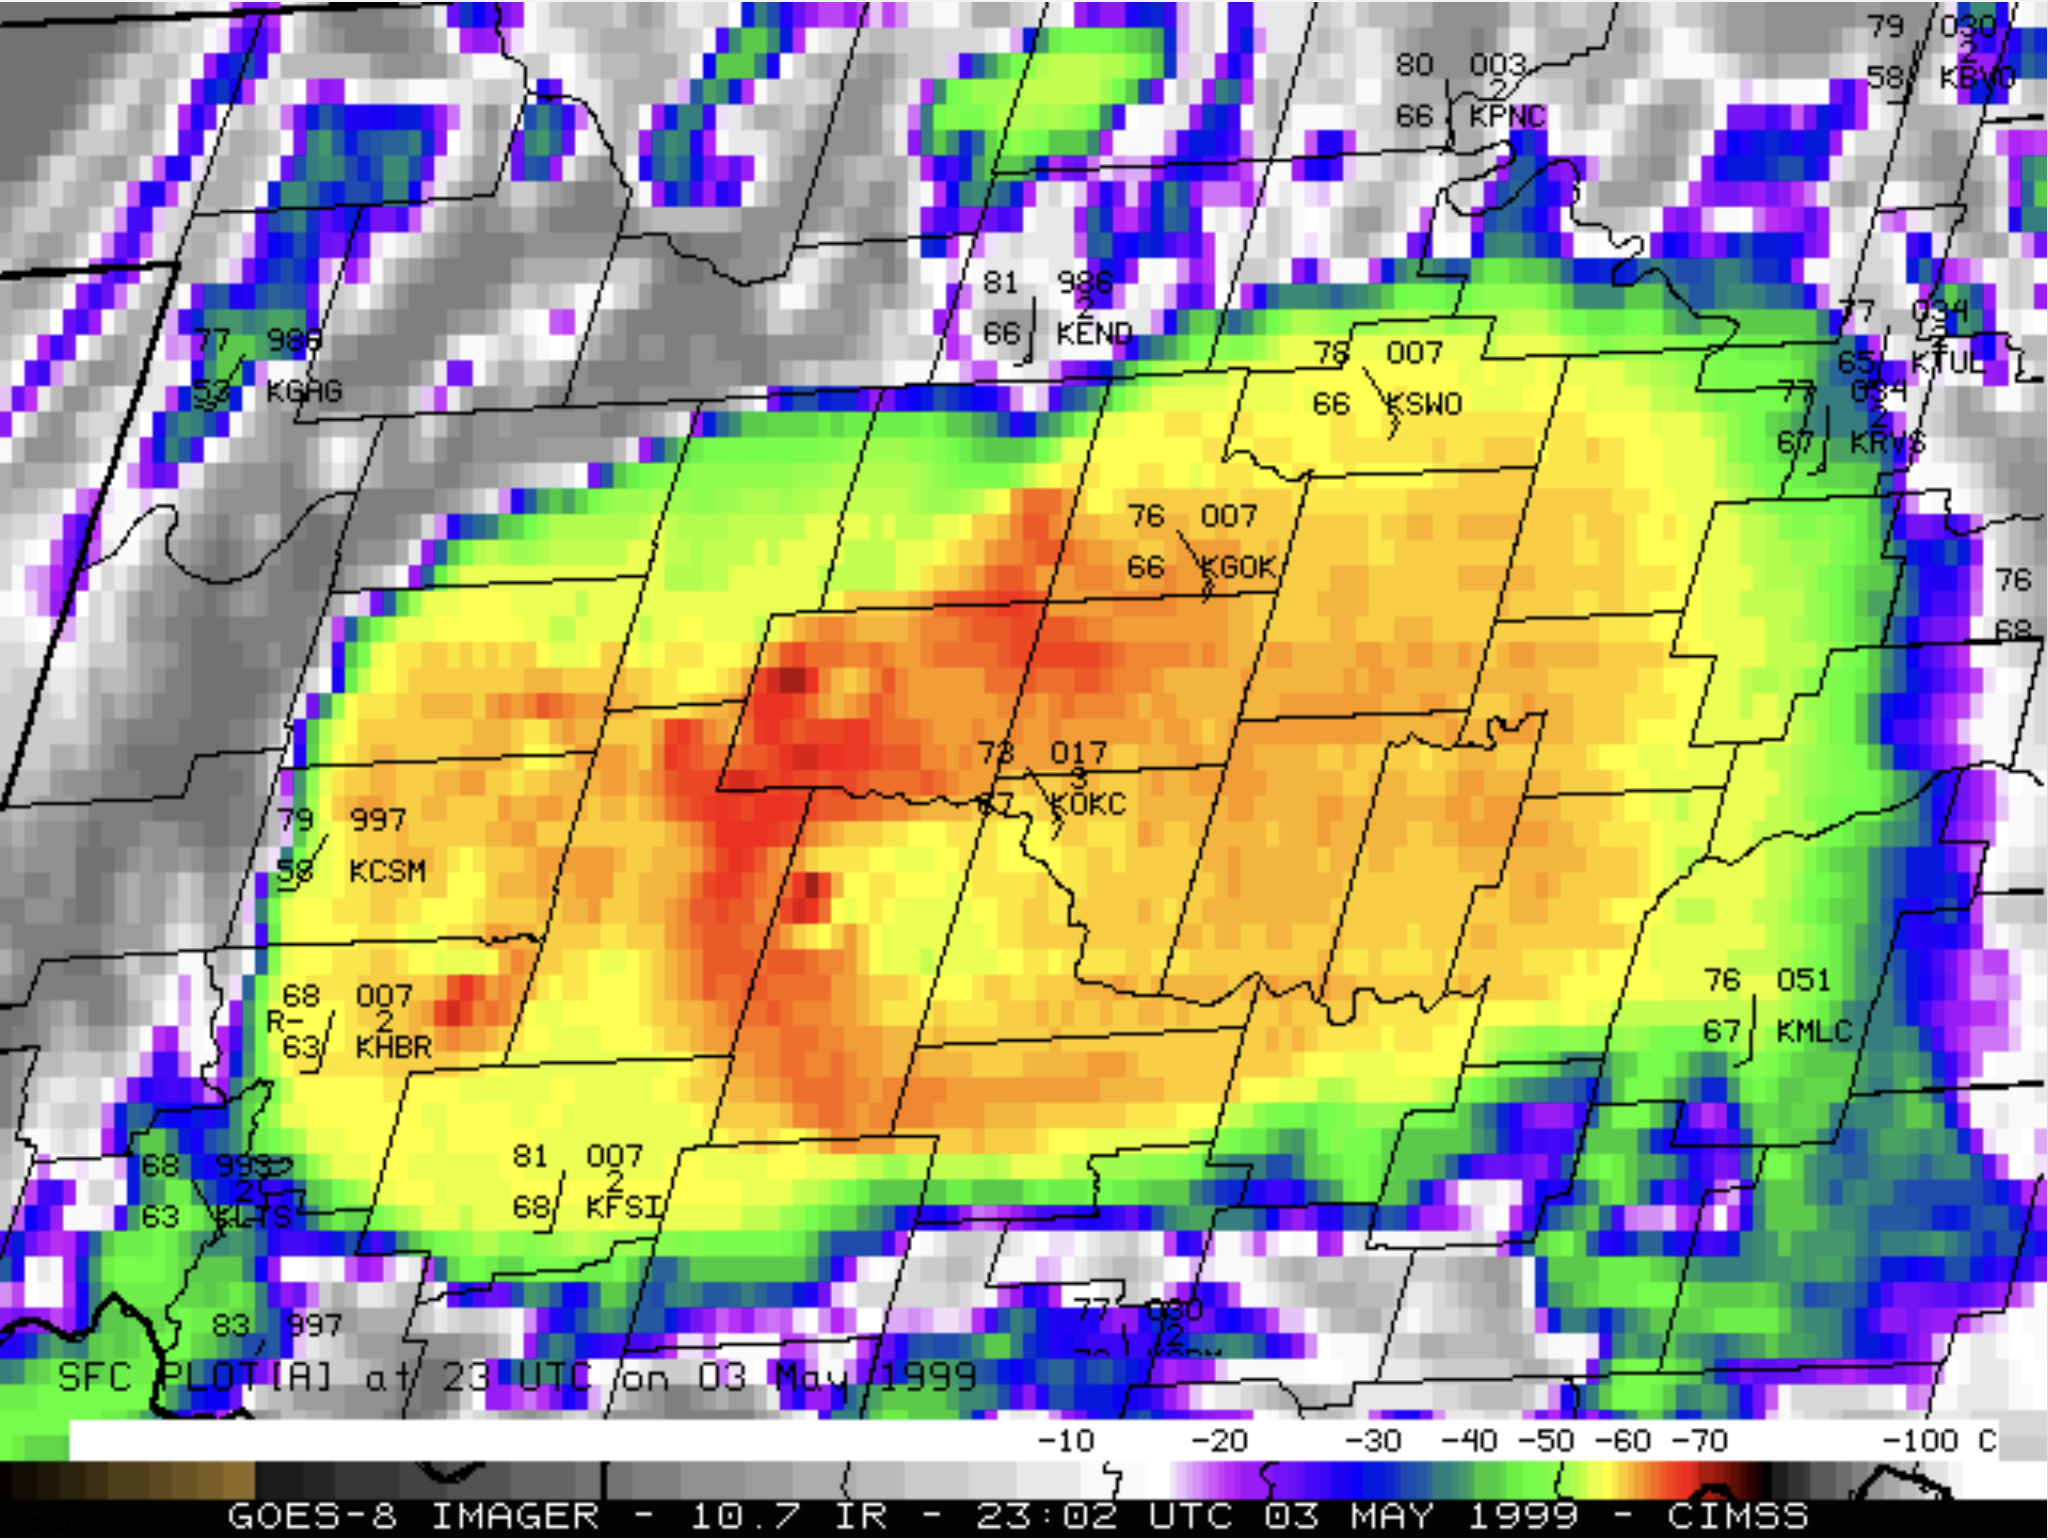
A toggle between GOES-8 Visible and Infrared images at 2302 UTC (below) displayed distinct overshooting top and Enhanced-V signatures associated with the supercell thunderstorm that was southwest of Oklahoma City — about 50 minutes prior to the first tornado reports in the Newcastle area (10 miles south of KOKC).
GOES-8 Visible and Infrared images at 2302 UTC on 03 May 1999
GOES-8 Water Vapor images (below) showed the approach of an upper-level shortwave trough during the afternoon hours.
GOES-8 Water Vapor images, from 1745-2345 UTC on 03 May 1999
Strong upper-level divergence indicated that forcing for synoptic-scale lift was likely being enhanced as a jet streak moved over Oklahoma (below).
GOES-8 Water Vapor image at 2345 UTC on 03 May with an overlay of Eta model 250 hPa wind streamlines (yellow) and contours of 250 hPa divergence (red) valid at 0000 UTC on 04 May

GOES-8 Water Vapor image at 2345 UTC on 03 May with an overlay of Eta model 250 hPa wind streamlines (yellow) and contours of 250 hPa wind speed (meters per second, red) valid at 0000 UTC on 04 May
GOES-8 Sounder lifted index (LI) and total precipitable water (PW) derived products are shown below. During the morning hours preceding convective development, a trend of rapid destabilization was evident from central Texas into Oklahoma (LI’s decreased to -8 C and lower, red enhancement); in addition, the moisture gradient appeared to increase slightly along the dryline that was located across western Oklahoma.
GOES-8 Sounder Lifted Index (LI) derived product, from 1146-1446 UTC on 03 May 1999

GOES-8 Sounder Total Precipitable Water (PW) derived product, from 1146-1446 UTC on 03 May 1999
AERI retrieval data was combined with GOES-8 Sounder data to produce Skew-t/log-p thermodynamic diagrams for the atmosphere over Purcell (in south-central Oklahoma) at 1934 UTC and 2043 UTC UTC (below), during the hour preceding convective development. Note how the low-level “capping inversion” near 850 hPa was eroded, allowing organized surface-based updrafts to ascend above the level of free convection. In that 1-hour period, the CAPE increased from 4111 to 4681 J/kg, and the lifted index (LI) decreased from -7.48 to -8.22 C; convective inhibition (CIN) decreased from -259 to -69 J/kg.
AERI + GOES-8 Sounder data Skew-T plots of temperature and dewpoint at Purcell, Oklahoma at 1934 UTC and 2043 UTC on 03 May 1999
A time series of convective indices for the 4 Oklahoma AERI + GOES Sounder sites (below) showed the trend of rapid destabilization during the afternoon hours leading up to the development of supercell convection.
Time series of CAPE, CIN and LI for the 4 AERI + GOES Sounder sites in Oklahoma on 03 May 1999
View only this post
Read Less


