Iceland enjoyed a remarkable string of clement weather in mid-May. The true-color animation below, taken from the NASA Worldview site, shows almost a fortnight of clear skies!
VIIRS gives a high-resolution view of the surface and cloud features as shown above. JPSS satellites carry sounder instruments used to create NUCAPS data; NUCAPS profiles allow a meteorologist to view what’s going on within the troposphere. Both VIIRS and NUCAPS fields can be viewed using CSPP‘s polar2grid software using data downloaded from the cloud (here, for example, from Amazon Web Services). For the purposes of this blog post, I downloaded M03/M04/M05 SDR files (0.488 µm/0.555 µm/0.672 µm, i.e., blue, green, and red) and also I01 (0.64 µm) so the image could be sharpened, and the GITCO/GMTCO VIIRS files that contain georeferencing for I- and M-bands, respectively. (VIIRS Bands are defined here.) The data were downloaded for a daytime NOAA-20 overpass on 19 May 2025 that viewed Iceland between 1332 and 1336 UTC 19 May 2025. I also downloaded NUCAPS EDR files from the same AWS site. Then I ran the following commands in polar2grid (I’m using version 3.1) in a directory I created just under the bin directory in the polar2grid code distribution:
../p2g_grid_helper.sh Iceland -19.0 65.0 1500 -1500 1080 840 > Iceland.yaml
../polar2grid.sh -r nucaps -w geotiff -p Temperature_853mb -g Iceland --grid-configs ./Iceland.yaml -f /path/to/storedfiles/Iceland/NUCAP*
../polar2grid.sh -r viirs_sdr -w geotiff -p true_color_raw -g Iceland --grid-configs ./Iceland.yaml -f /path/to/storedfiles/Iceland/SV*
../add_colormap.sh ../../colormaps/p2g_sst_palette.txt j01_atms-cris_Temperature_853mb_20250519_133218_Iceland.tif
../add_coastlines.sh --add-coastlines --add-colorbar --colorbar-text-size 18 --colorbar-height 40 j01_atms-cris_Temperature_853mb_20250519_133218_Iceland.tif
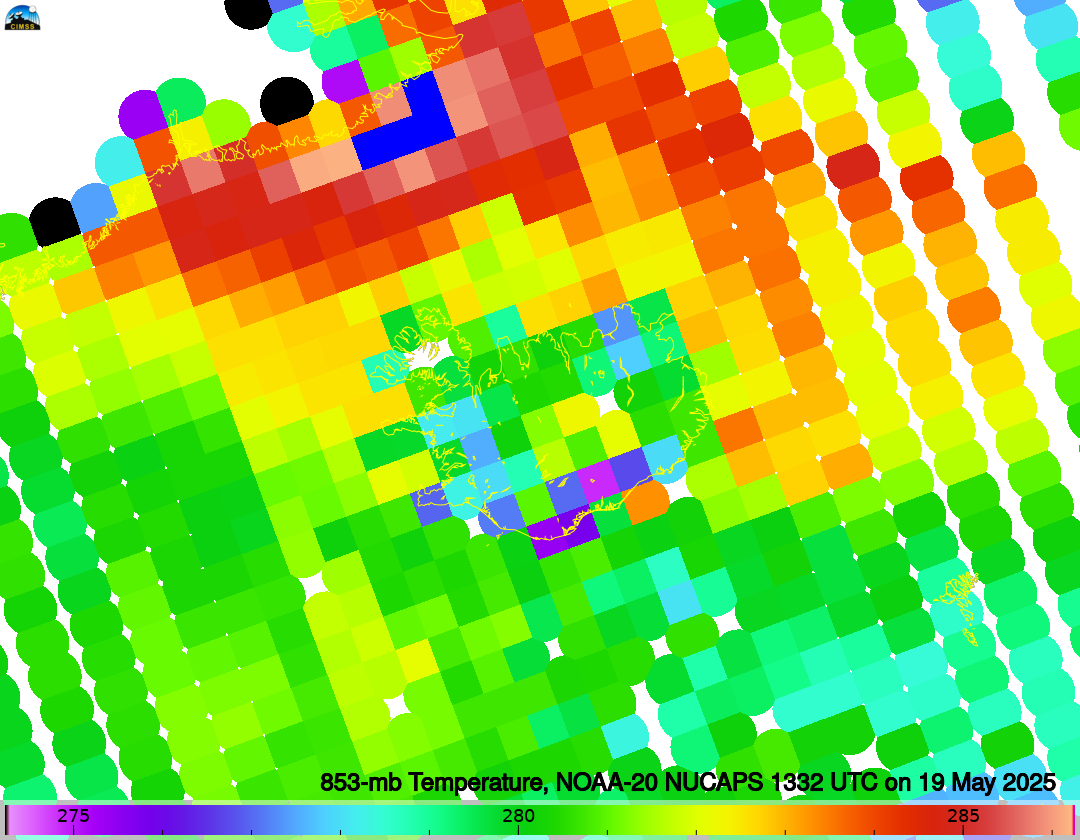
../add_coastlines.sh --add-coastlines noaa20_viirs_true_color_raw_20250519_133136_Iceland.tifThe first command creates a grid (‘Iceland’) and stored grid parameters in a file (‘Iceland.yaml’). Next, polar2grid calls using first the nucaps reader and then the viirs_sdr reader, to create imagery of 853 mb Temperature, and of ‘raw’ True-color imagery on that pre-defined ‘Iceland’ grid. I added a predefined colormap (‘add_colormap.sh’) to the 853-mb data, and then a final command to draw coastlines and add a colorbar (for the temperature field). The annotation was added with ImageMagick commands. The toggle below shows the true-color imagery and the 853-mb temperatures.

The warmest temperatures at 853 mb are just offshore of Greenland. That suggests to this blogger that there is wind downsloping off the Greenland ice sheet and warming dry adiabatically. That plume of warm air then moved out over the N. Atlantic to the north of Iceland. The coolest 853-mb temperatures might be linked to the glaciers of Iceland. The swirl patterns in the ocean ice off the coast of Greenland are also interesting to view.
View only this post Read Less


