GOES-T launch, as viewed by GOES-16 and GOES-17

30-second images from the 16 ABI spectral bands of GOES-16 [click to play animated GIF | MP4]
GOES-T was launched from the Kennedy Space Center in Florida at 2138 UTC on 01 March 2022 — and distinct reflectance and/or thermal signatures of the Atlas V rocket launch were evident in 30-second images from all 16 ABI spectral bands of GOES-16 (GOES-East) (above).
One of the more interesting aspects was the long trail of superheated air + water vapor in the wake of the Atlas V booster engines, which could be seen drifting slowly northward in GOES-16 Shortwave Infrared (Band 07, 3.9 µm) and Upper-level Water Vapor (Band 09, 6.2 µm) images (below). The warmest 3.9 µm Shortwave Infrared brightness temperature sensed by GOES-16 was 38.78ºC at 2139 UTC.
30-second GOES-16 Shortwave Infrared (3.9 µm) and Upper-level Water Vapor (6.2 µm) images [click to play animated GIF | MP4]
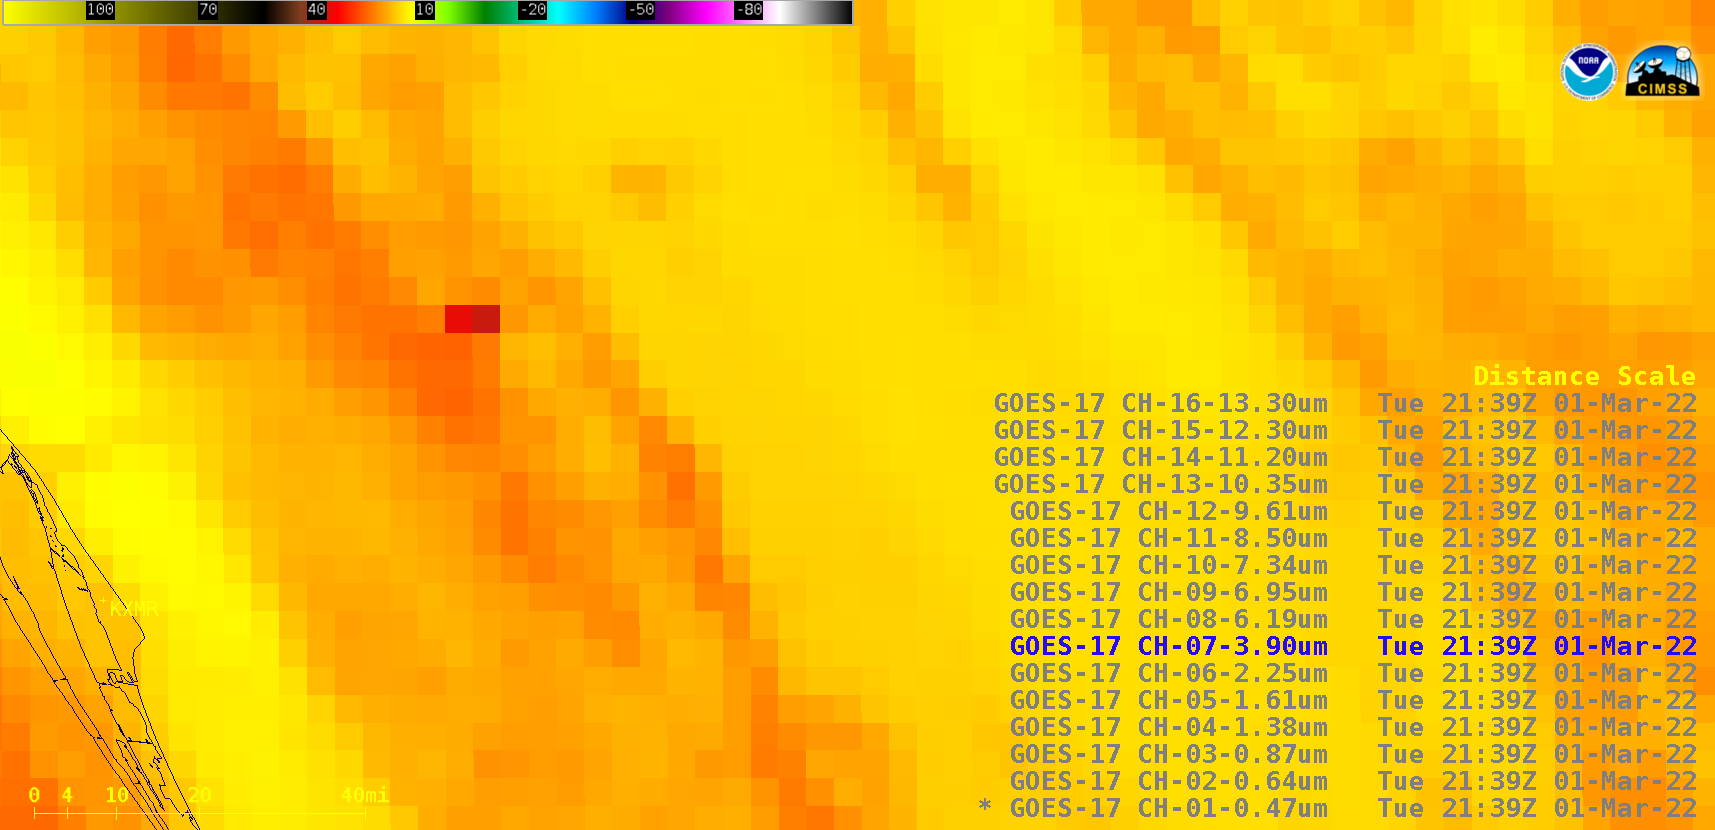
30-second scan were also available from GOES-17 (GOES-West) — reflectance and/or thermal signatures were also evident in imagery from all 16 of those ABI spectral bands (below). The warmest 3.9 µm Shortwave Infrared brightness temperature sensed by GOES-17 was 38.58ºC at 2139 UTC.

30-second images from the 16 ABI spectral bands of GOES-17 [click to play animated GIF | MP4]
A comparison of “Red” Visible (0.64 µm) images from GOES-17 and GOES-16 is shown below — and as in the 16-band examples above, the images are displayed in the native projection of each satellite (in other words, they are not re-mapped to a common map projection). Due to the much higher oblique viewing angle from GOES-17, parallax made the rocket condensation plume appear much longer (and extend farther to the east).
“Red” Visible (0.64 µm) images from GOES-17 (left) and GOES-16 (right) [click to play animated GIF | MP4]
However, a toggle between GOES-16 and GOES-17 Shortwave Infrared images at 21:38:55 UTC (below) — both displayed in a common map projection — revealed the large eastward displacement of the Atlas V rocket booster engine thermal signature with GOES-17 (the parallax shift magnitude was 35 km).
Shortwave Infrared images from GOES-16 and GOES-17 at 21:38:55 UTC (credit: Tim Schmit, NOAA/NESDIS/ASPB) [click to enlarge]
The Atlas V rocket’s rapid rate of ascent was apparent when looking at the first 1 minute (at 30-second intervals) of GOES-16 True Color RGB images visualized using CSPP GeoSphere (below).
GOES-16 True Color RGB images [click to enlarge]
GOES-16 Plume RGB imagery (below) is an effective product that aids in the identification of both the rocket condensation plume and the booster engine thermal signature.
GOES-16 Plume RGB images (credit: Tim Schmit, NOAA/NESDIS/ASPB) [click to play animated GIF]
GOES-16 True Color RGB images (credit Tim Schmit, NOAA/NESDIS/ASPB) [click to play animated GIF | MP4]
True Color RGB images from GOES-16 (above) and GOES-17 (below) highlighted the rocket condensation plume.
GOES-17 True Color RGB images (credit Tim Schmit, NOAA/NESDIS/ASPB) [click to play animated GIF | MP4]
Additional imagery and information on the GOES-T launch can be found on the Satellite Liaison Blog.