Advanced Dvorak Technique (ADT) plot for Hurricane Odile
A time series plot of the Advanced Dvorak Technique (ADT) intensity estimate for Hurricane Odile (above) showed that the tropical cyclone went through a period of rapid intensification on 14 September 2014, reaching Category 4 on the Saffir-Simpson hurricane scale as it moved northwestward toward the southern tip of Baja California (Odile track map).
McIDAS images of GOES-15 10.7 µm IR channel data covering the 13-15 September period (below; click image to play animated GIF; also available as an MP4 movie file) showed Odile from the period of rapid intensification on the 14th to landfall on the 15th. Odile made landfall near Cabo San Lucas around 04:45 UTC on 15 September, with an estimated intensity of 110 knots — this ties with Hurricane Olivia (1967) as the strongest hurricane to make landfall in Baja California Sur during the modern satellite era.
GOES-15 10.7 µm IR channel images (click to play animated GIF)
Several hours prior to landfall, a comparison of GOES-15 10.7 µm IR and DMSP SSMIS 85 GHz microwave images from the CIMSS Tropical Cyclones site (below) indicated that Odile had a large outer eyewall at that particular point in time.
GOES-14 10.7 µm IR channel image and DMSP SSMIS 85 GHz microwave image
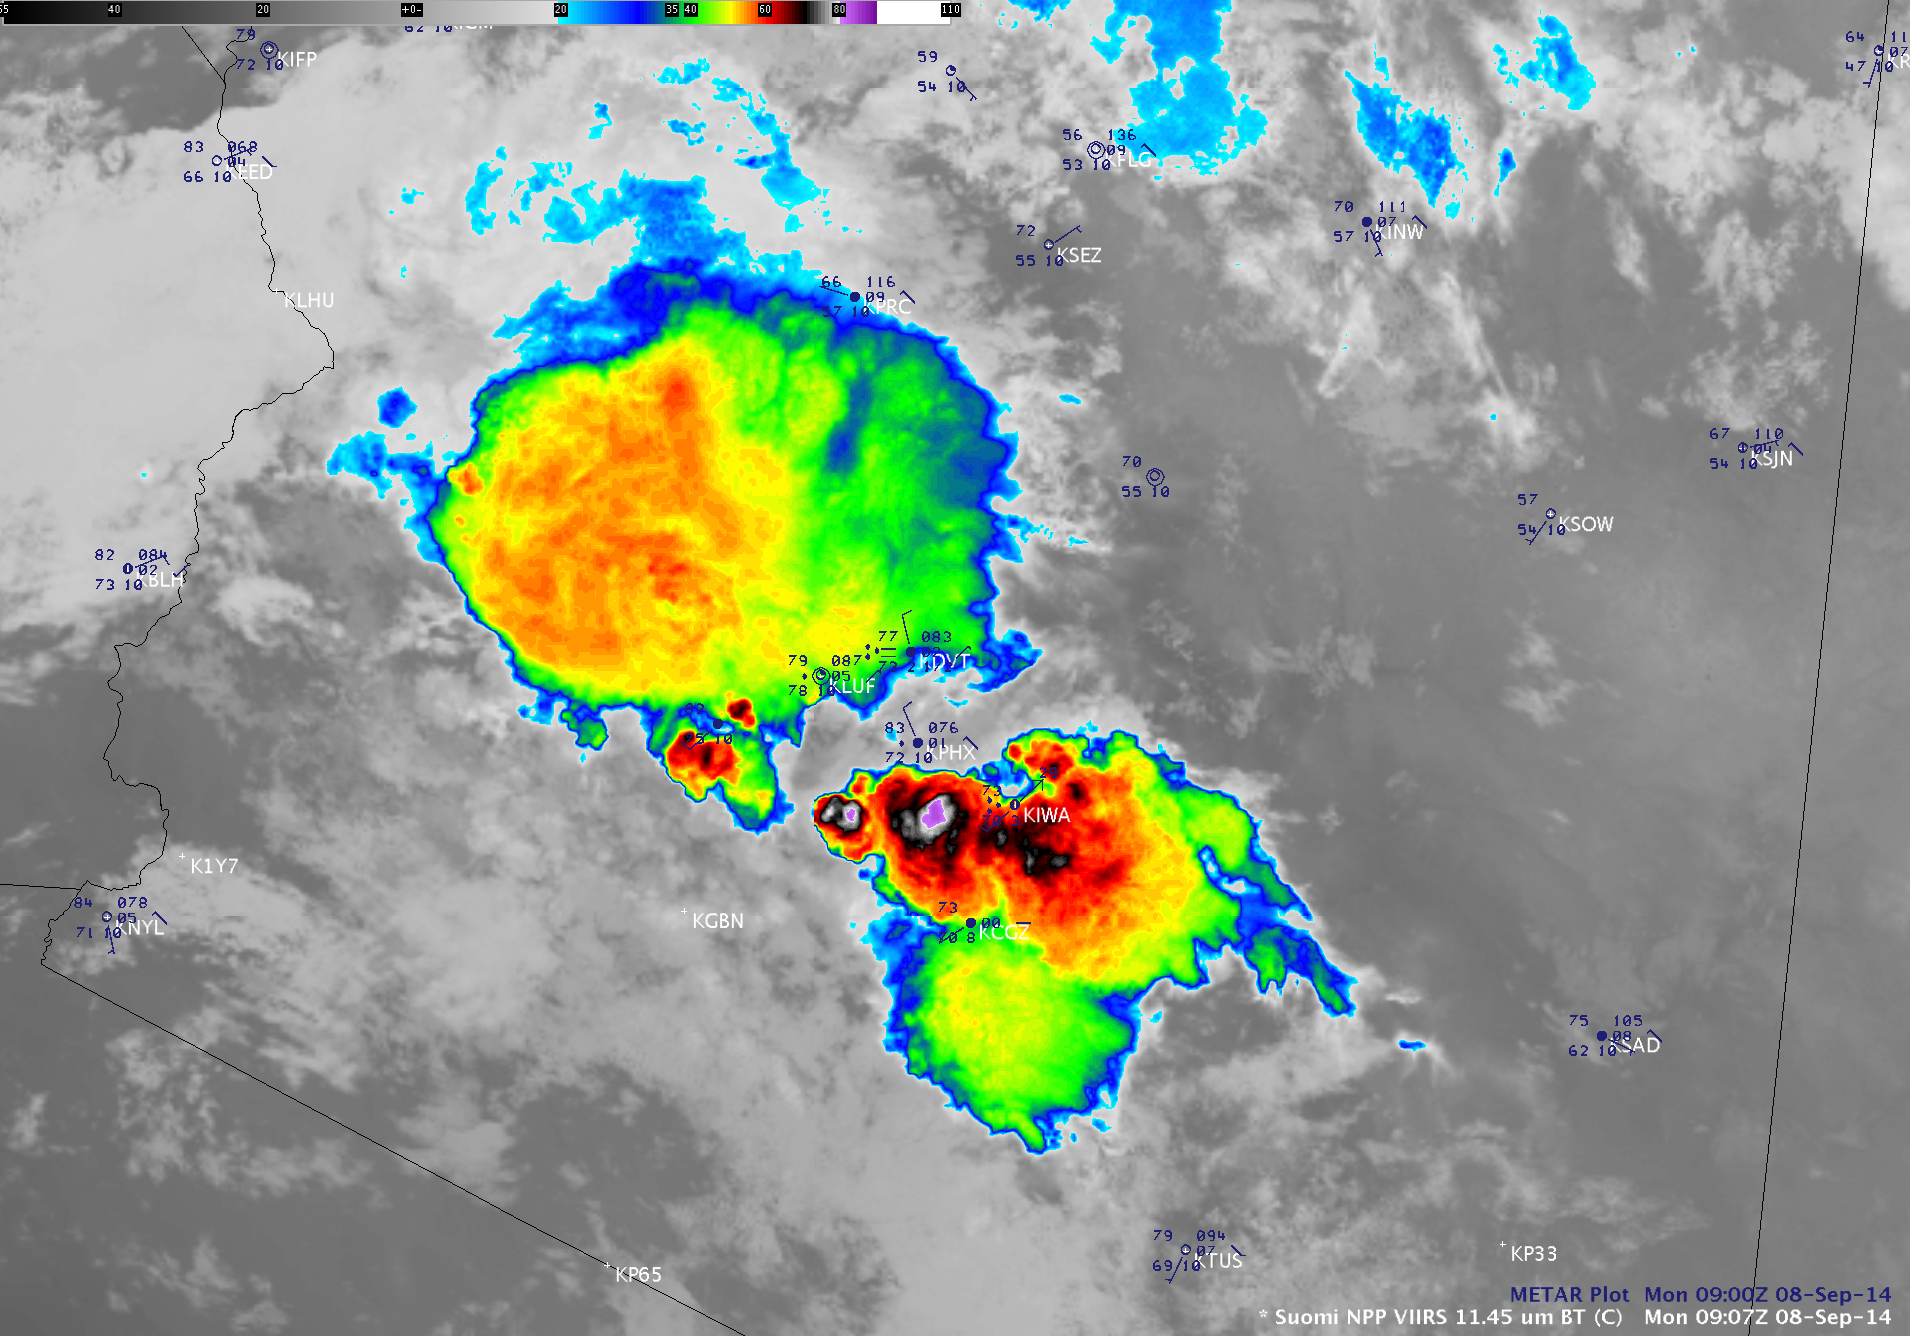
Even after several hours of traversing the rugged terrain of the Baja California peninsula, Odile continued to maintain hurricane intensity; the faint signature of an eye could still be seen on AWIPS II images of Suomi NPP VIIRS 0.64 µm visible channel and 11.45 µm IR channel data at 22:34 UTC on 15 September (below).
Suomi NPP VIIRS 0.64 µm visible channel and 11.45 µm IR channel images
View only this post Read Less

