
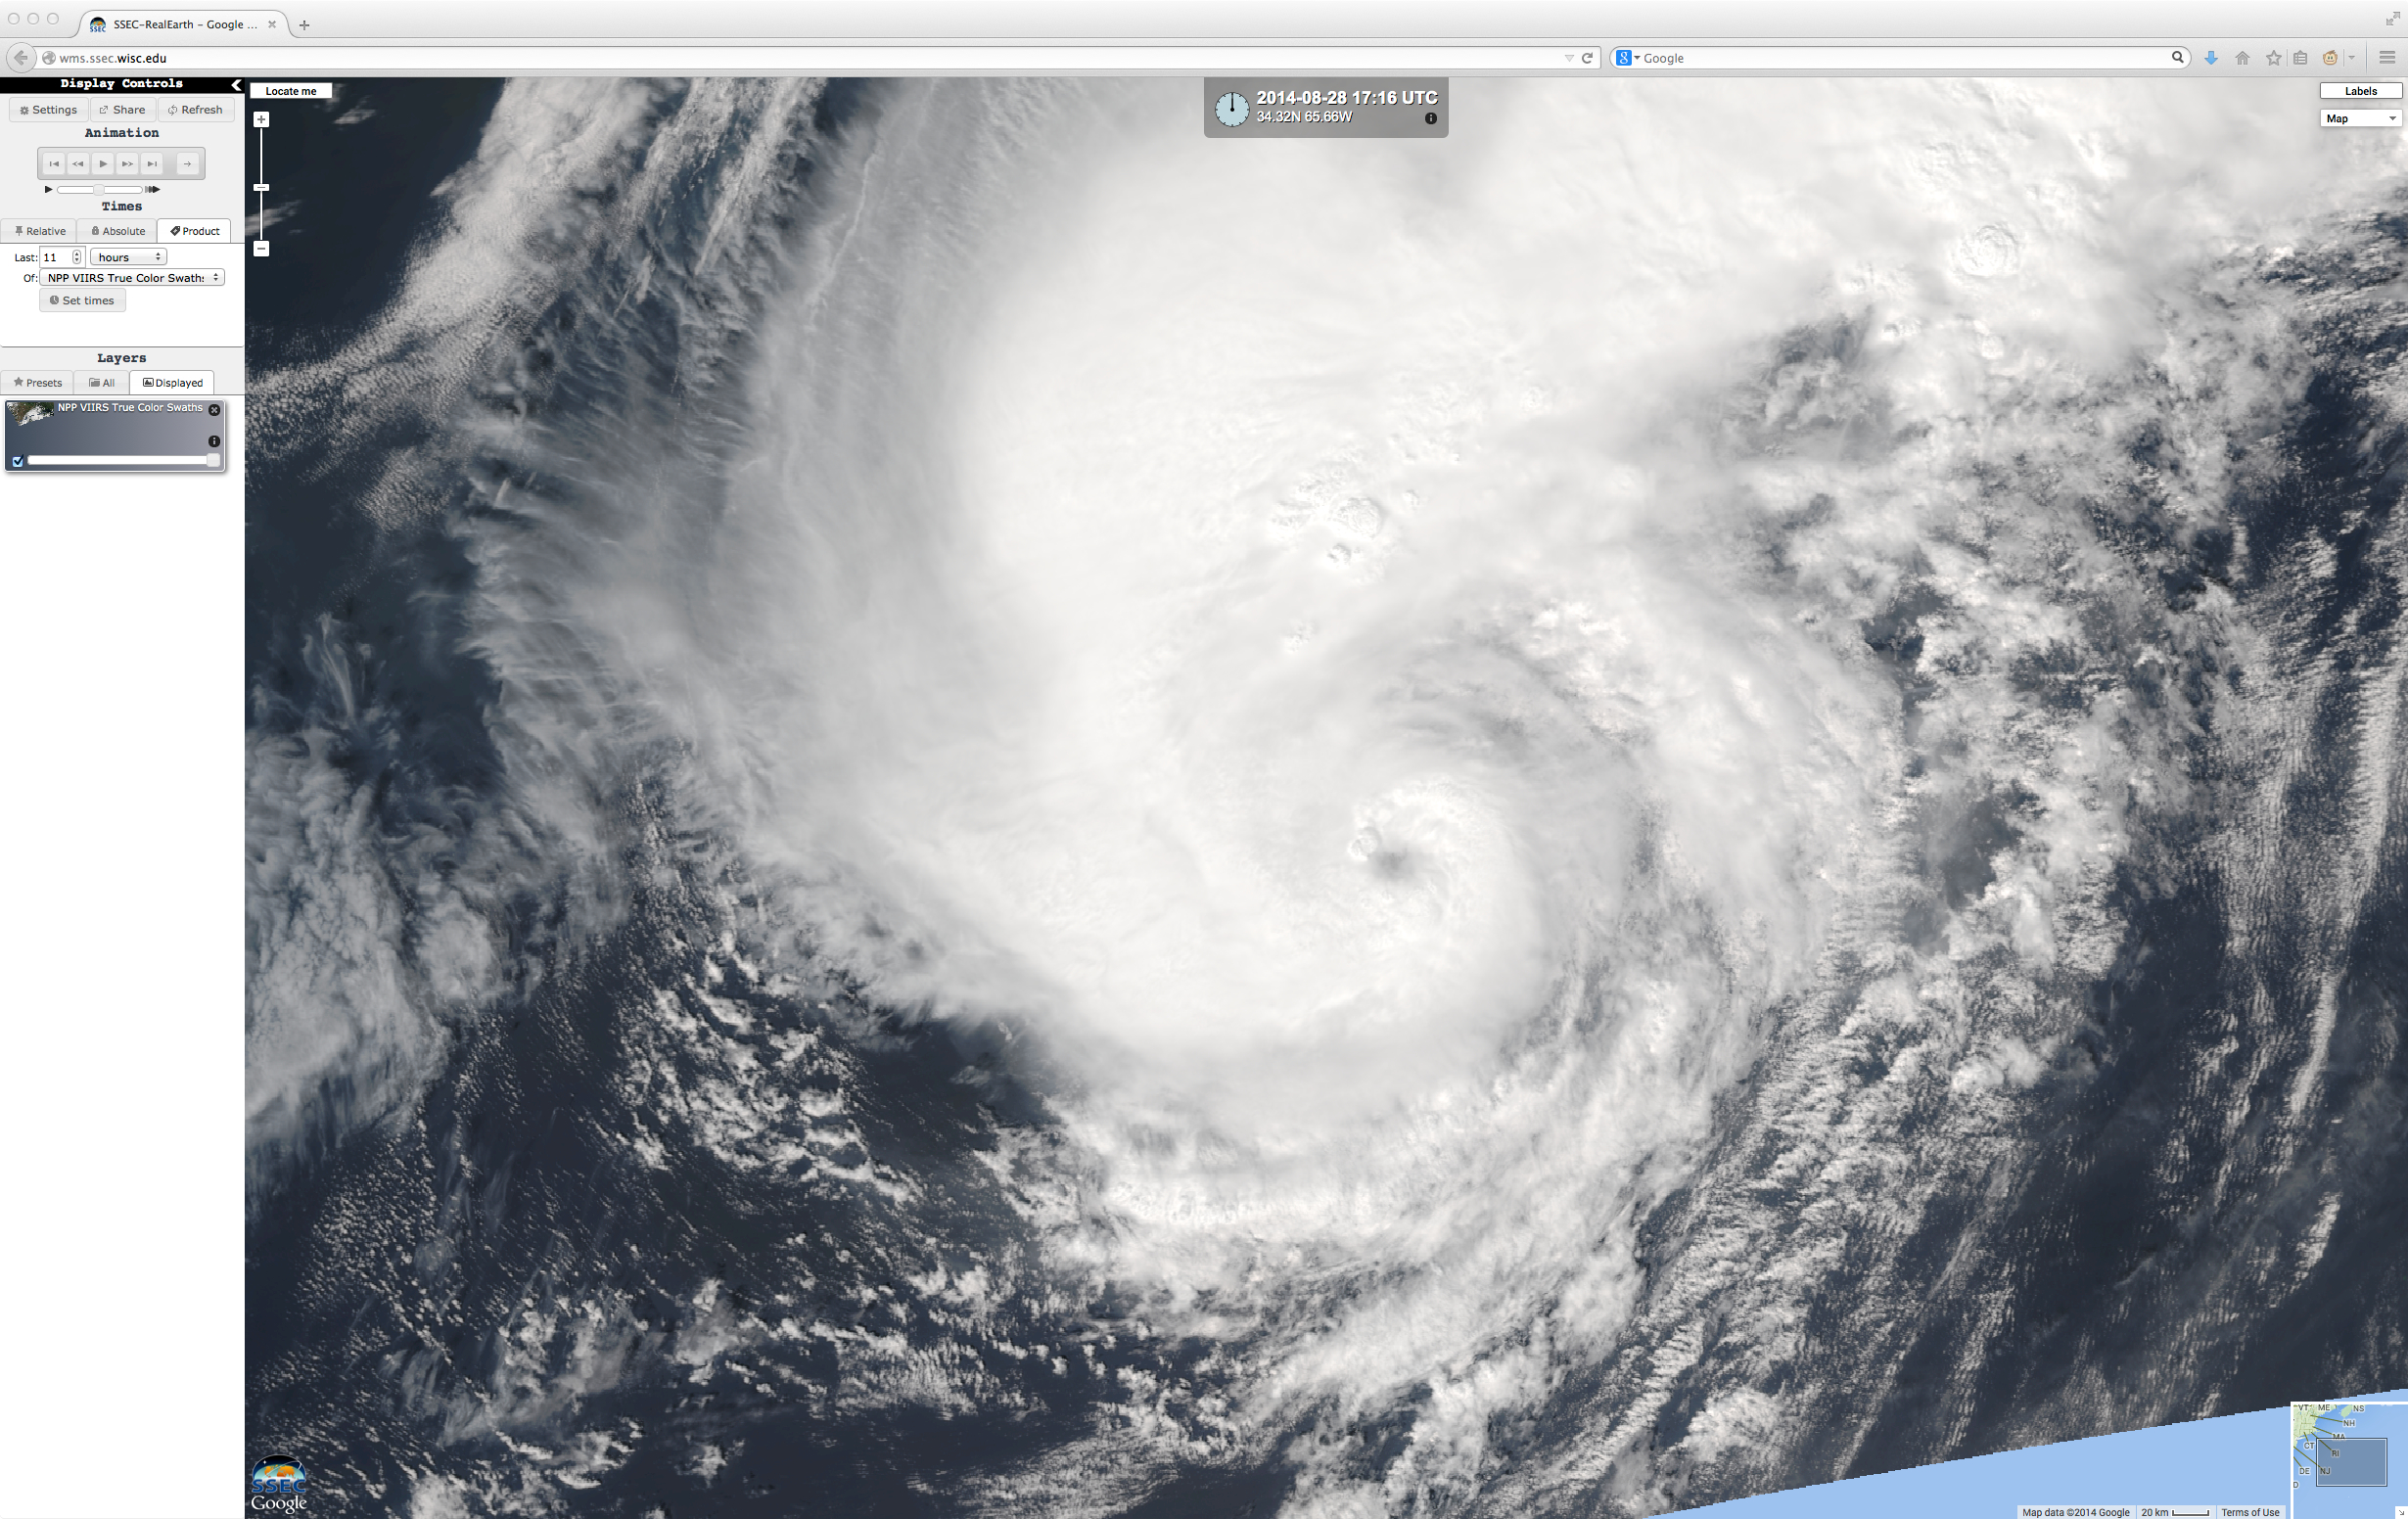
Suomi NPP VIIRS Day Night Band (0.70 µm) image (click to enlarge)
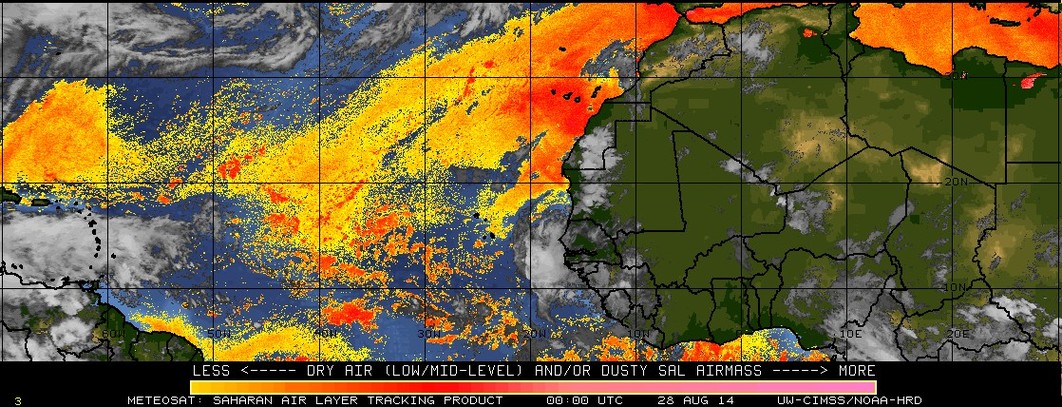
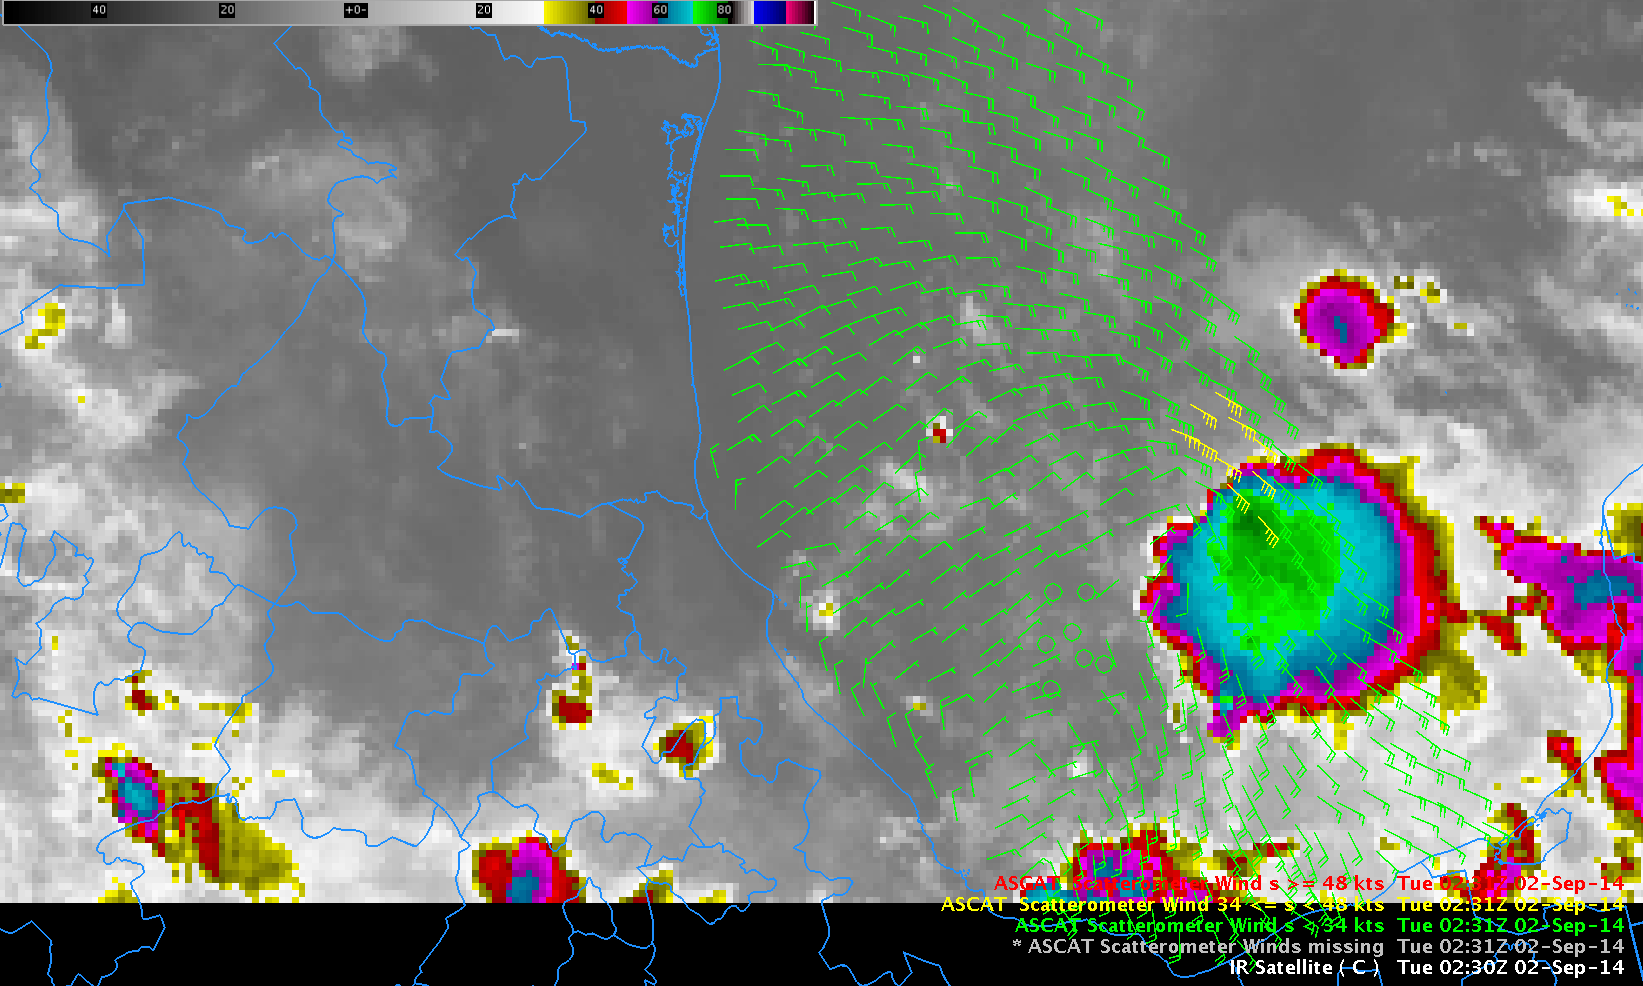
Tropical Storm Dolly has formed in the western Gulf of Mexico. The Suomi NPP VIIRS Day Night Band imagery, above, shows the exposed low-level swirl of the storm (then still a tropical depression). North-northwesterly shear (shown here, from this site) means the deep convection (shown below) is displaced to the east of south of the the low-level circulation (click here for a toggle between the Day Night Band and the 11.45µm imagery). Cloud-top IR brightness temperatures from VIIRS were as cold as -87º C. ASCAT winds from 0230 UTC show a region of tropical storm-force winds associated with convection east and north of the circulation center.
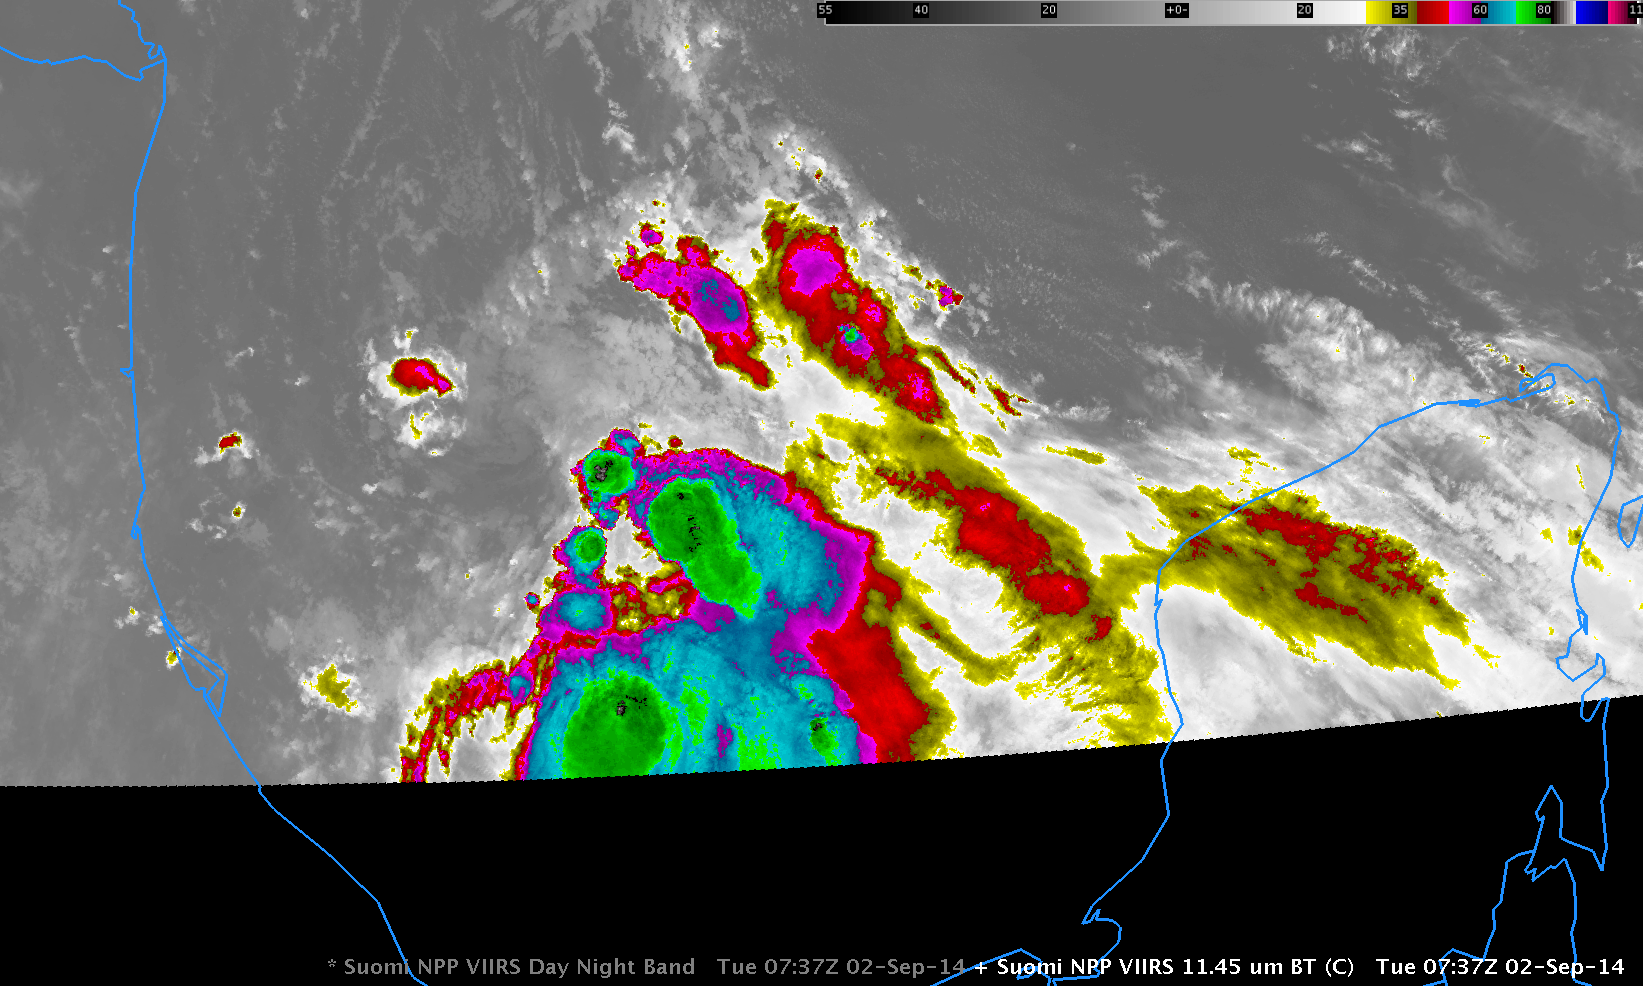
Suomi NPP VIIRS Infrared (11.45 µm) image (click to enlarge)
Early-morning visible imagery from GOES-13, below, shows the large area of convection over the southern Gulf. The NHC-reported positions of the storm at 0900 UTC and 1500 UTC (22.6º N, 94.8º W and 23.4º N, 96.5º, respectively) are indicated by the red boxes on the images. Strong convection just south of the surface circulation developed at sunrise, obscuring the low-level swirl. That strong convection is especially apparent in the GOES-13 10.7 imagery, at bottom. GOES IR Brightness Temperatures were as cold as -84º C in the animation. (For more on Dolly from the National Hurricane Center, see this link).
GOES-13 Visible Imagery (0.63 µm) (click to animate)
GOES-13 Infrared Imagery (10.7 µm) (click to animate)
View only this post Read Less


