Suomi NPP VIIRS true-color images
The King Fire began burning in central California (between Sacramento and Lake Tahoe) during the evening hours on 13 September 2014. A sequence of daily (12-19 September) Suomi NPP VIIRS true-color Red/Green/Blue (RGB) images from the SSEC RealEarth web map server site (above) showed that as the prevailing southwesterly wind pattern switched to easterly on 19 September, there was a major change in the transport of smoke from the King Fire. The final image in the series zooms out to show how much of central California had become over-run with thick smoke.
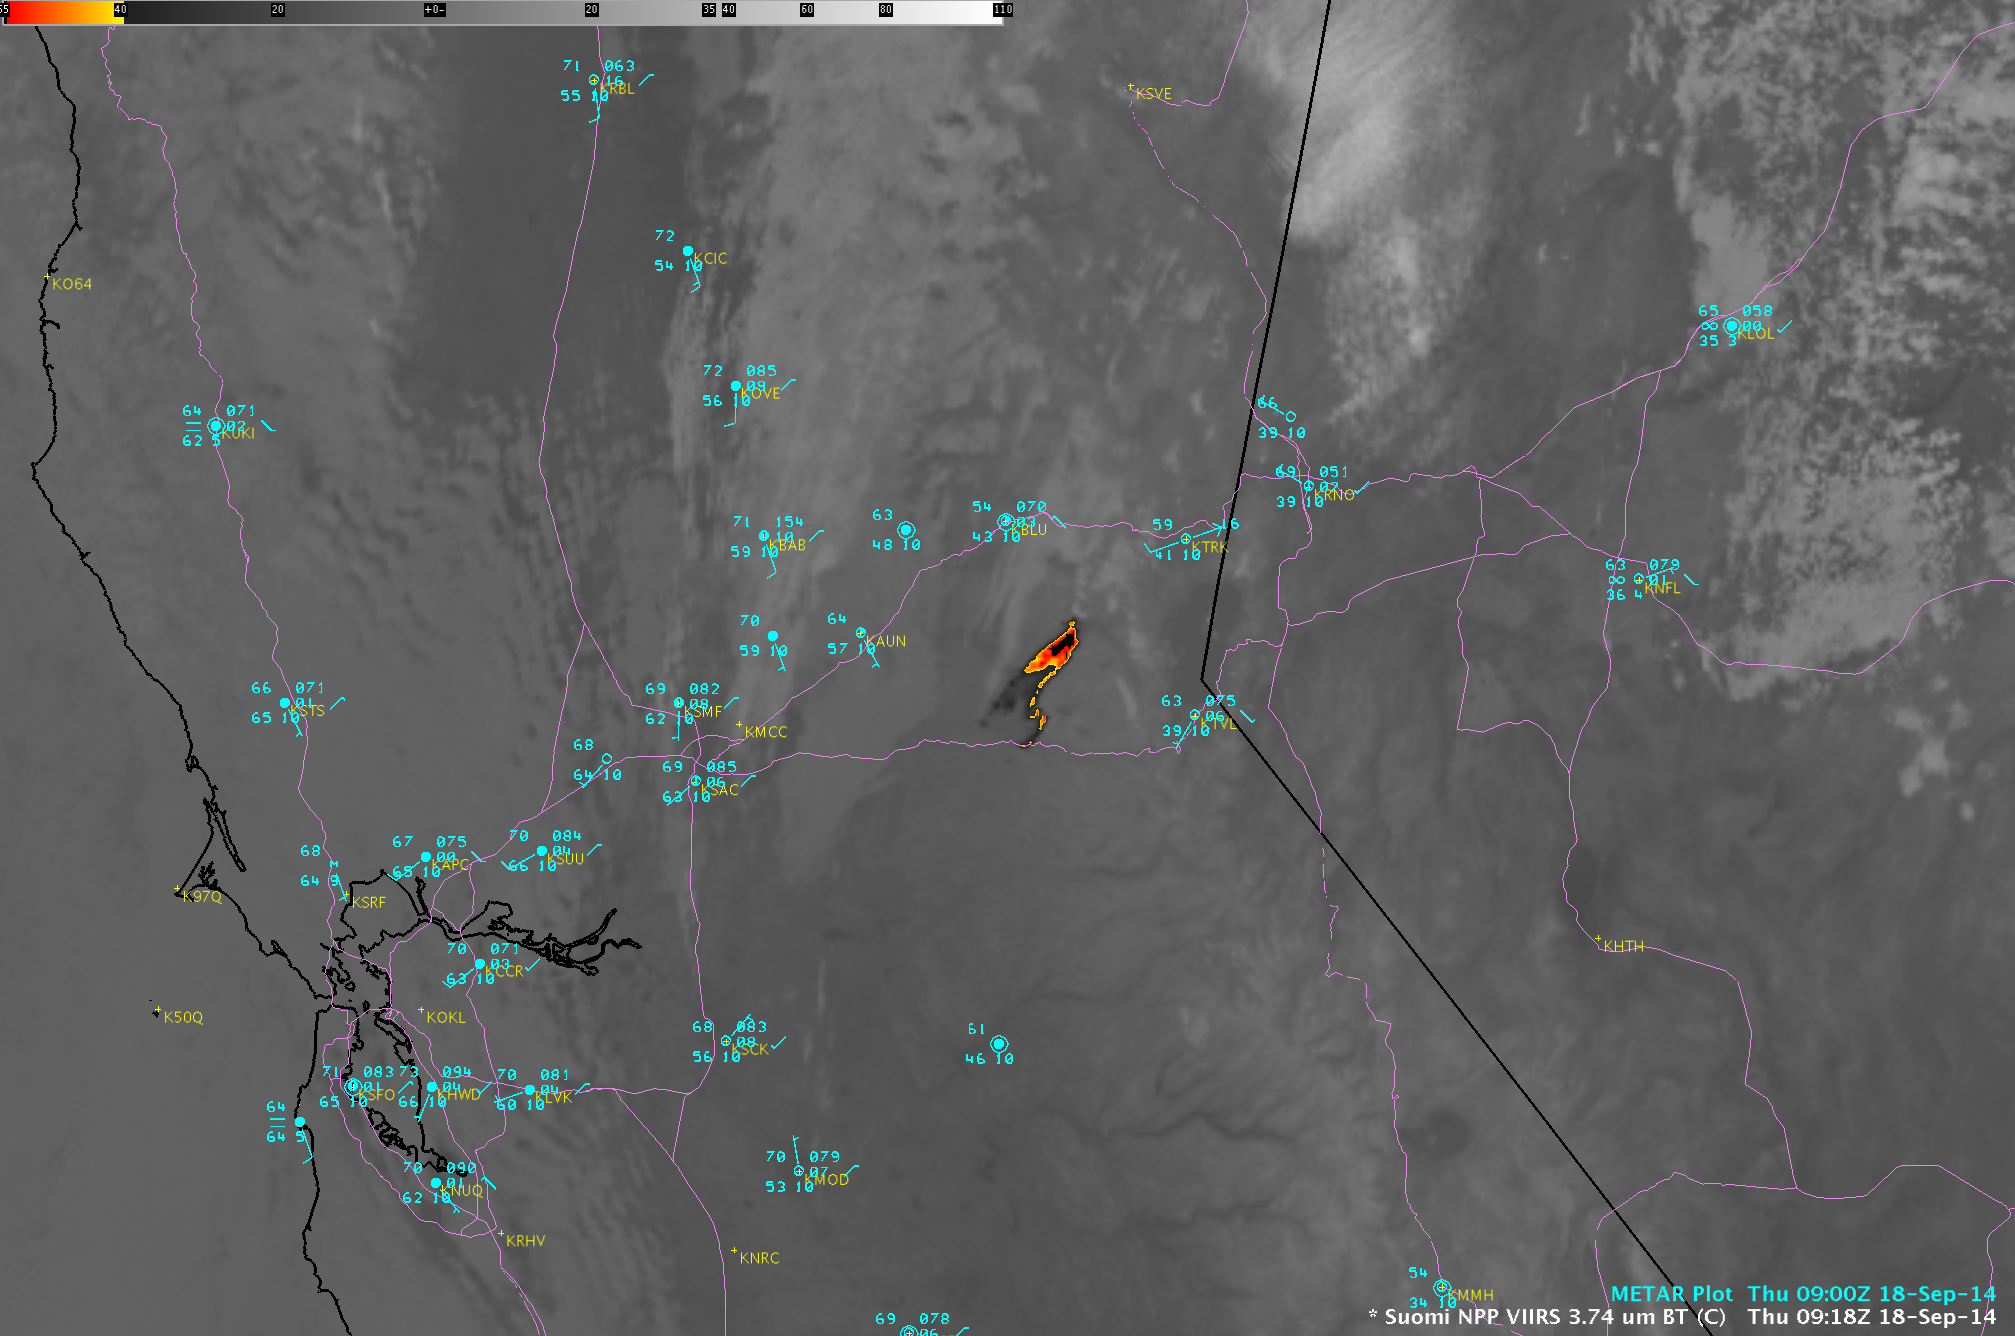
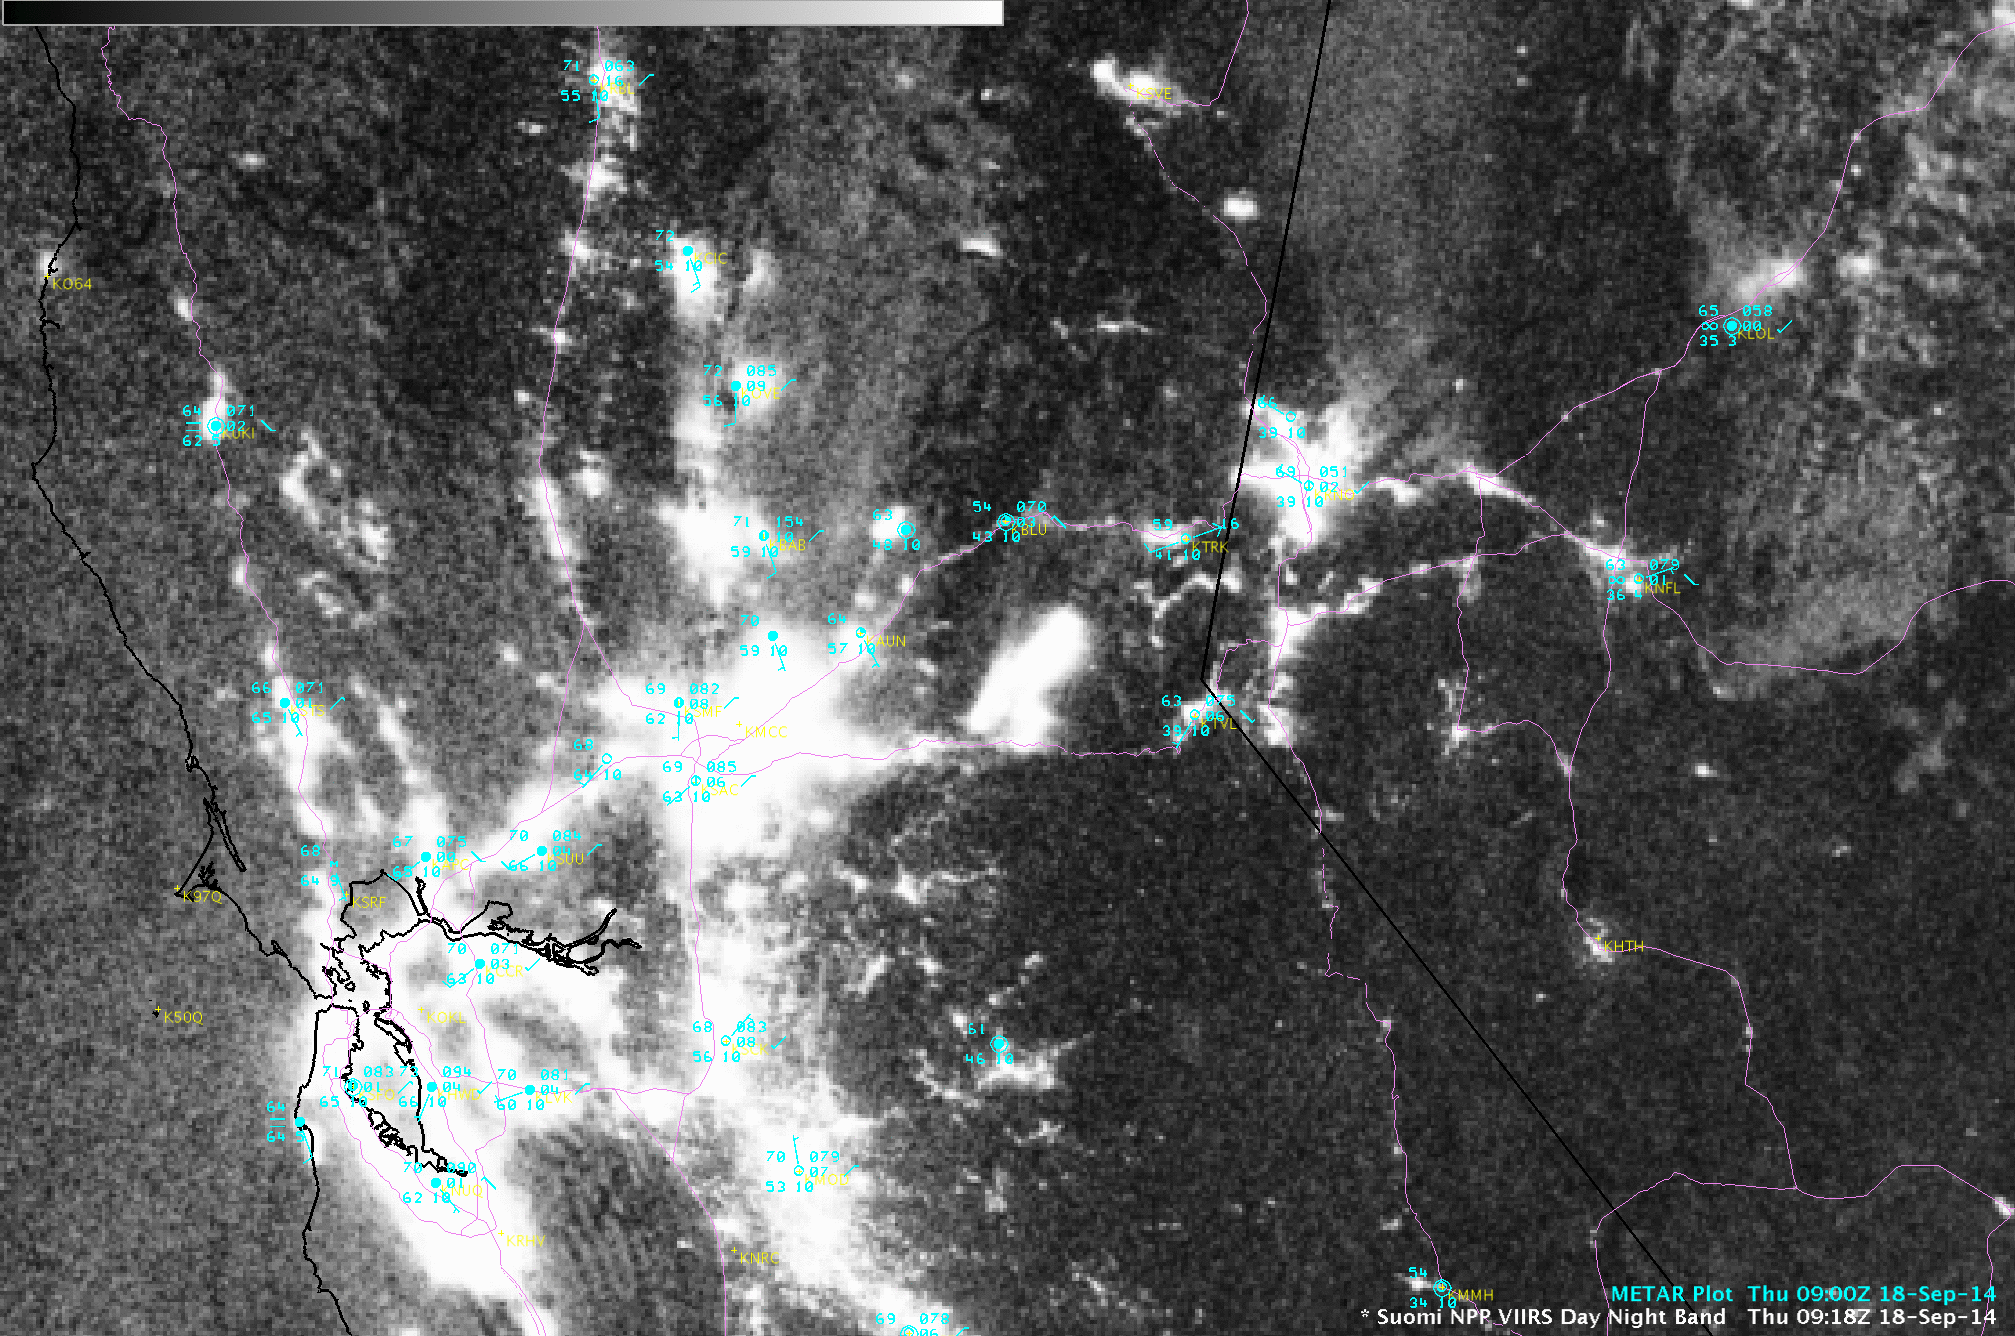
A comparison of AWIPS-II images of Suomi NPP VIIRS 0.7 µm Day/Night Band and 3.74 µm shortwave IR image at 09:18 UTC or 2:18 AM local time (below) revealed the bright glow of the large fire complex, along with the large fire “hot spot” signature (black to yellow to red color enhancement).
Suomi NPP VIIRS 0.7 µm Day/Night Band and 3.74 µm shortwave IR images
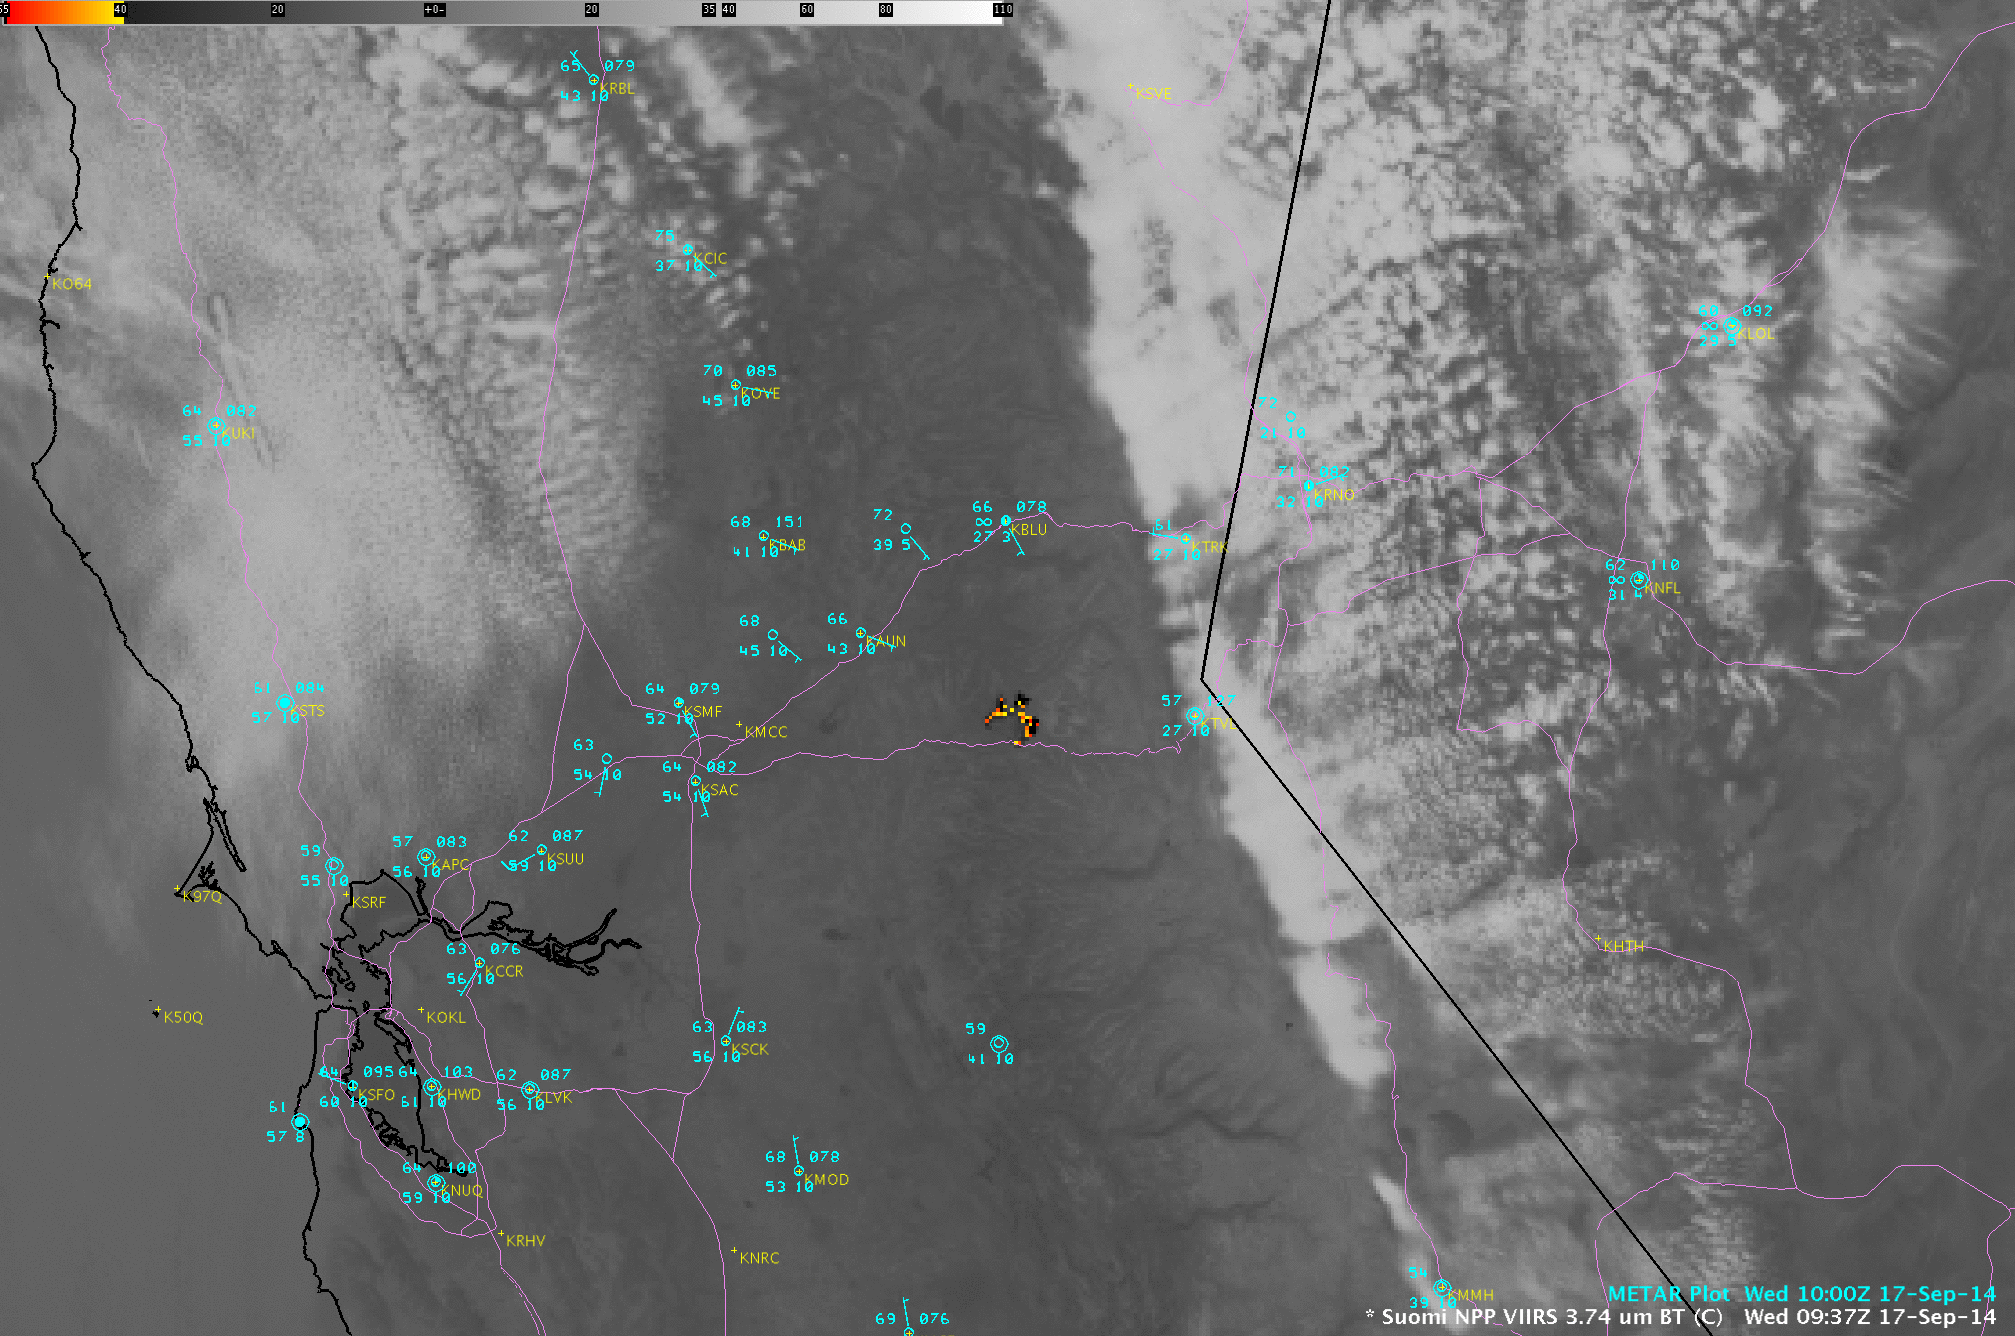
Suomi NPP VIIRS 3.74 µm shortwave IR images during the overnight hours (just after 2 AM local time) on 17 and 18 September (below) showed the dramatic northeastward advance of the fire hot spot signature during that 24-hour period. Smoke from the fire was reducing the surface visibility to 3-4 miles as far to the northeast as Lovelock (KLOL) and Fallon (KNFL) in Nevada.
Suomi NPP VIIRS 3.74 µm shortwave IR images
View only this post Read Less
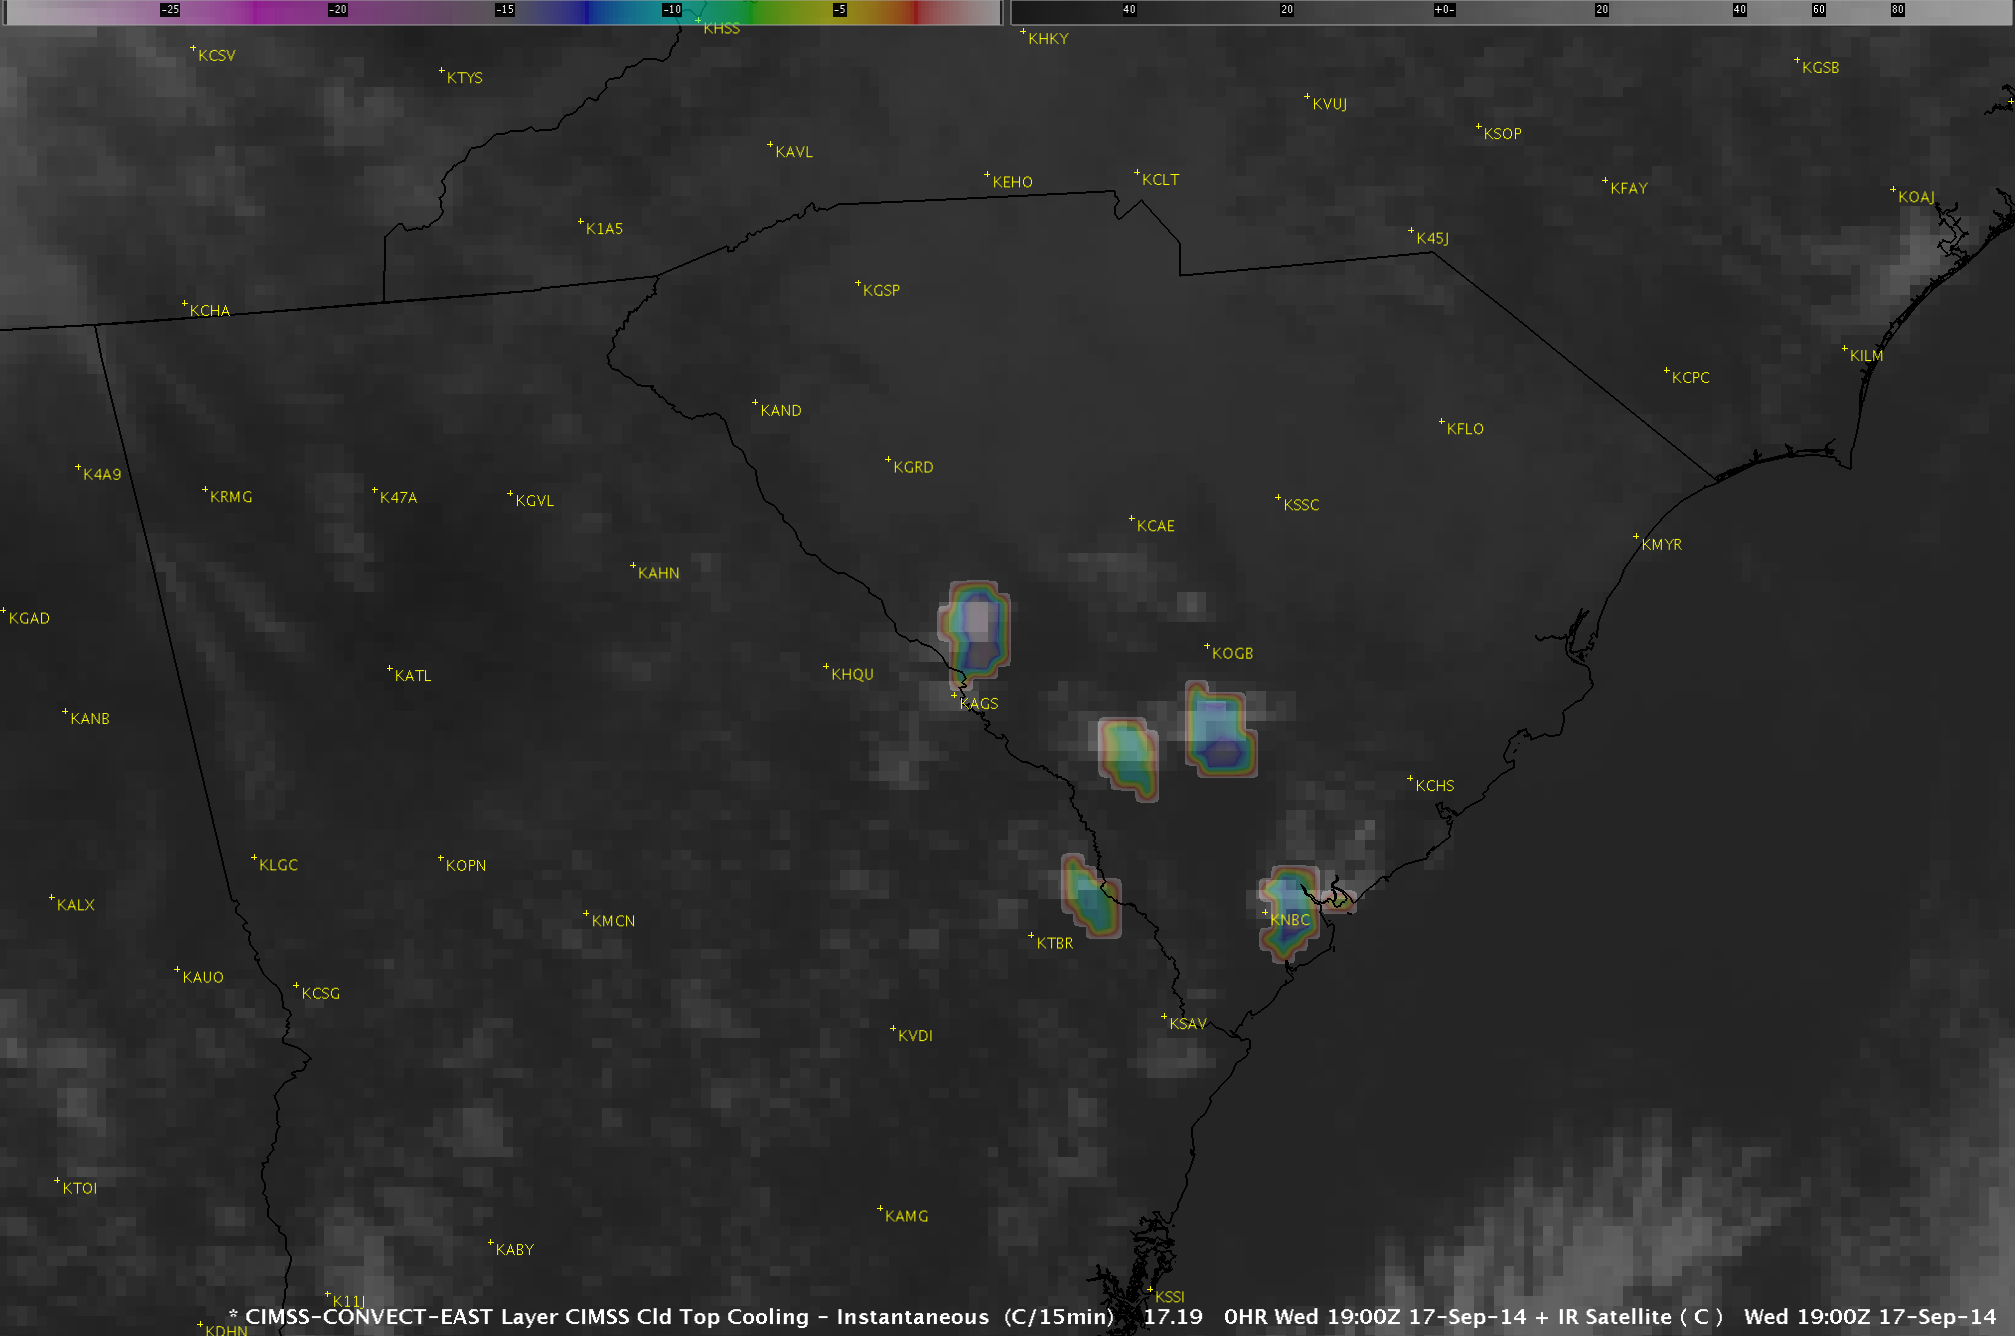
![Cloud Top Cooling Rate (colors) and GOES-13 10.7 µm IR (grayscale) images [click to play animation]](https://cimss.ssec.wisc.edu/satellite-blog/wp-content/uploads/sites/5/2014/09/140917_goes13_ir_ctc_SC_anim.gif)
![GOES-13 10.7 µm IR channel images [click to play animation]](https://cimss.ssec.wisc.edu/satellite-blog/wp-content/uploads/sites/5/2014/09/140917_goes13_ir_SC_anim.gif)

