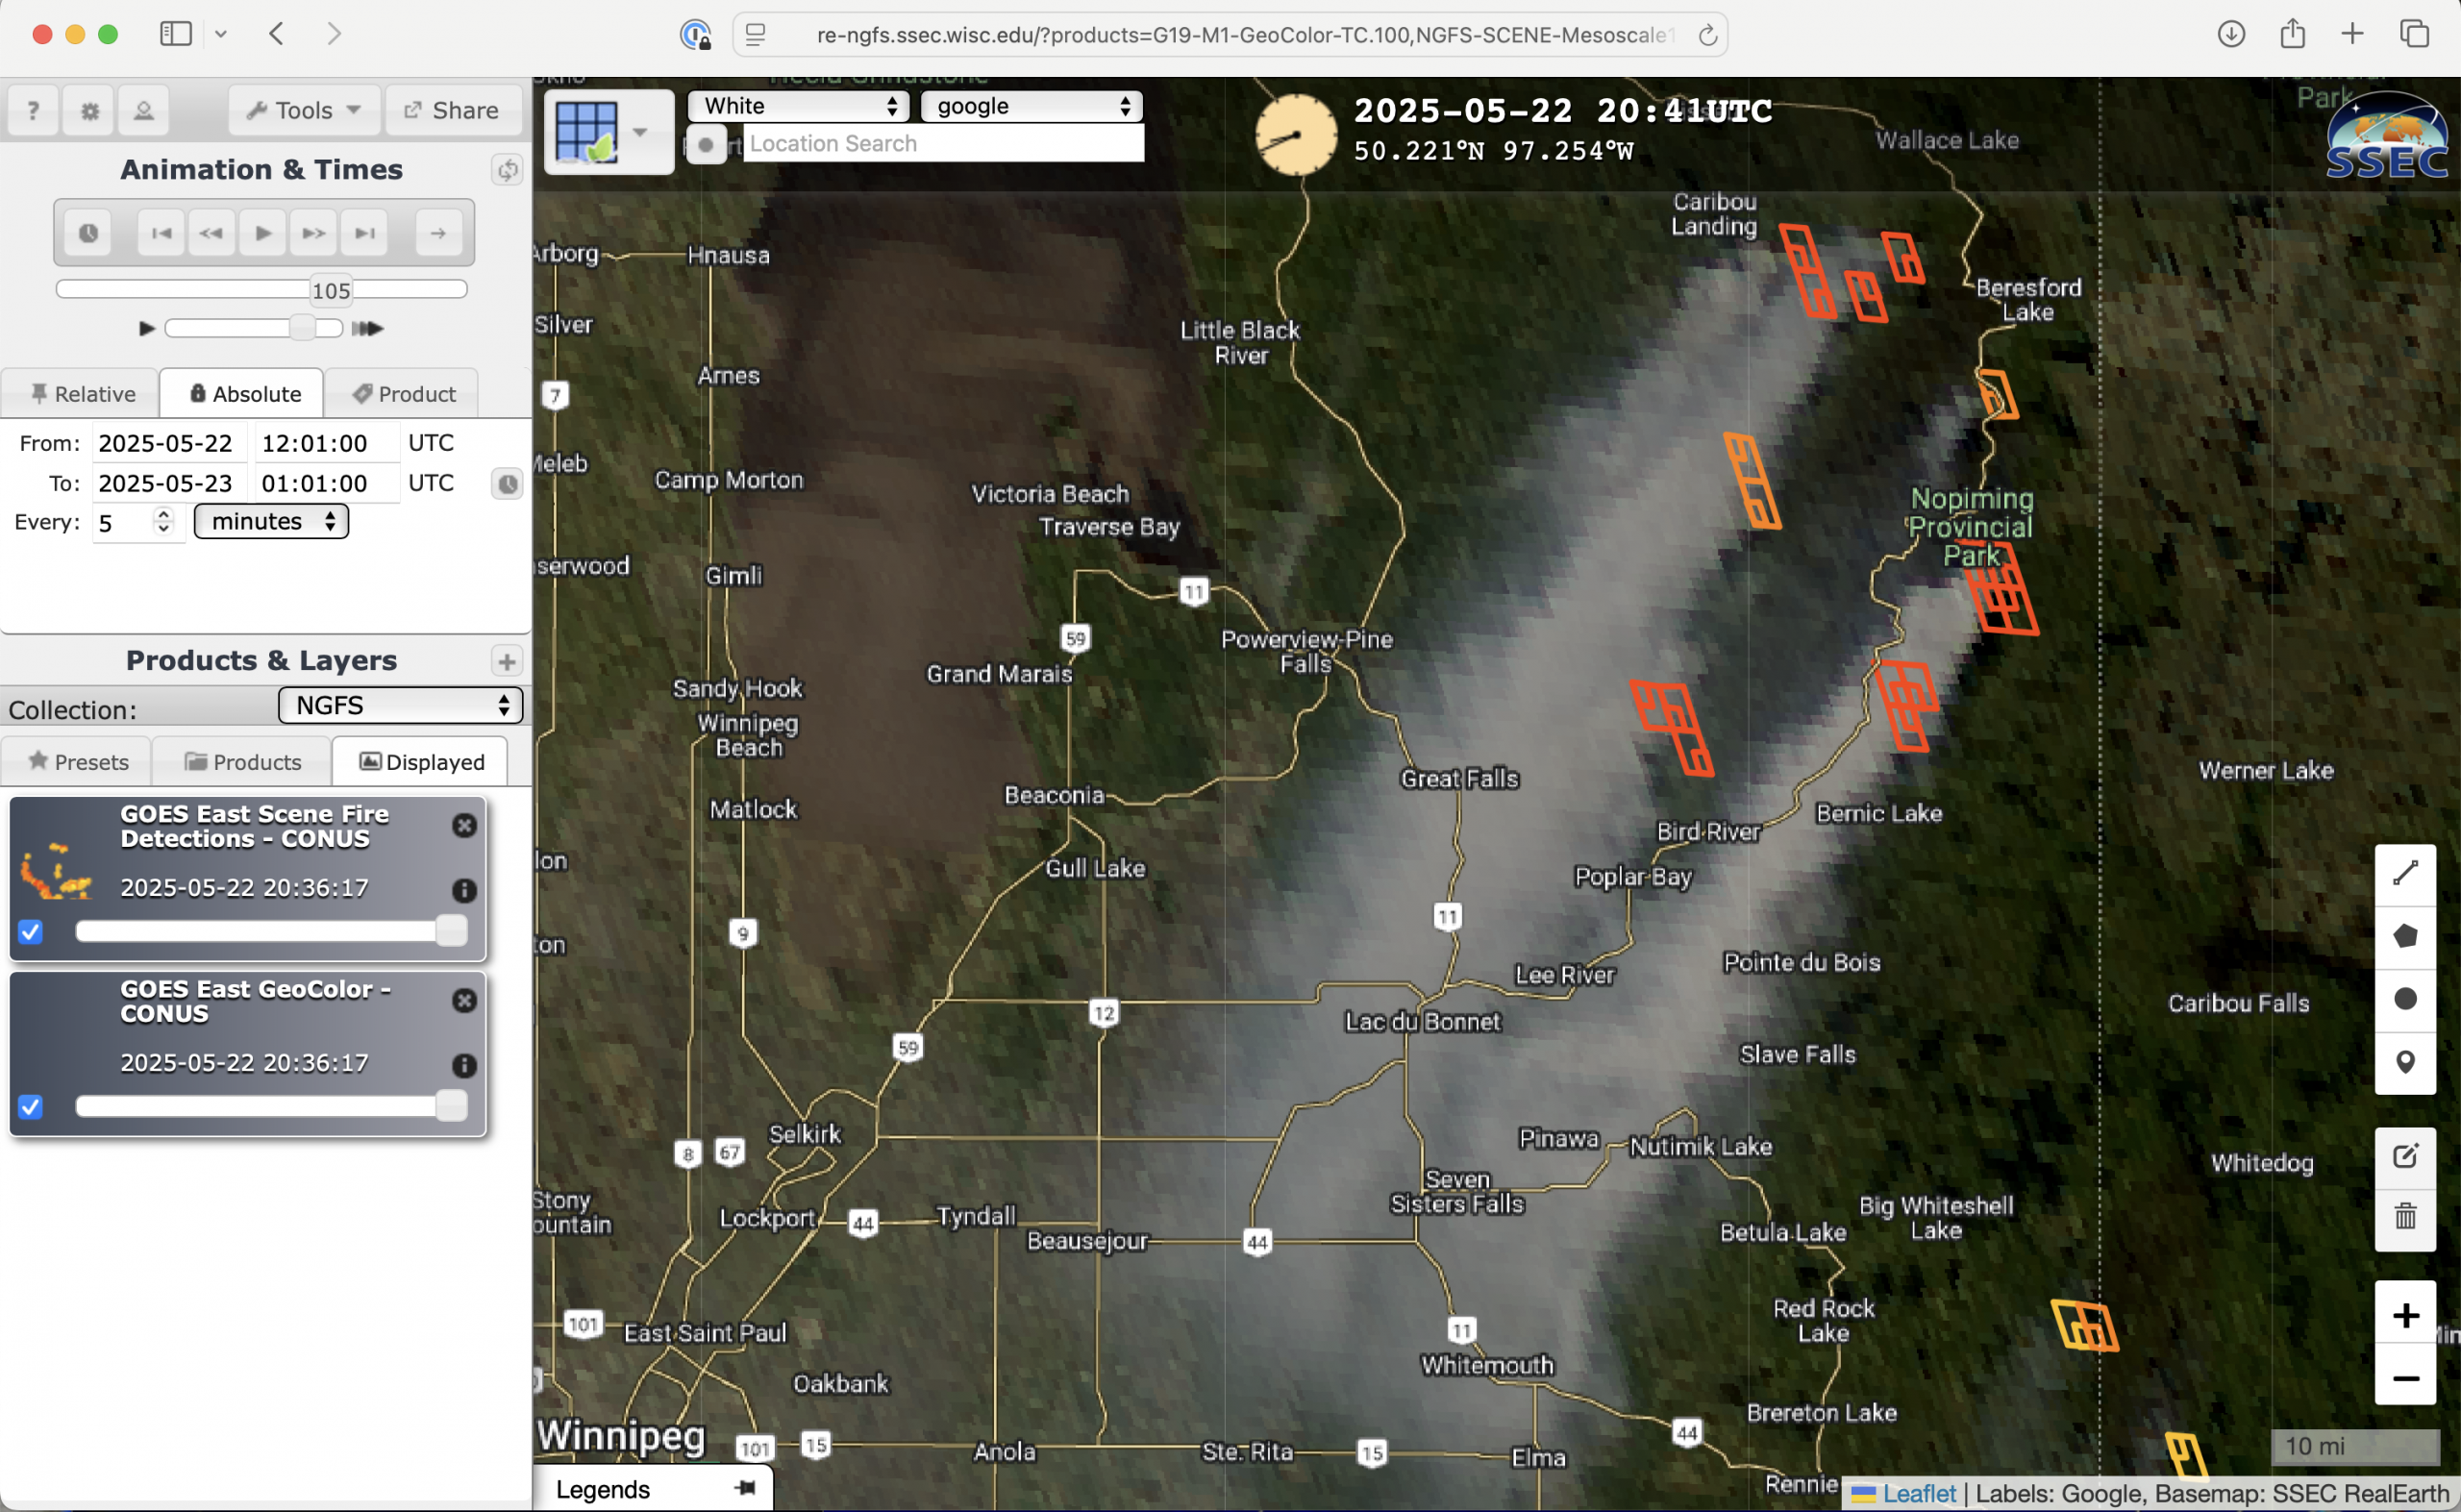
5-minute CONUS Sector GOES-19 (GOES-East) GeoColor RGB images with an overlay of Next Generation Fire System (NGFS) Fire Detection polygons (above) showed the dense smoke plumes and thermal signatures associated with the ongoing Nopiming Provincial Park wildfire on 22 May 2025 (this wildfire exhibited extreme behavior and also produced numerous pyrocumulonimbus clouds on 13 May).GOES-19 Visible... Read More
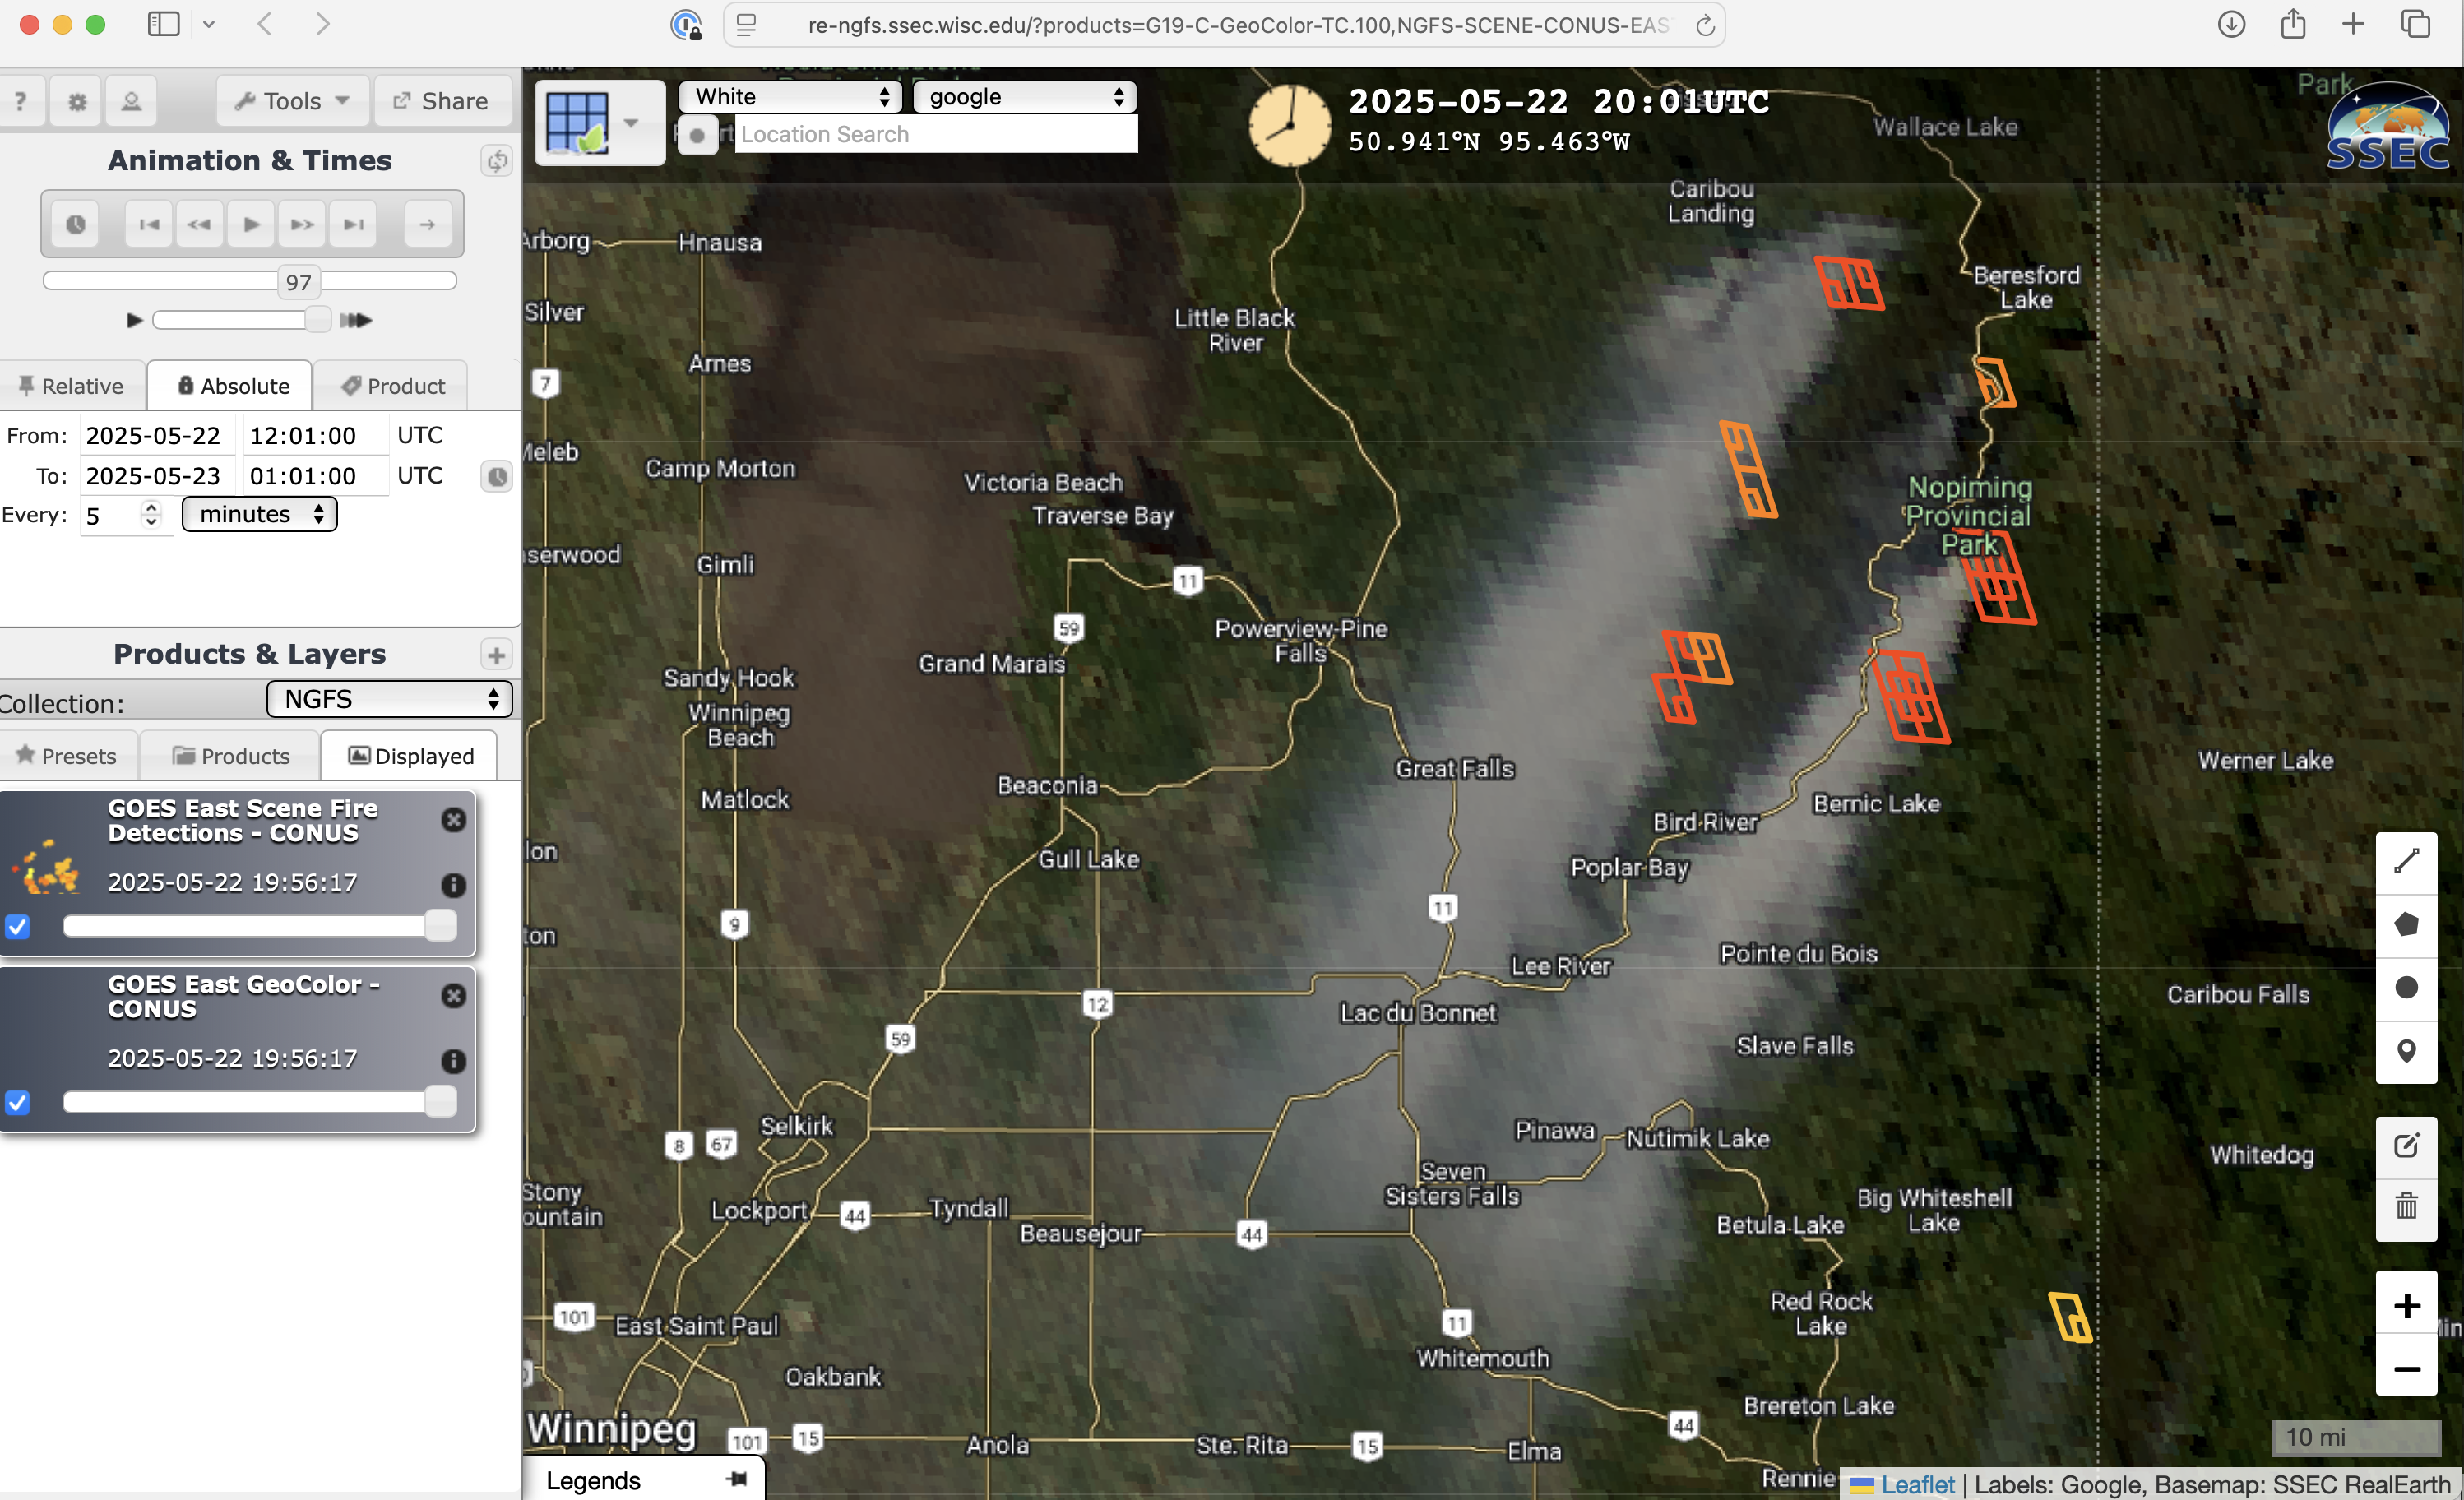
GOES-19 GeoColor RGB images with an overlay of NGFS Fire Detection polygons, from 1201 UTC on 22 May to 0101 UTC on 23 May [click to play MP4 animation]
5-minute CONUS Sector GOES-19
(GOES-East) GeoColor RGB images with an overlay of
Next Generation Fire System (NGFS) Fire Detection polygons
(above) showed the dense smoke plumes and thermal signatures associated with the ongoing Nopiming Provincial Park wildfire on
22 May 2025 (this wildfire exhibited extreme behavior and also produced numerous pyrocumulonimbus clouds on
13 May).
GOES-19 Visible images with an overlay of the FDCA Fire Mask derived product (below) also displayed the wildfire smoke plumes and thermal anomalies.
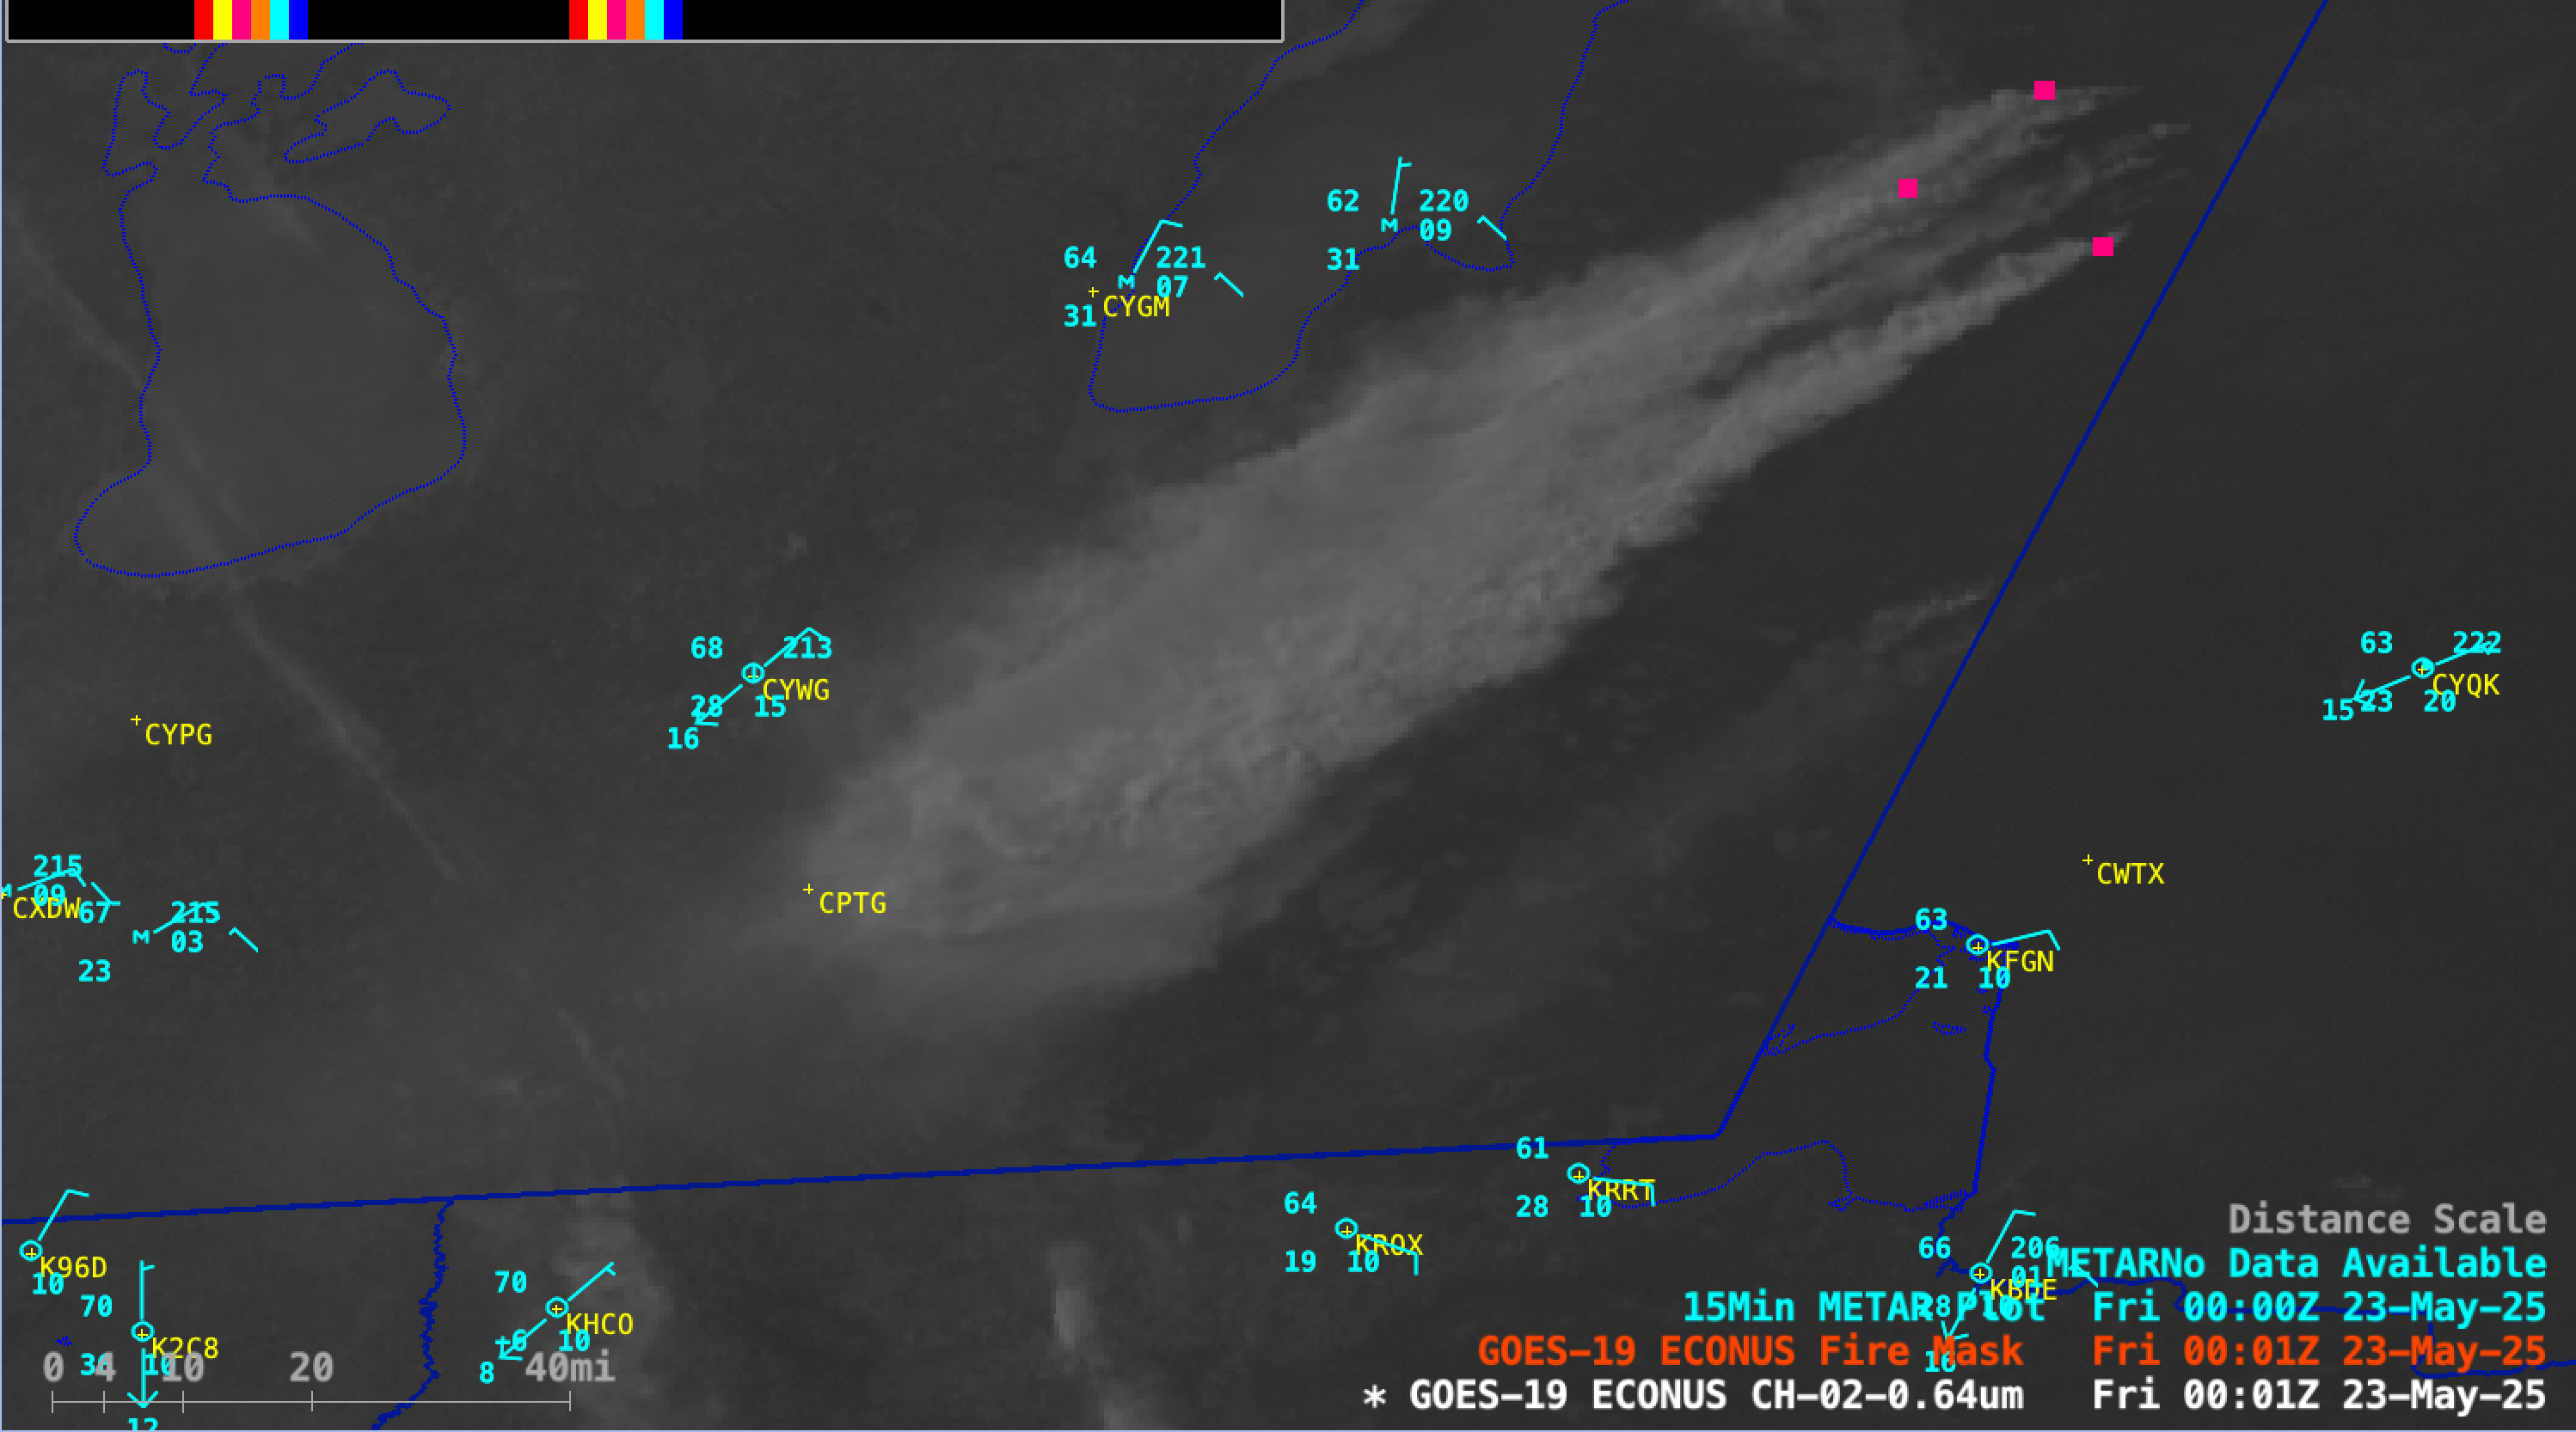
GOES-19 Visible (0.64 µm) images with an overlay of FDCA Fire Mask pixels, from 1201 UTC on 22 May to 0101 UTC on 23 May [click to play MP4 animation]
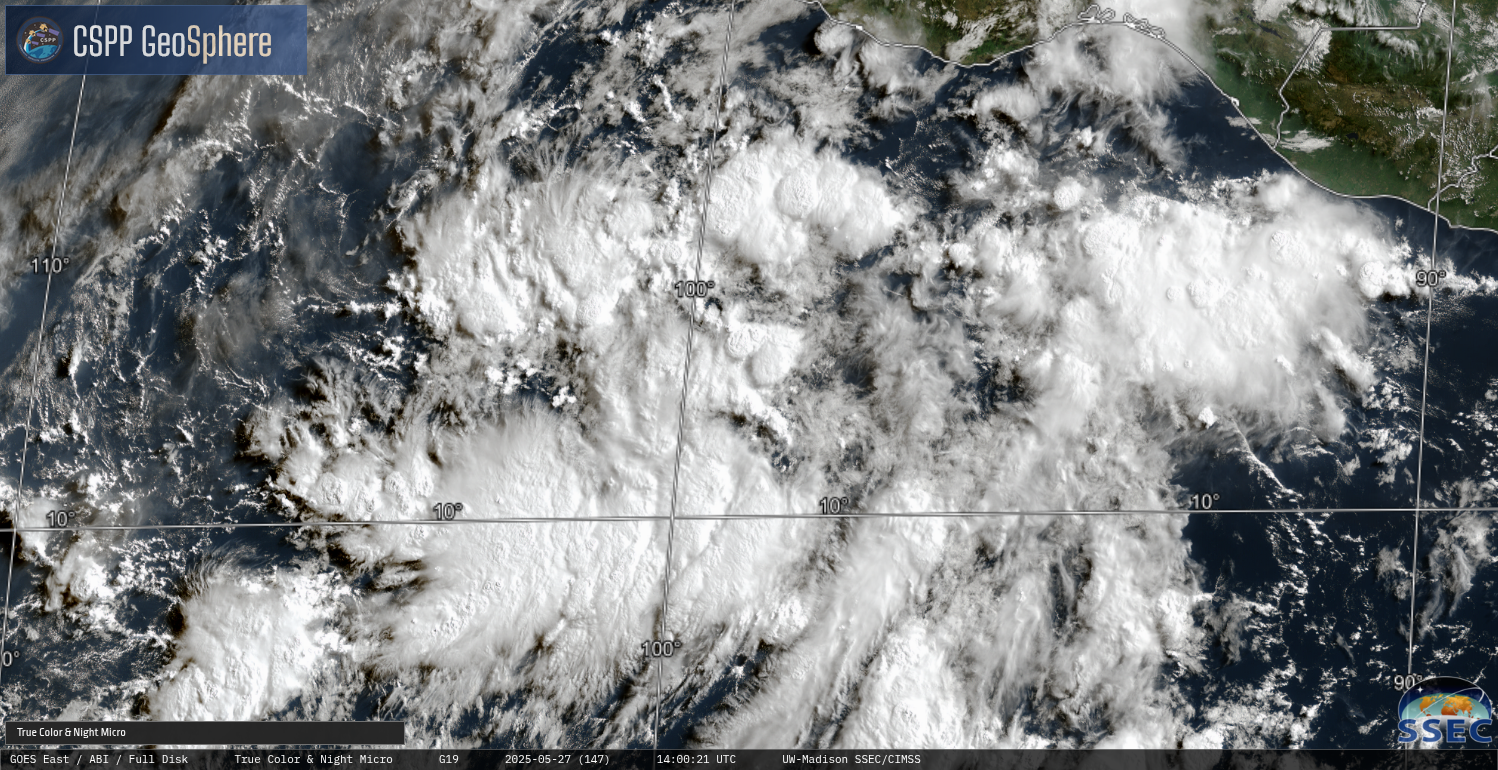
10-minute Full Disk scan GOES-19 True Color RGB and
Aerosol Optical Depth (AOD) derived product images from the
CSPP GeoSphere site
(below) depicted AOD values as high as 1.0 (dark red) within the dense smoke plumes. Smoke from the previous day of Nopiming wildfire activity was also seen drifting across western Manitoba and crossing the Manitoba/Saskatchewan border.
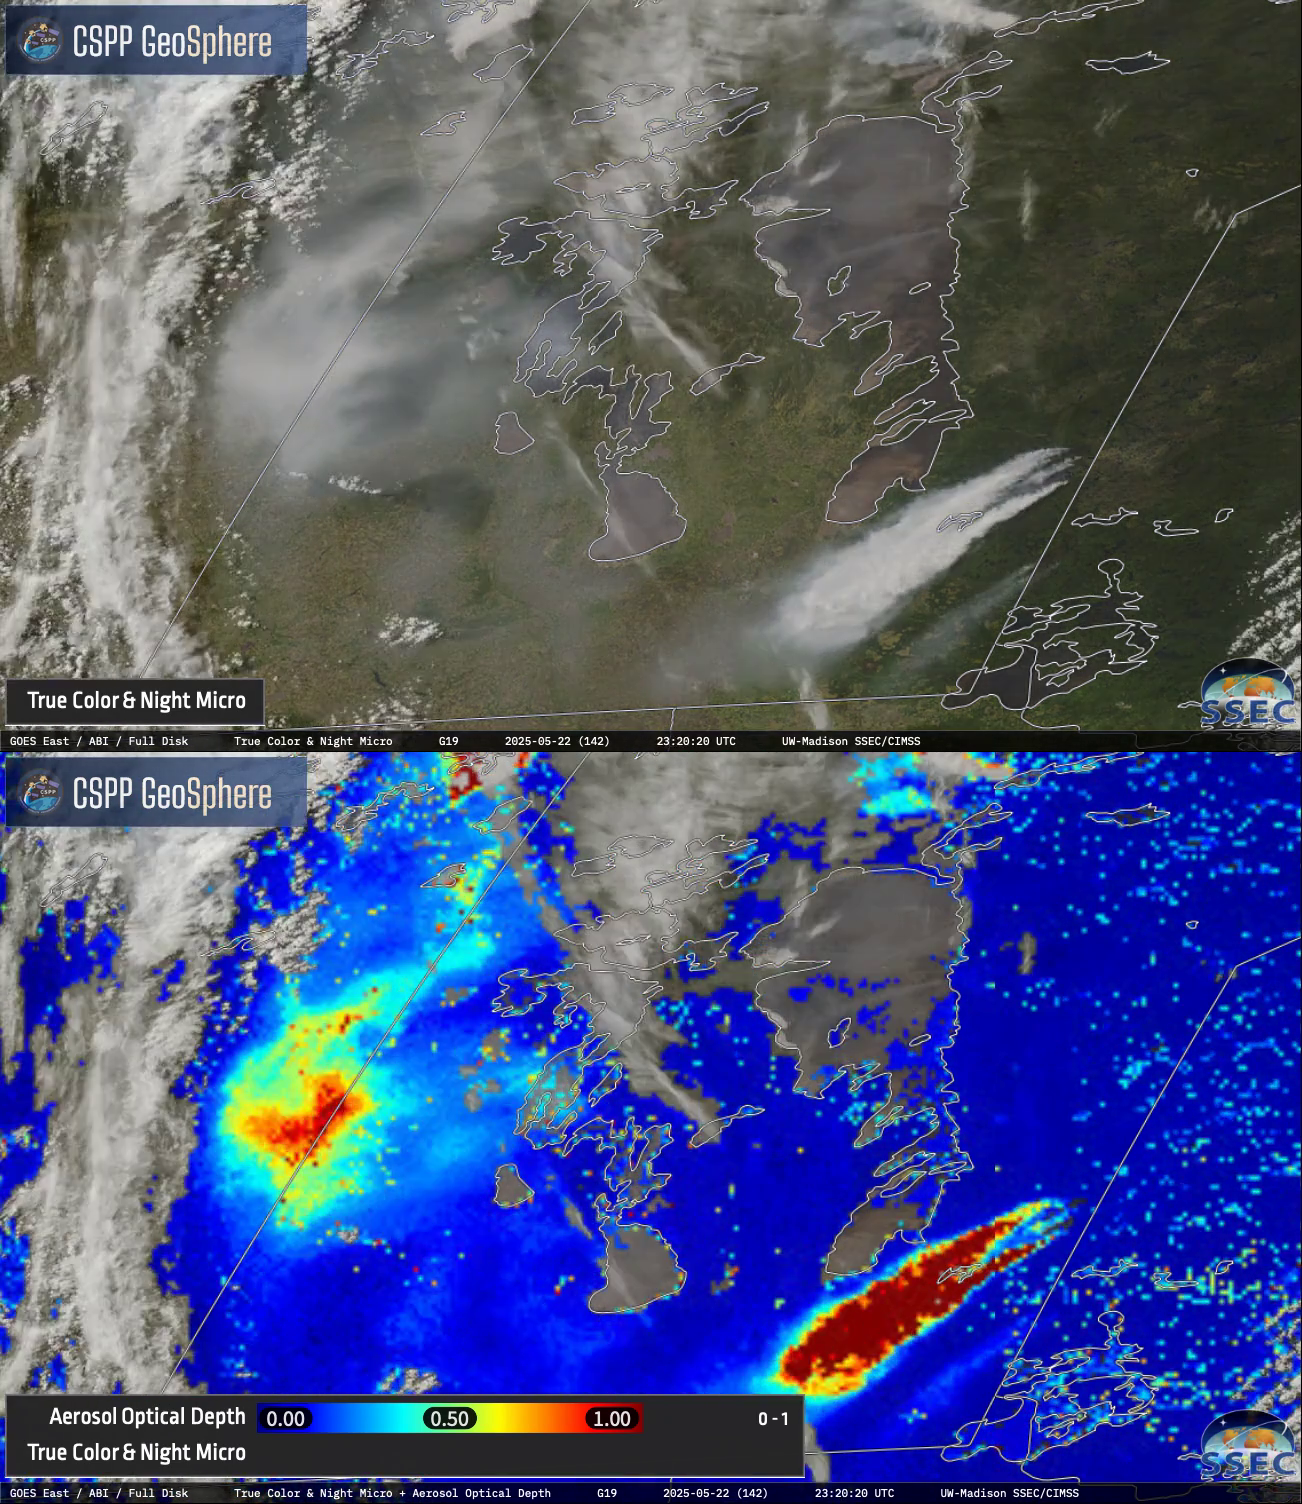
10-minute GOES-19 True Color RGB images (top) and Aerosol Optical Depth derived product (bottom), from 1200 UTC on 22 May to 0100 UTC on 23 May [click to play MP4 animation]
Toggles between VIIRS True Color RGB and False Color RGB images from Suomi-NPP and NOAA-20 (as visualized using
RealEarth) are shown below. Active fires along both the western and eastern periphery of the large Nopiming Fire burn scar showed up as brighter shades of pink in the False Color RGB images — and although none of the individual fires were particularly large, because of the dry fuels being being burned the resulting smoke plumes were quite dense.
Suomi-NPP VIIRS True Color and False Color RGB images valid at 1857 UTC on 22 May [click to enlarge]
NOAA-20 VIIRS True Color and False Color RGB images valid at 1918 UTC on 22 May [click to enlarge]
As the smoke drifted southwestward across the US/Canada border a few hours after sunset, a plot of surface observation data from Cavalier (K2C8) in far northeast North Dakota
(below) showed that the surface visibility at that site was reduced to 6 miles with haze at 0435 UTC and 0515 UTC on 23 May (the base of the smoke layer at those 2 times was 300 ft above ground level).
Plot of surface observation data from Cavalier, North Dakota [click to enlarge]
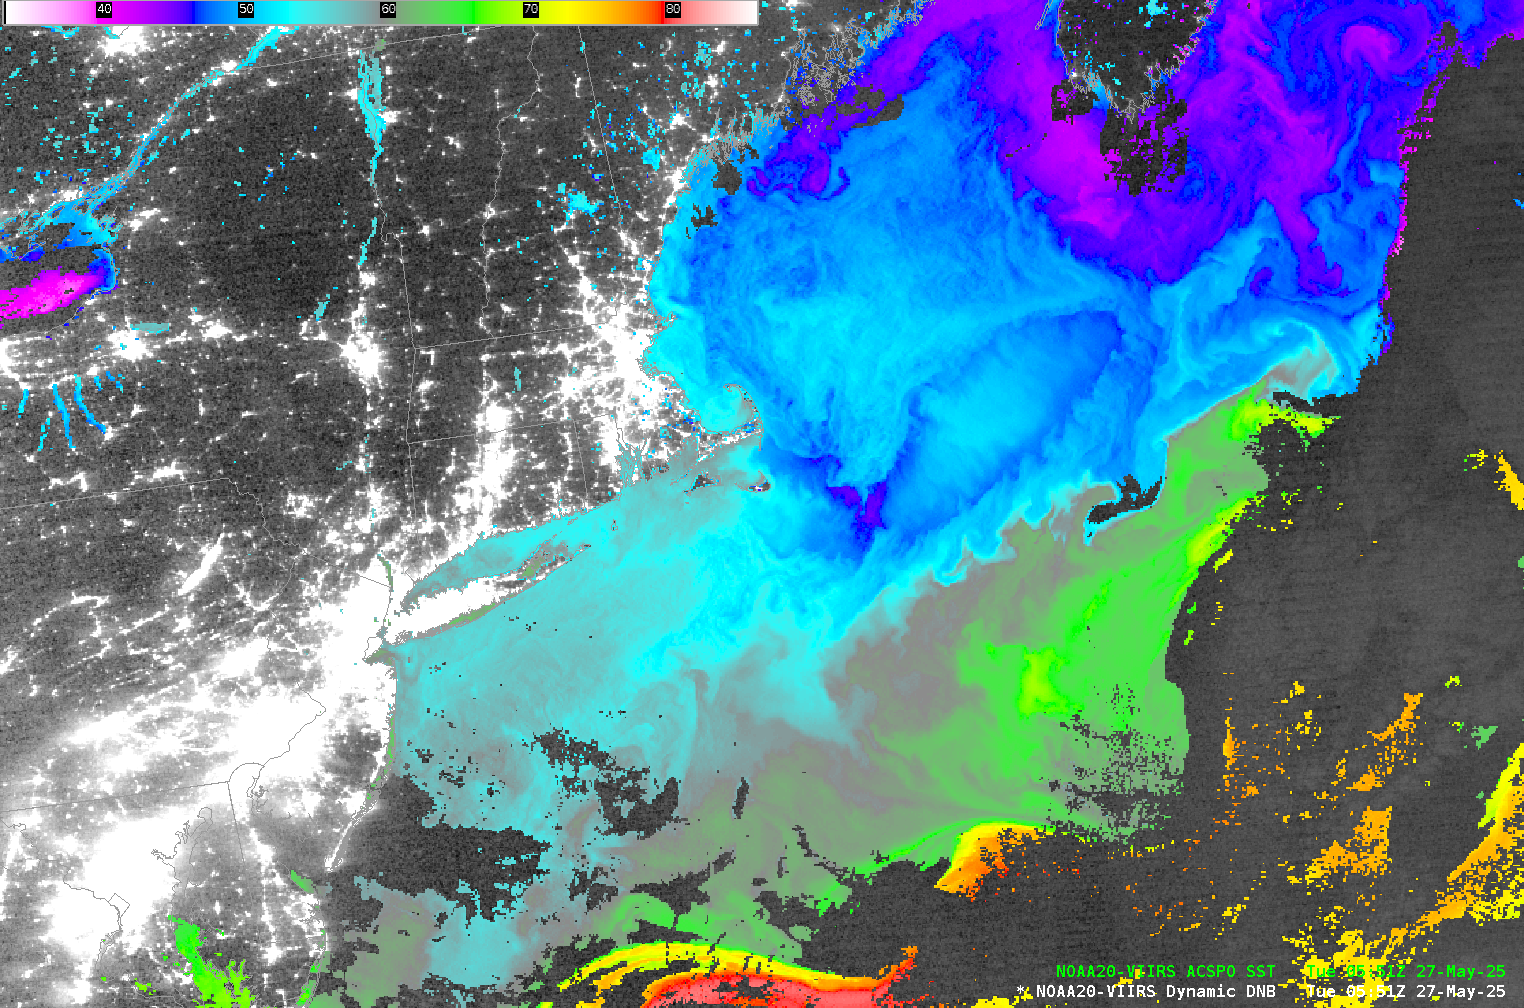
A NOAA-20 VIIRS Day/Night Band image valid at 0912 UTC (4:12 AM local time) on 23 May revealed the bright nighttime glow of fires that continued to burn overnight along/near the edges of the darker-gray Nopiming Fire burn scar. Faint smoke plumes (light shades of gray) could be seen drifting W-NW away from several of the active fires.
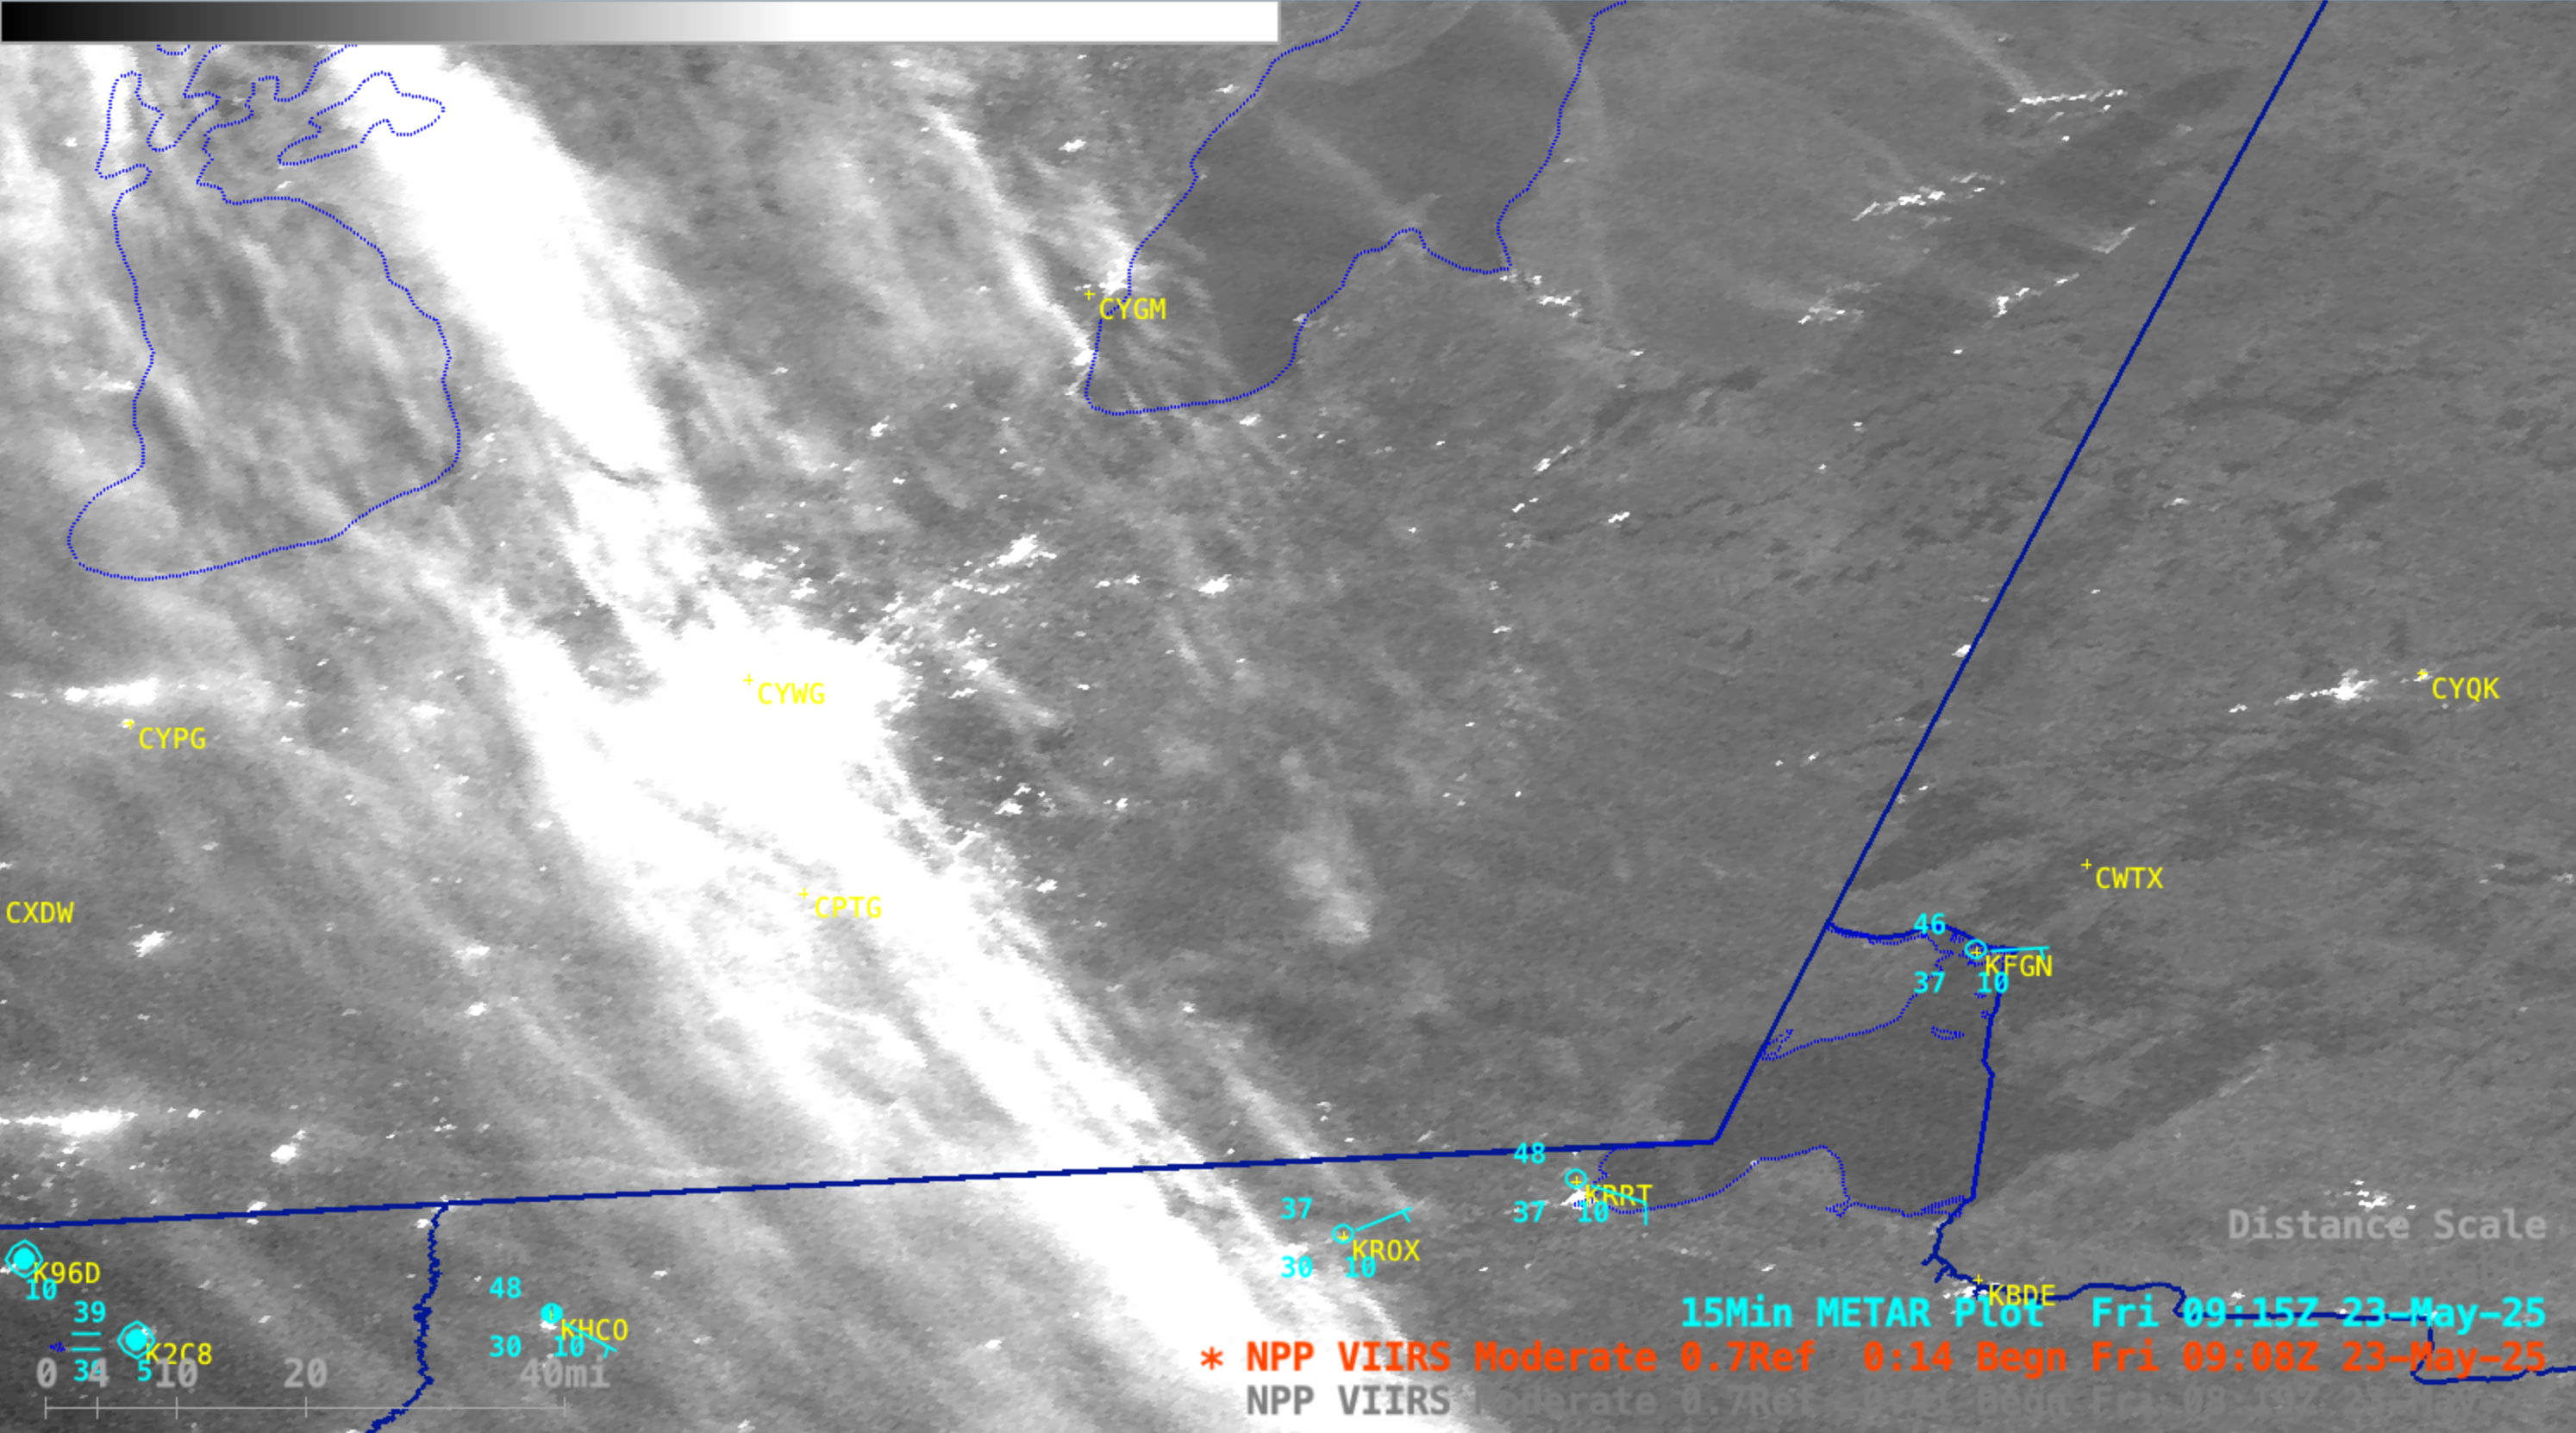
NOAA-20 (mislabeled by AWIPS as NPP) VIIRS Day/Night Band (0.7 µm) image valid at 0912 UTC on 23 May [click to enlarge]
View only this post
Read Less


