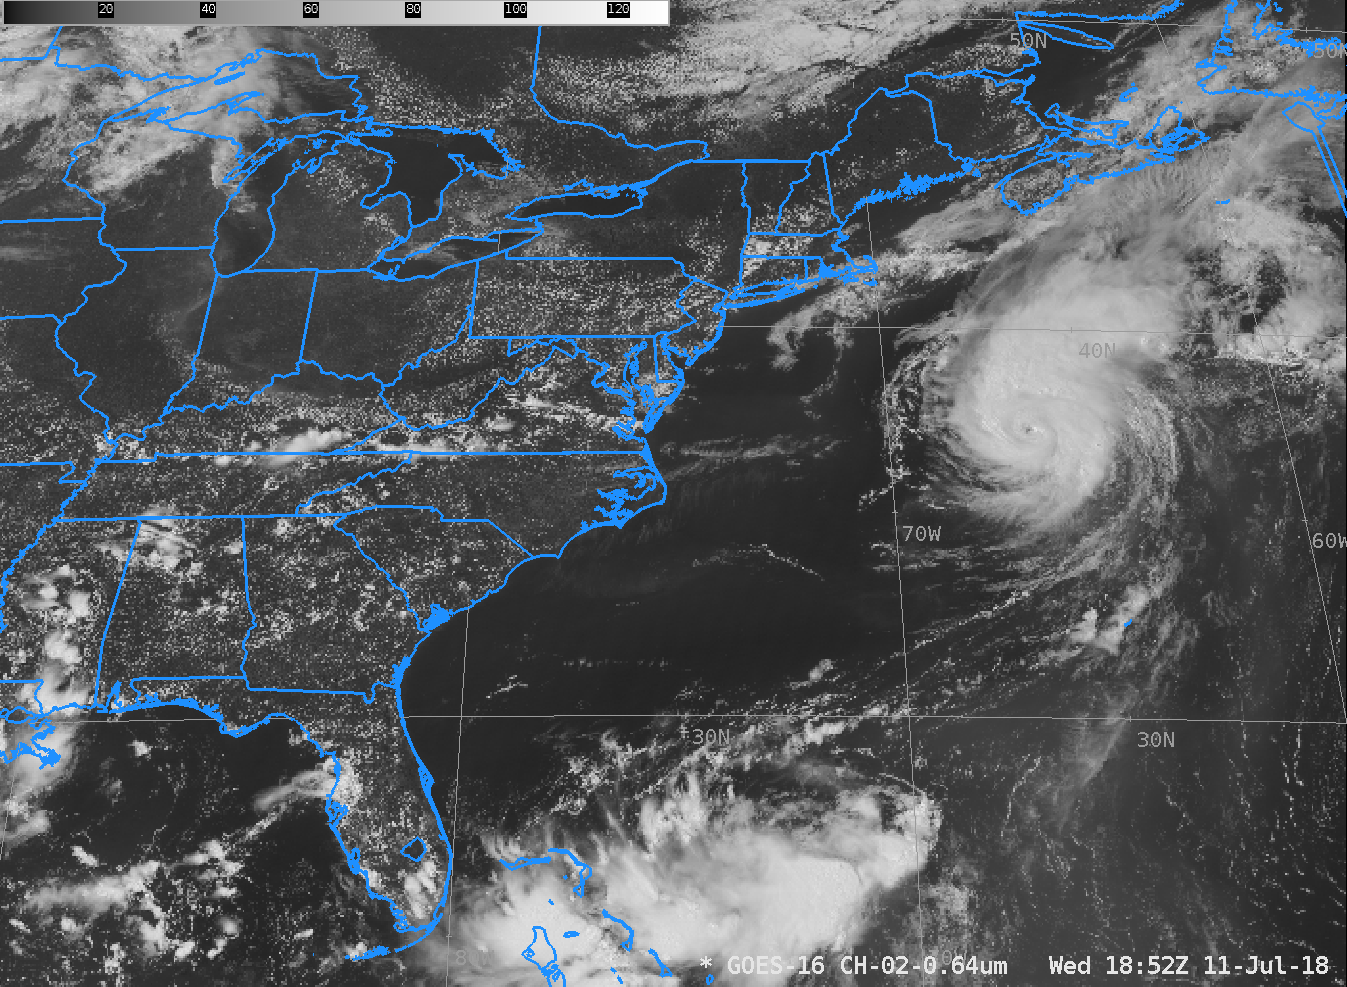

GOES-16 ABI Band 2 (“Red Visible”) Visible (0.64 µm) Imagery, 1852-2117 UTC on 11 July 2018 (Click to animate)
Hurricane Chris is accelerating away from the United States (although it will likely pass very close to Cape Race, Newfoundland Canada). Visible Imagery (GOES-16 ABI Band 2, “Red Visible”, at 0.64 µm), above, from late afternoon on 11 July shows a well-developed storm with a pronounced eye.
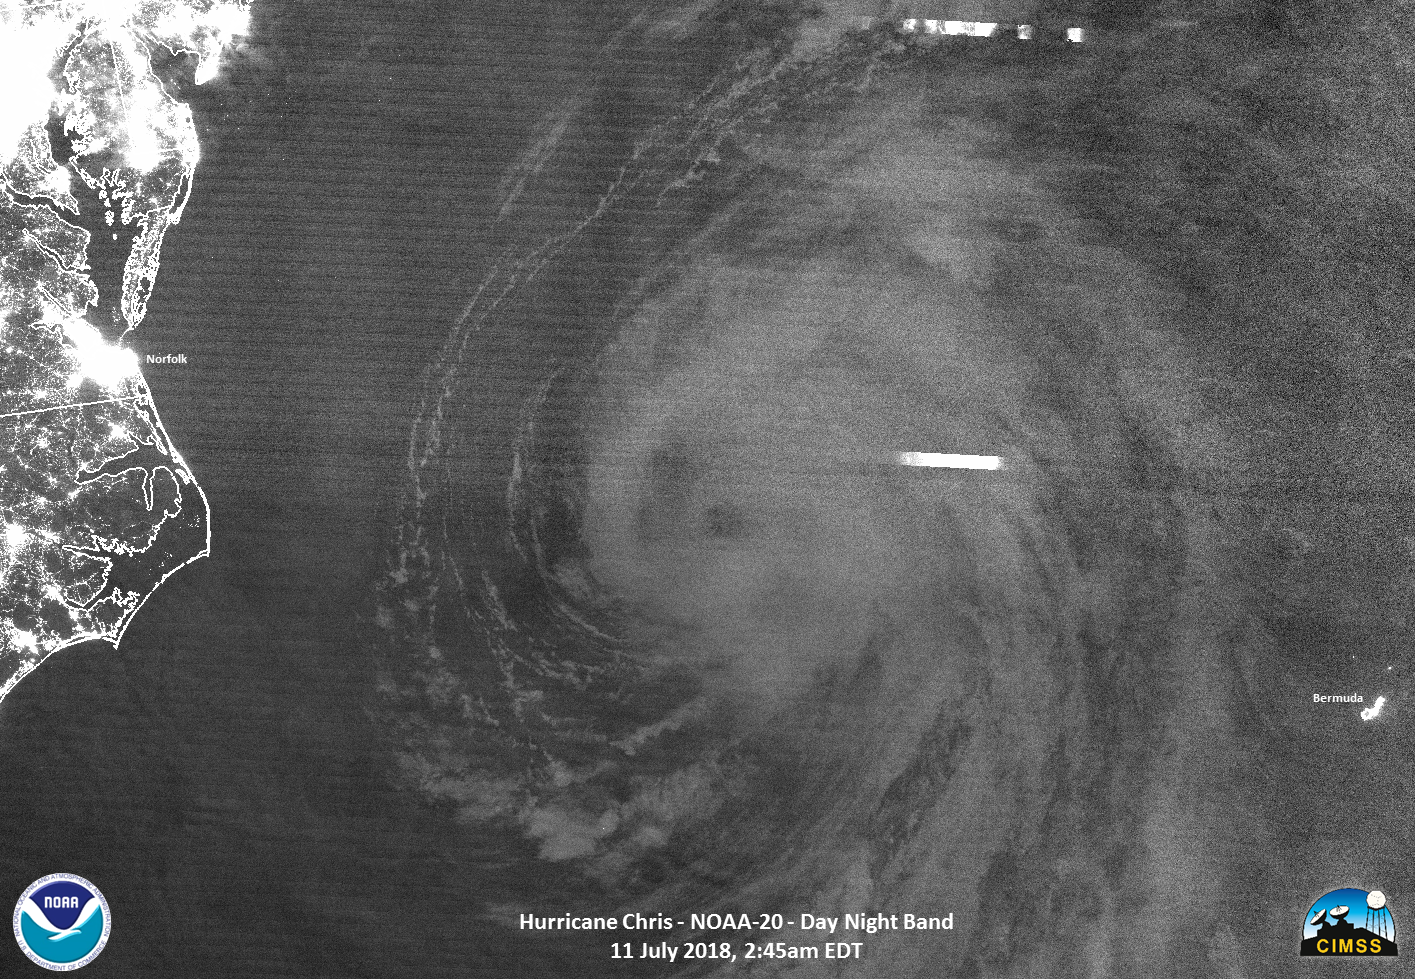
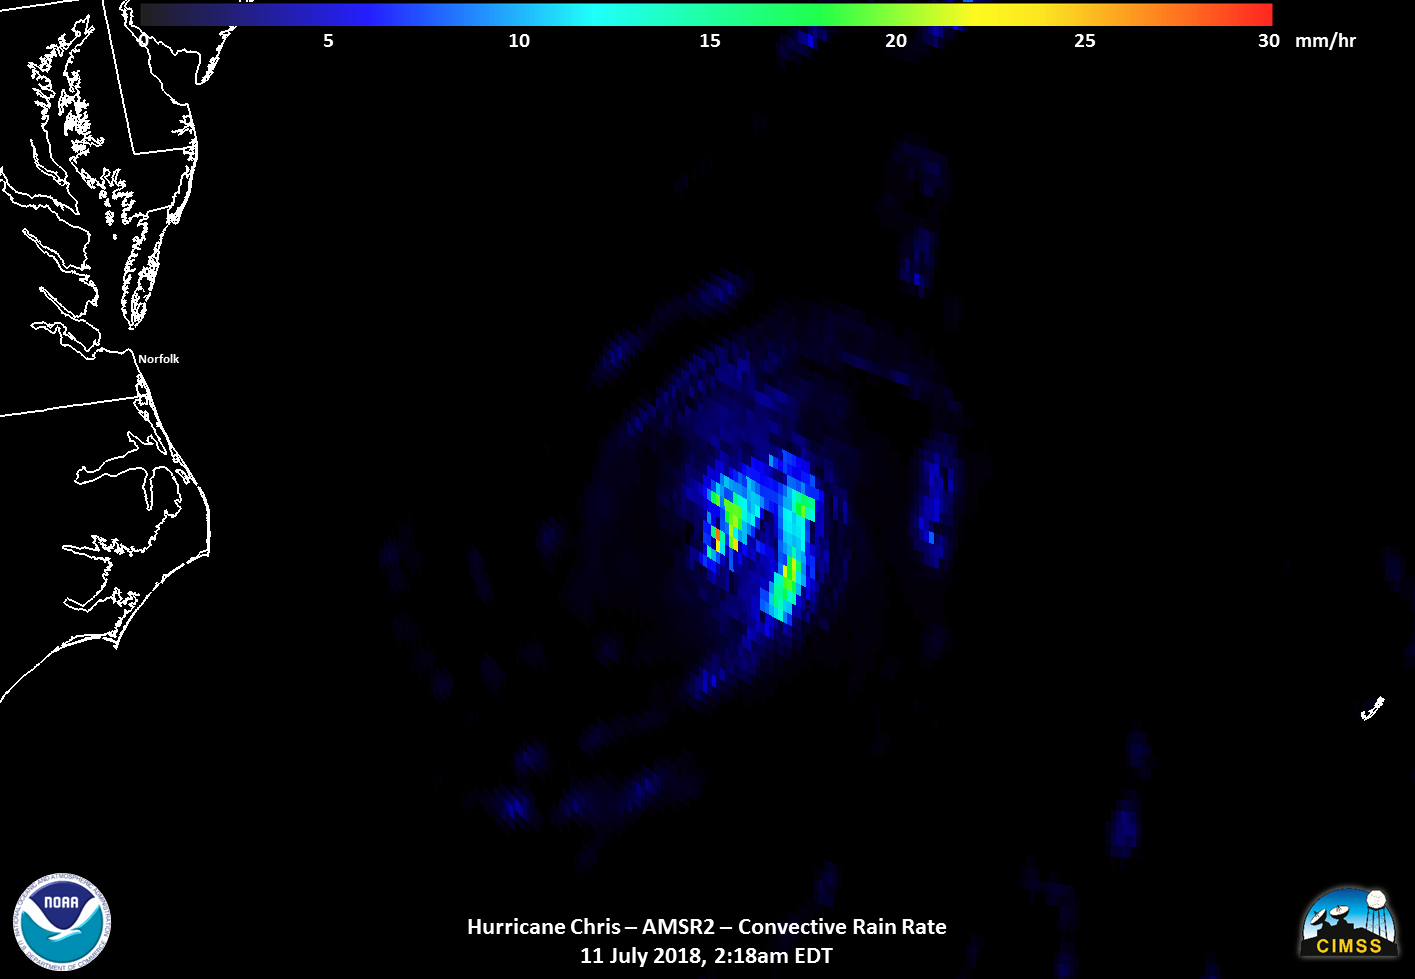
Before Sunrise on 11 July 2018, both NOAA-20 and JAXA’s Global Change Observation Mission (GCOM) Satellite overflew the storm at slightly different times. The VIIRS (Visible Infrared Imaging Radiometer Suite) instrument NOAA-20 samples in the visible and infrared part of the electromagnetic spectrum whereas the AMSR2 Instrument (Advanced Microwave Scanning Radiometer 2) on GCOM samples in the microwave. Because microwave energy can penetrate clouds, it can be used to estimate rainfall, and the toggle below steps through the Infrared (11.45 µm) and Day Night Band Visible (0.70 µm) from VIIRS (at 0645 UTC) as well as the Convective Precipitation and Surface Rain rate from AMSR2 (at 0618 UTC).
Lunar illumination is absent in the Day Night band visible imagery, but Earth glow nevertheless illuminates the eye of the storm; in addition, two lightning streaks are visible north and east of the center. Surface Rain and Convective Rain rates show the heaviest rains near the storm center, as expected (NOAA-20 VIIRS and GCOM AMSR2 imagery courtesy William Straka, CIMSS).
VIIRS Infrared (11.45 µm) and Visible (0.70 µm) Day Night Band Visible Imagery, 0645 UTC on 11 July 2018, and GCOM AMSR2 Convective Precipitation and Surface Rain Rate estimates at 0618 UTC on 11 July (Click to enlarge)
View only this post Read Less
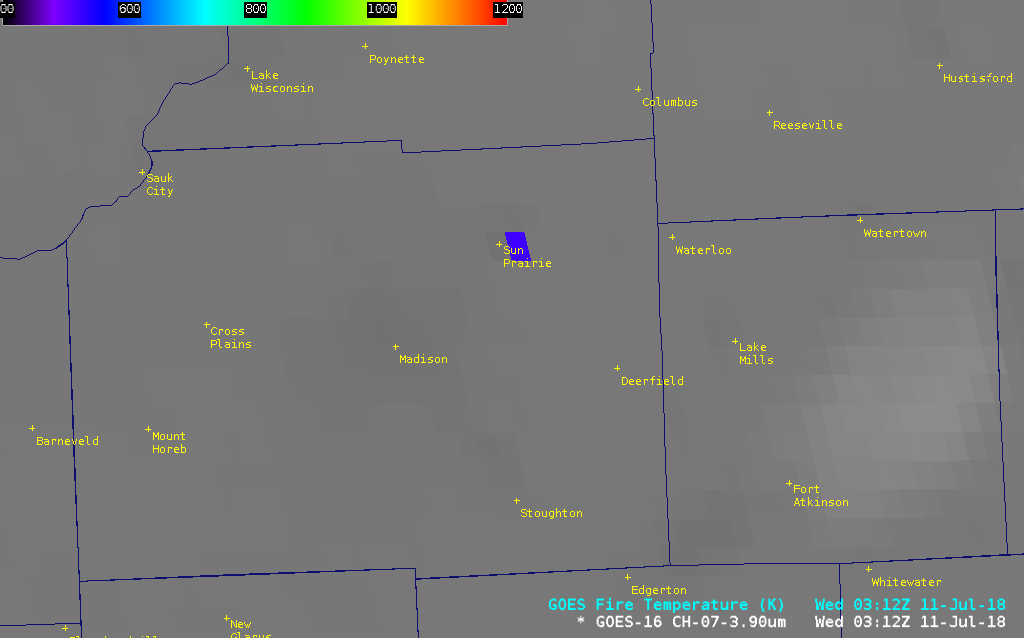
![GOES-16 Shortwave Infrared (3.9 µm) image and Fire Temperature derived product [click to play animation]](https://cimss.ssec.wisc.edu/satellite-blog/wp-content/uploads/sites/5/2018/07/180710_goes16_ShortwaveInfrared_FireTemperature_Sun_Prairie_WI_fire_anim.gif)
![Terra MODIS Shortwave Infrared (3.74 µm) image, with plots of surface observations in yellow [click to enlarge]](https://cimss.ssec.wisc.edu/satellite-blog/wp-content/uploads/sites/5/2018/07/MODIS_4_MICRON_20180711_0338.png)
![Terra MODIS, Suomi NPP VIIRS and Aqua MODIS Shortwave Infrared images [click to enlarge]](https://cimss.ssec.wisc.edu/satellite-blog/wp-content/uploads/sites/5/2018/07/180710_11_modis_viirs_shortwaveIR_Sun_Prairie_WI_fire_anim.gif)

![NOAA-20 VIIRS Visible (0.64 µm) and Infrared Window (11.45 µm) images [click to enlarge]](https://cimss.ssec.wisc.edu/satellite-blog/wp-content/uploads/sites/5/2018/07/180710_1821utc_suomi_npp_viirs_visible_infrared_Chris_anim.gif)
![GPM GMI Microwave (85 GHz) image [click to enlarge]](https://cimss.ssec.wisc.edu/satellite-blog/wp-content/uploads/sites/5/2018/07/180710_1326utc_gpm_gmi_microwave_Chris.jpeg)
![MIMIC-TC morphed microwave image product [click to enlarge]](https://cimss.ssec.wisc.edu/satellite-blog/wp-content/uploads/sites/5/2018/07/180710_mimic_Chris_anim.gif)
