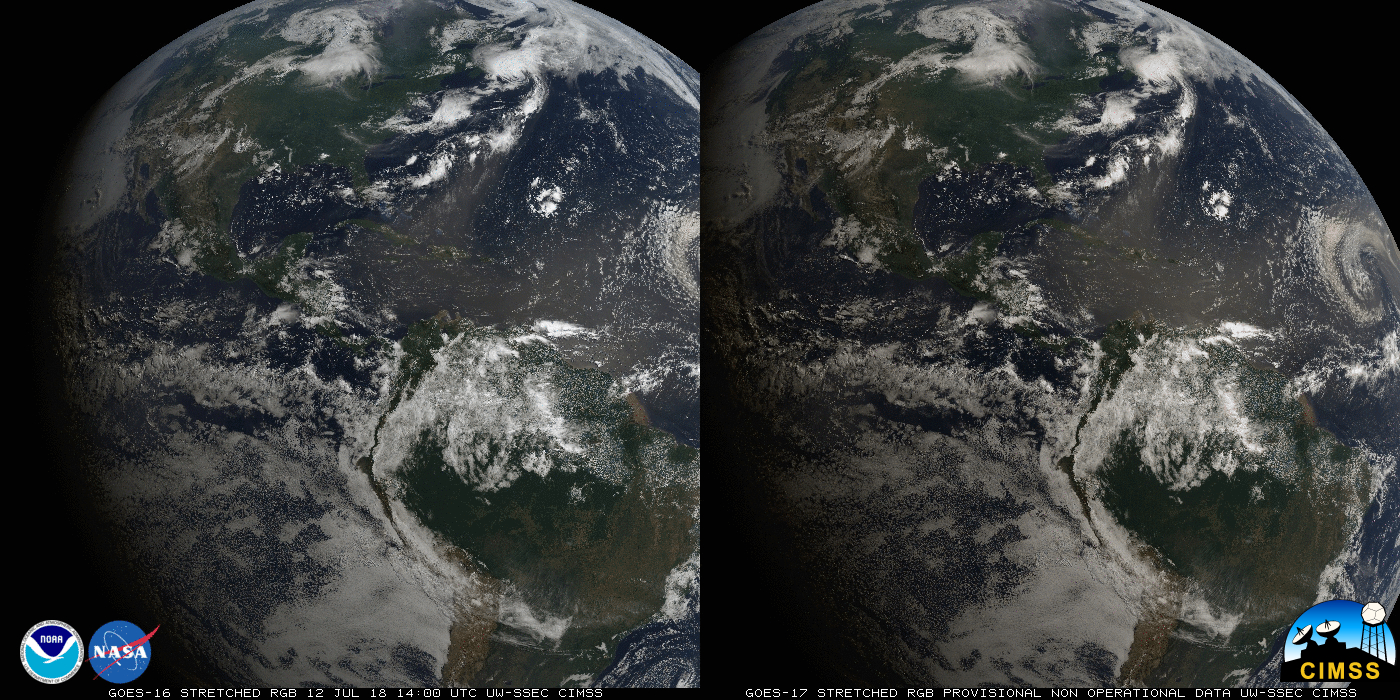
GOES-15 (GOES-West) Visible (0.63 µm) and GOES-16 (GOES-East) “Red” Visible (0.64 µm) images — displayed in the native projection of each satellite, and centered on Las Vegas, Nevada — are shown above, depicting the development of deep convection across parts of the Desert Southwest on 12 July 2018. While the GOES-15 satellite... Read More
![GOES-15 Visible (0.63 µm, left) and GOES-16 Visible (0.64 µm, right) images [click to play MP4 animation]](https://cimss.ssec.wisc.edu/satellite-blog/wp-content/uploads/sites/5/2018/07/G15_G16_VIS_CA_NV_AZ_MONSOON_12JUL2018_960x640_B12_2018193_223000_0002PANELS_00399.GIF)
GOES-15 Visible (0.63 µm, left) and GOES-16 “Red” Visible (0.64 µm, right) images [click to play MP4 animation]
GOES-15
(GOES-West) Visible (0.63 µm) and GOES-16
(GOES-East) “Red” Visible (0.64 µm) images — displayed in the native projection of each satellite, and centered on Las Vegas, Nevada — are shown above, depicting the development of deep convection across parts of the Desert Southwest on
12 July 2018. While the GOES-15 satellite was in Rapid Scan Operations mode
(providing 2 extra images nearly every hour, at :11 and :41), a GOES-16
Mesoscale Sector was providing images at 1-minute intervals. Numerous
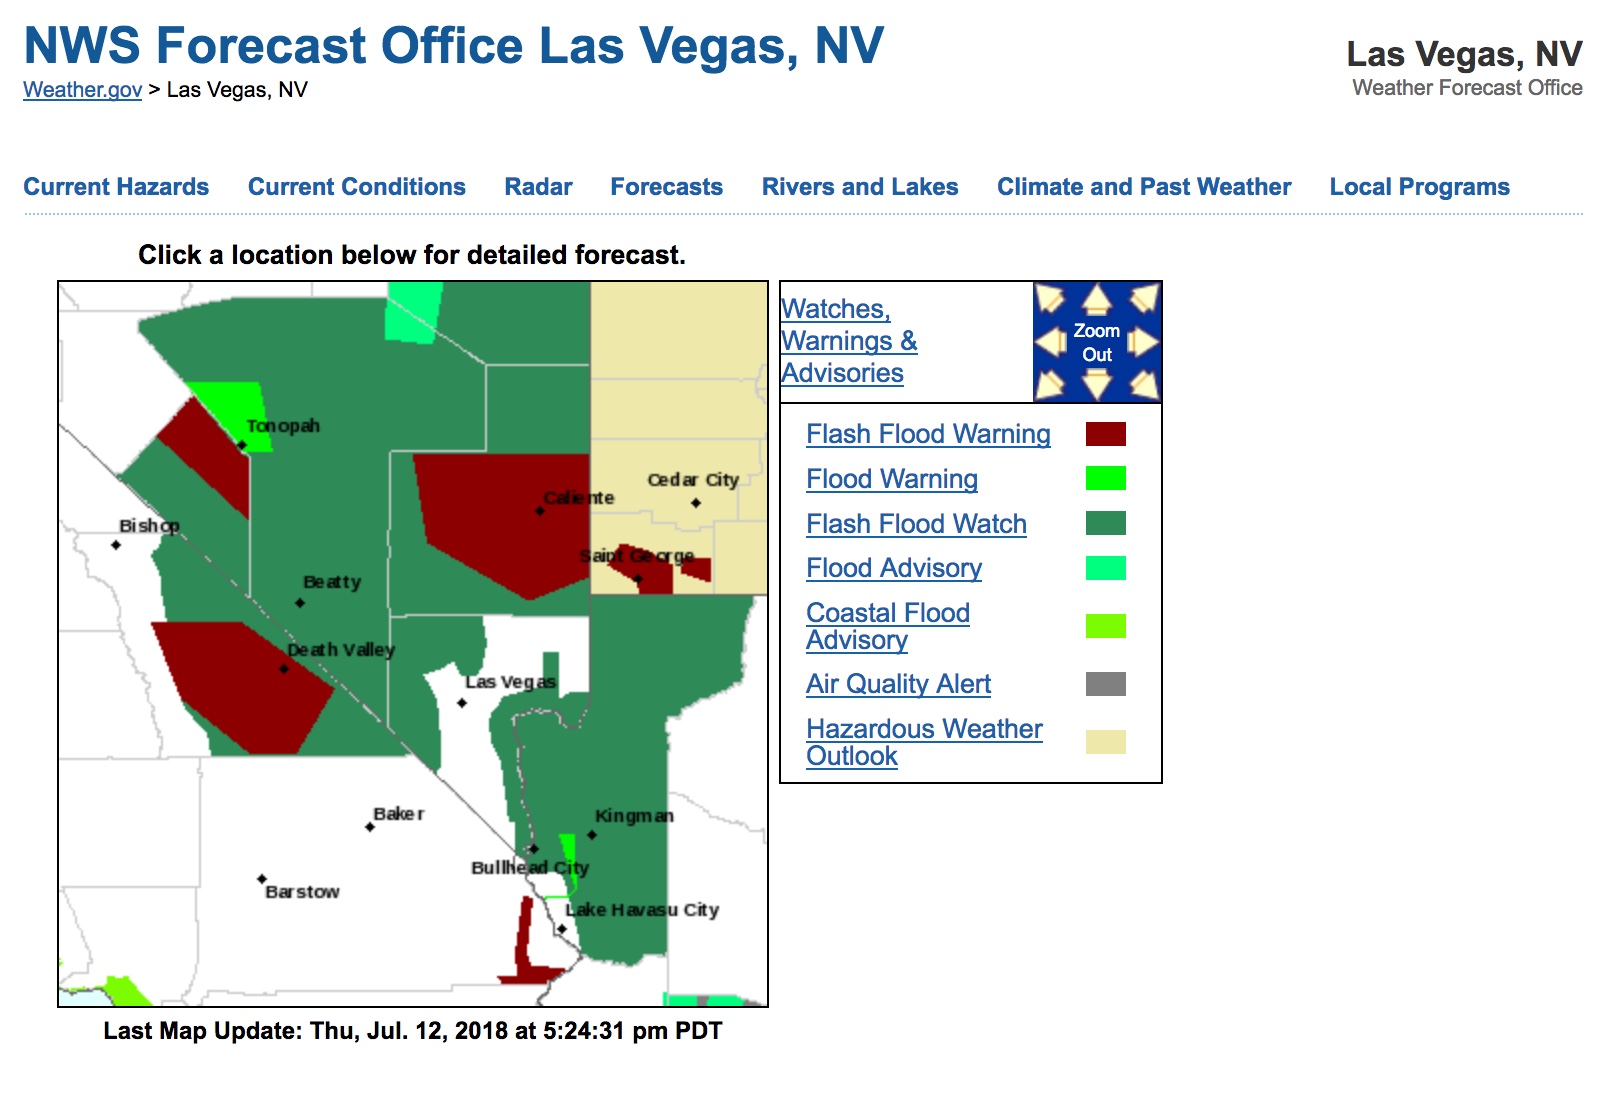
flash flood watches, warnings and advisories were issued by
NWS Las Vegas during the course of the day as some of the storms produced heavy rainfall (with as much as
0.75 inch at Cal Nev Ari and
0.61 inch at Needles, California KEED).
Note that the GOES-15 Visible images do not appear as bright as those from GOES-16 — prior to the GOES-R Series of satellites, the performance of visible detectors degraded over time, leading to imagery that appeared more dim as the Imager instrument aged. Visible detectors on the new ABI instrument benefit from on-orbit calibration to remedy this type of degradation.
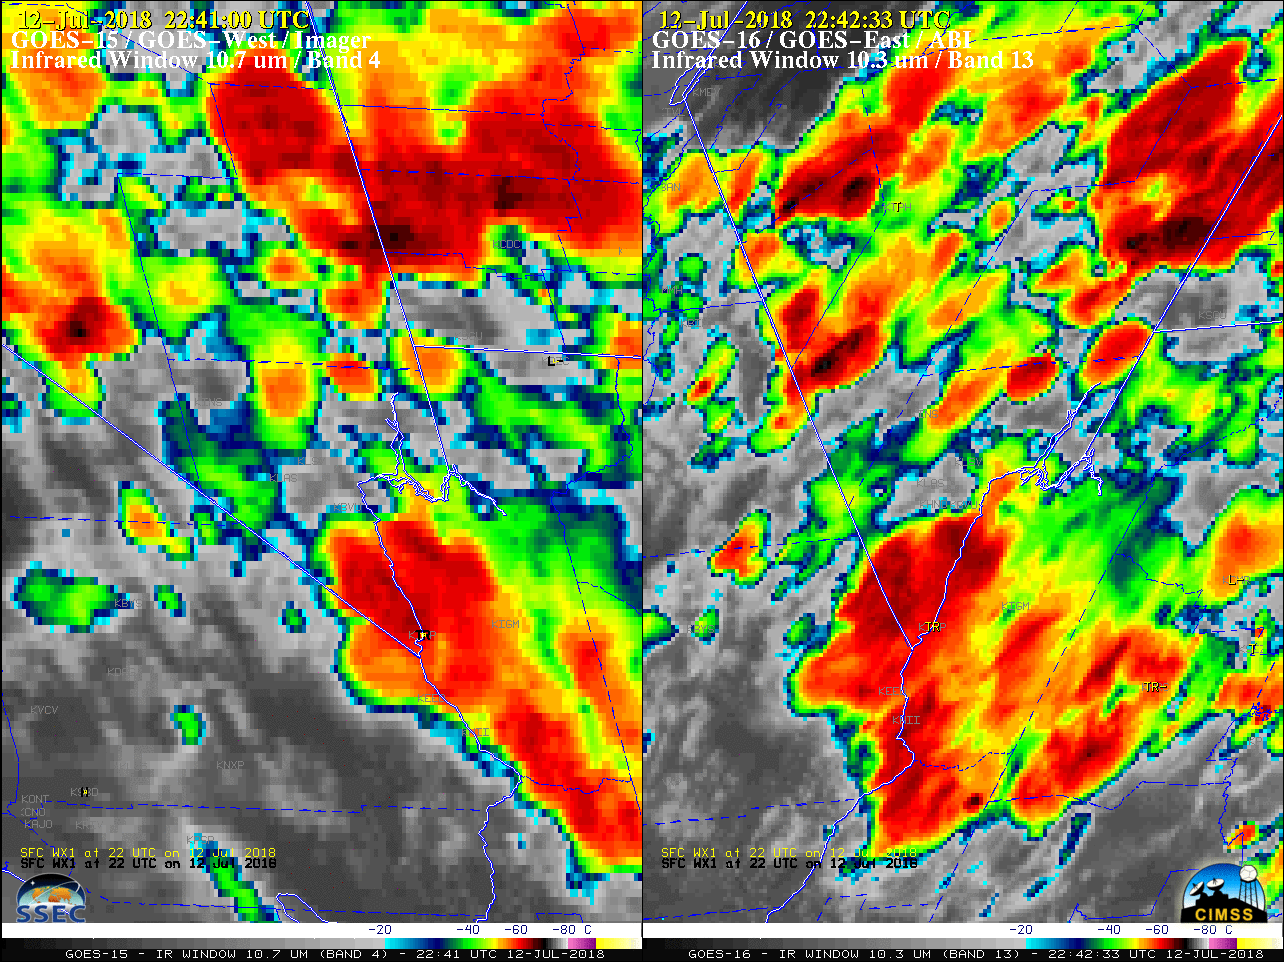
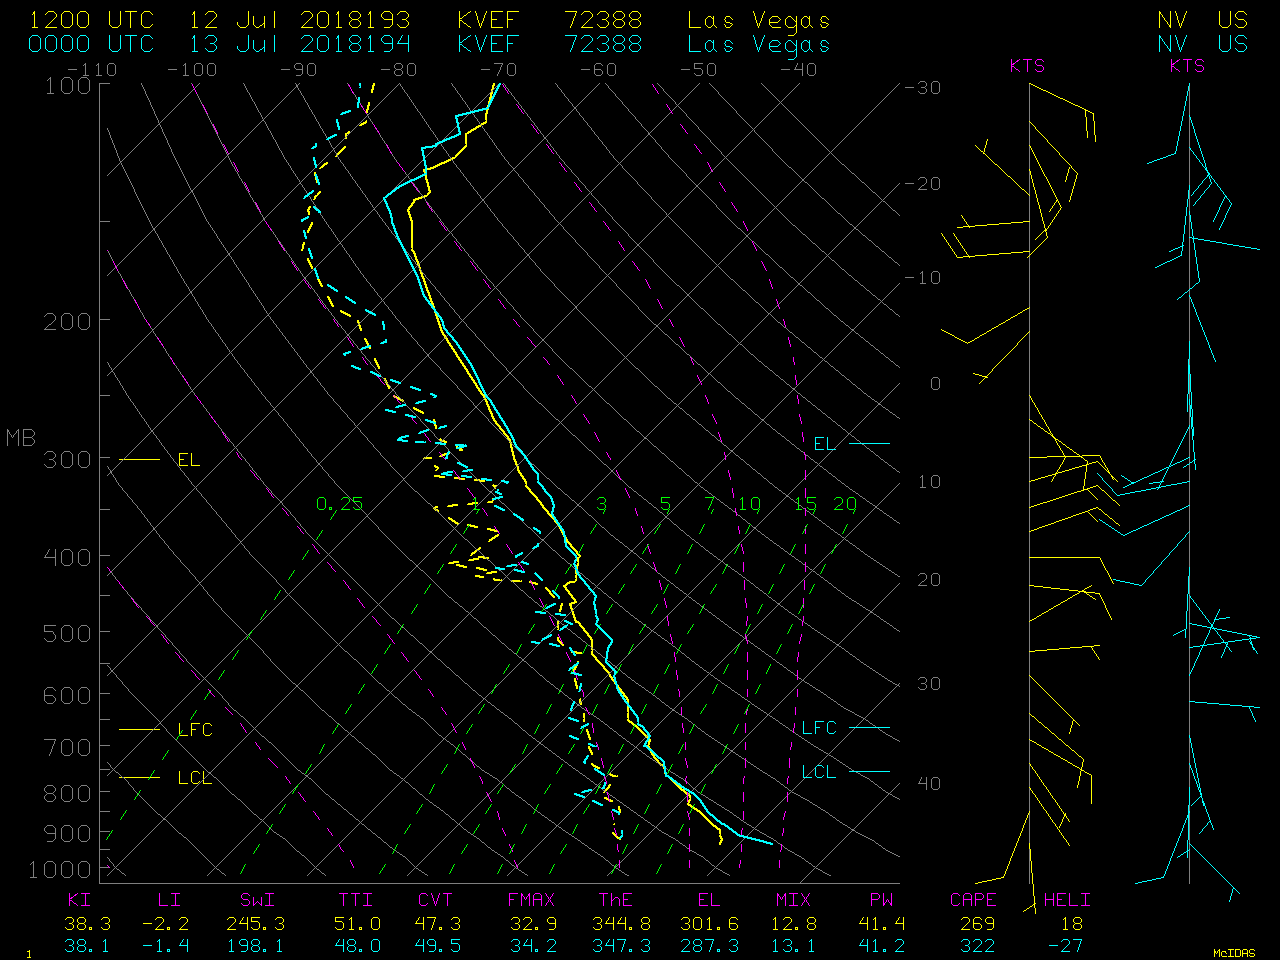
The corresponding GOES-15 Infrared Window (10.7 µm) and GOES-16 “Clean” Infrared Window (10.3 µm) images (below) revealed cloud-top infrared brightness temperatures around -70ºC (black enhancement) associated with some the stronger thunderstorms; this was the tropopause temperature at an altitude of 16.7 km / 48,300 feet on 00 UTC Las Vegas rawinsonde data. The improvement in spatial resolution from 4 km (at satellite sub-point) with GOES-15 to 2 km with GOES-16 is very apparent — even though the satellite viewing angle is about 10 degrees higher for GOES-16 than it is for GOES-15.
![GOES-15 Infrared Window (10.7 µm, left) and GOES-16 "Clean" Infrared Window (10.3 µm, right) images [click to play MP4 animation]](https://cimss.ssec.wisc.edu/satellite-blog/wp-content/uploads/sites/5/2018/07/G15_G16_IR_CA_NV_AZ_MONSOON_12JUL2018_960x640_B413_2018193_224100_0002PANELS_00403.GIF)
GOES-15 Infrared Window (10.7 µm, left) and GOES-16 “Clean” Infrared Window (10.3 µm, right) images [click to play MP4 animation]
Higher spatial resolution Infrared Window images from Terra/Aqua MODIS and Suomi NPP VIIRS
(below) revealed a cloud-top infrared brightness temperature as cold as -79ºC in far northwestern Arizona on the 2017 UTC VIIRS image.
![Infrared Window images from Terra/Aqua MODIS (11.0 µm) and Suomi NPP VIIRS (11.45 µm) [click to enlarge]](https://cimss.ssec.wisc.edu/satellite-blog/wp-content/uploads/sites/5/2018/07/180712_modis_viirs_infrared_LAS_monsoon_anim.gif)
Infrared Window images from Terra/Aqua MODIS (11.0 µm) and Suomi NPP VIIRS (11.45 µm) [click to enlarge]
In addition to heavy rainfall, some thunderstorm winds created areas of blowing sand:
The GOES-16 Total Precipitable Water derived product (below) showed that rich moisture was present across the Desert Southwest, fueling the development of the widespread convection. TPW values in the 1.0 to 2.0 inch range were seen over southeastern California, southwestern Arizona and far southern Nevada.
![GOES-16 Total Precipitable Water derived product [click to play MP4 animation]](https://cimss.ssec.wisc.edu/satellite-blog/wp-content/uploads/sites/5/2018/07/SW_US_monsoon_tpw-20180712_161725.png)
GOES-16 Total Precipitable Water derived product [click to play MP4 animation]
A 4-km resolution Terra/Aqua MODIS Total Precipitable Water product
(below) indicated values in the 40-55 mm or 1.6-2.2 inch range.
![Terra/Aqua MODIS Total Precipitable Water product [click to enlarge]](https://cimss.ssec.wisc.edu/satellite-blog/wp-content/uploads/sites/5/2018/07/180712_modis_tpw_LAS_monsoon_anim.gif)
Terra/Aqua MODIS Total Precipitable Water product [click to enlarge]
View only this post
Read Less

![GOES-16 Visible (0.64 µm) image, with contours of Deep-Layer Wind Shear [click to enlarge]](https://cimss.ssec.wisc.edu/satellite-blog/wp-content/uploads/sites/5/2018/07/180713_19utc_vis_shear_ex_Beryl.jpeg)

