
The mesoscale convective vortex (thunderstorm complex) from Arizona overnight is evident a small eye on visible satellite and large mass of debris clouds over #socal in addition to the morning dust layer in the Coachella Valley #cawx #Monsoon2018 pic.twitter.com/VE3QB6iKfh
— NWS San Diego (@NWSSanDiego) July 9, 2018
As mentioned by NWS San Diego, monsoon thunderstorms that developed over Arizona spawned a small Mesoscale Convective Vortex (MCV). The animation below shows nighttime GOES-16 (GOES-East) “Clean” Infrared Window (10.3 µm) images, followed by daytime GOES-16 “Red” Visible (0.64 µm) images — the center of the MCV circulation briefly exhibited an “eye-like” appearance just after 16 UTC (south of the California/Mexico border).
GOES-16 “Clean” Infrared Window (10.3 µm) and “Red” Visible (0.64 µm) images, with hourly plots of surface reports [click to play MP4 animation]
![NOAA-19 AVHRR Infrared Window (10.8 µm) image [click to enlarge]](https://cimss.ssec.wisc.edu/satellite-blog/wp-content/uploads/sites/5/2018/07/180709_N19_IR_MCV.GIF)
NOAA-19 AVHRR Infrared Window (10.8 µm) image [click to enlarge]
![NOAA-15 and NOAA-18 Visible (0.63 µm) images [click to enlarge]](https://cimss.ssec.wisc.edu/satellite-blog/wp-content/uploads/sites/5/2018/07/180709_poes_avhrr_visible_mcv_anim.gif)
NOAA-15 and NOAA-18 Visible (0.63 µm) images [click to enlarge]
View only this post Read Less

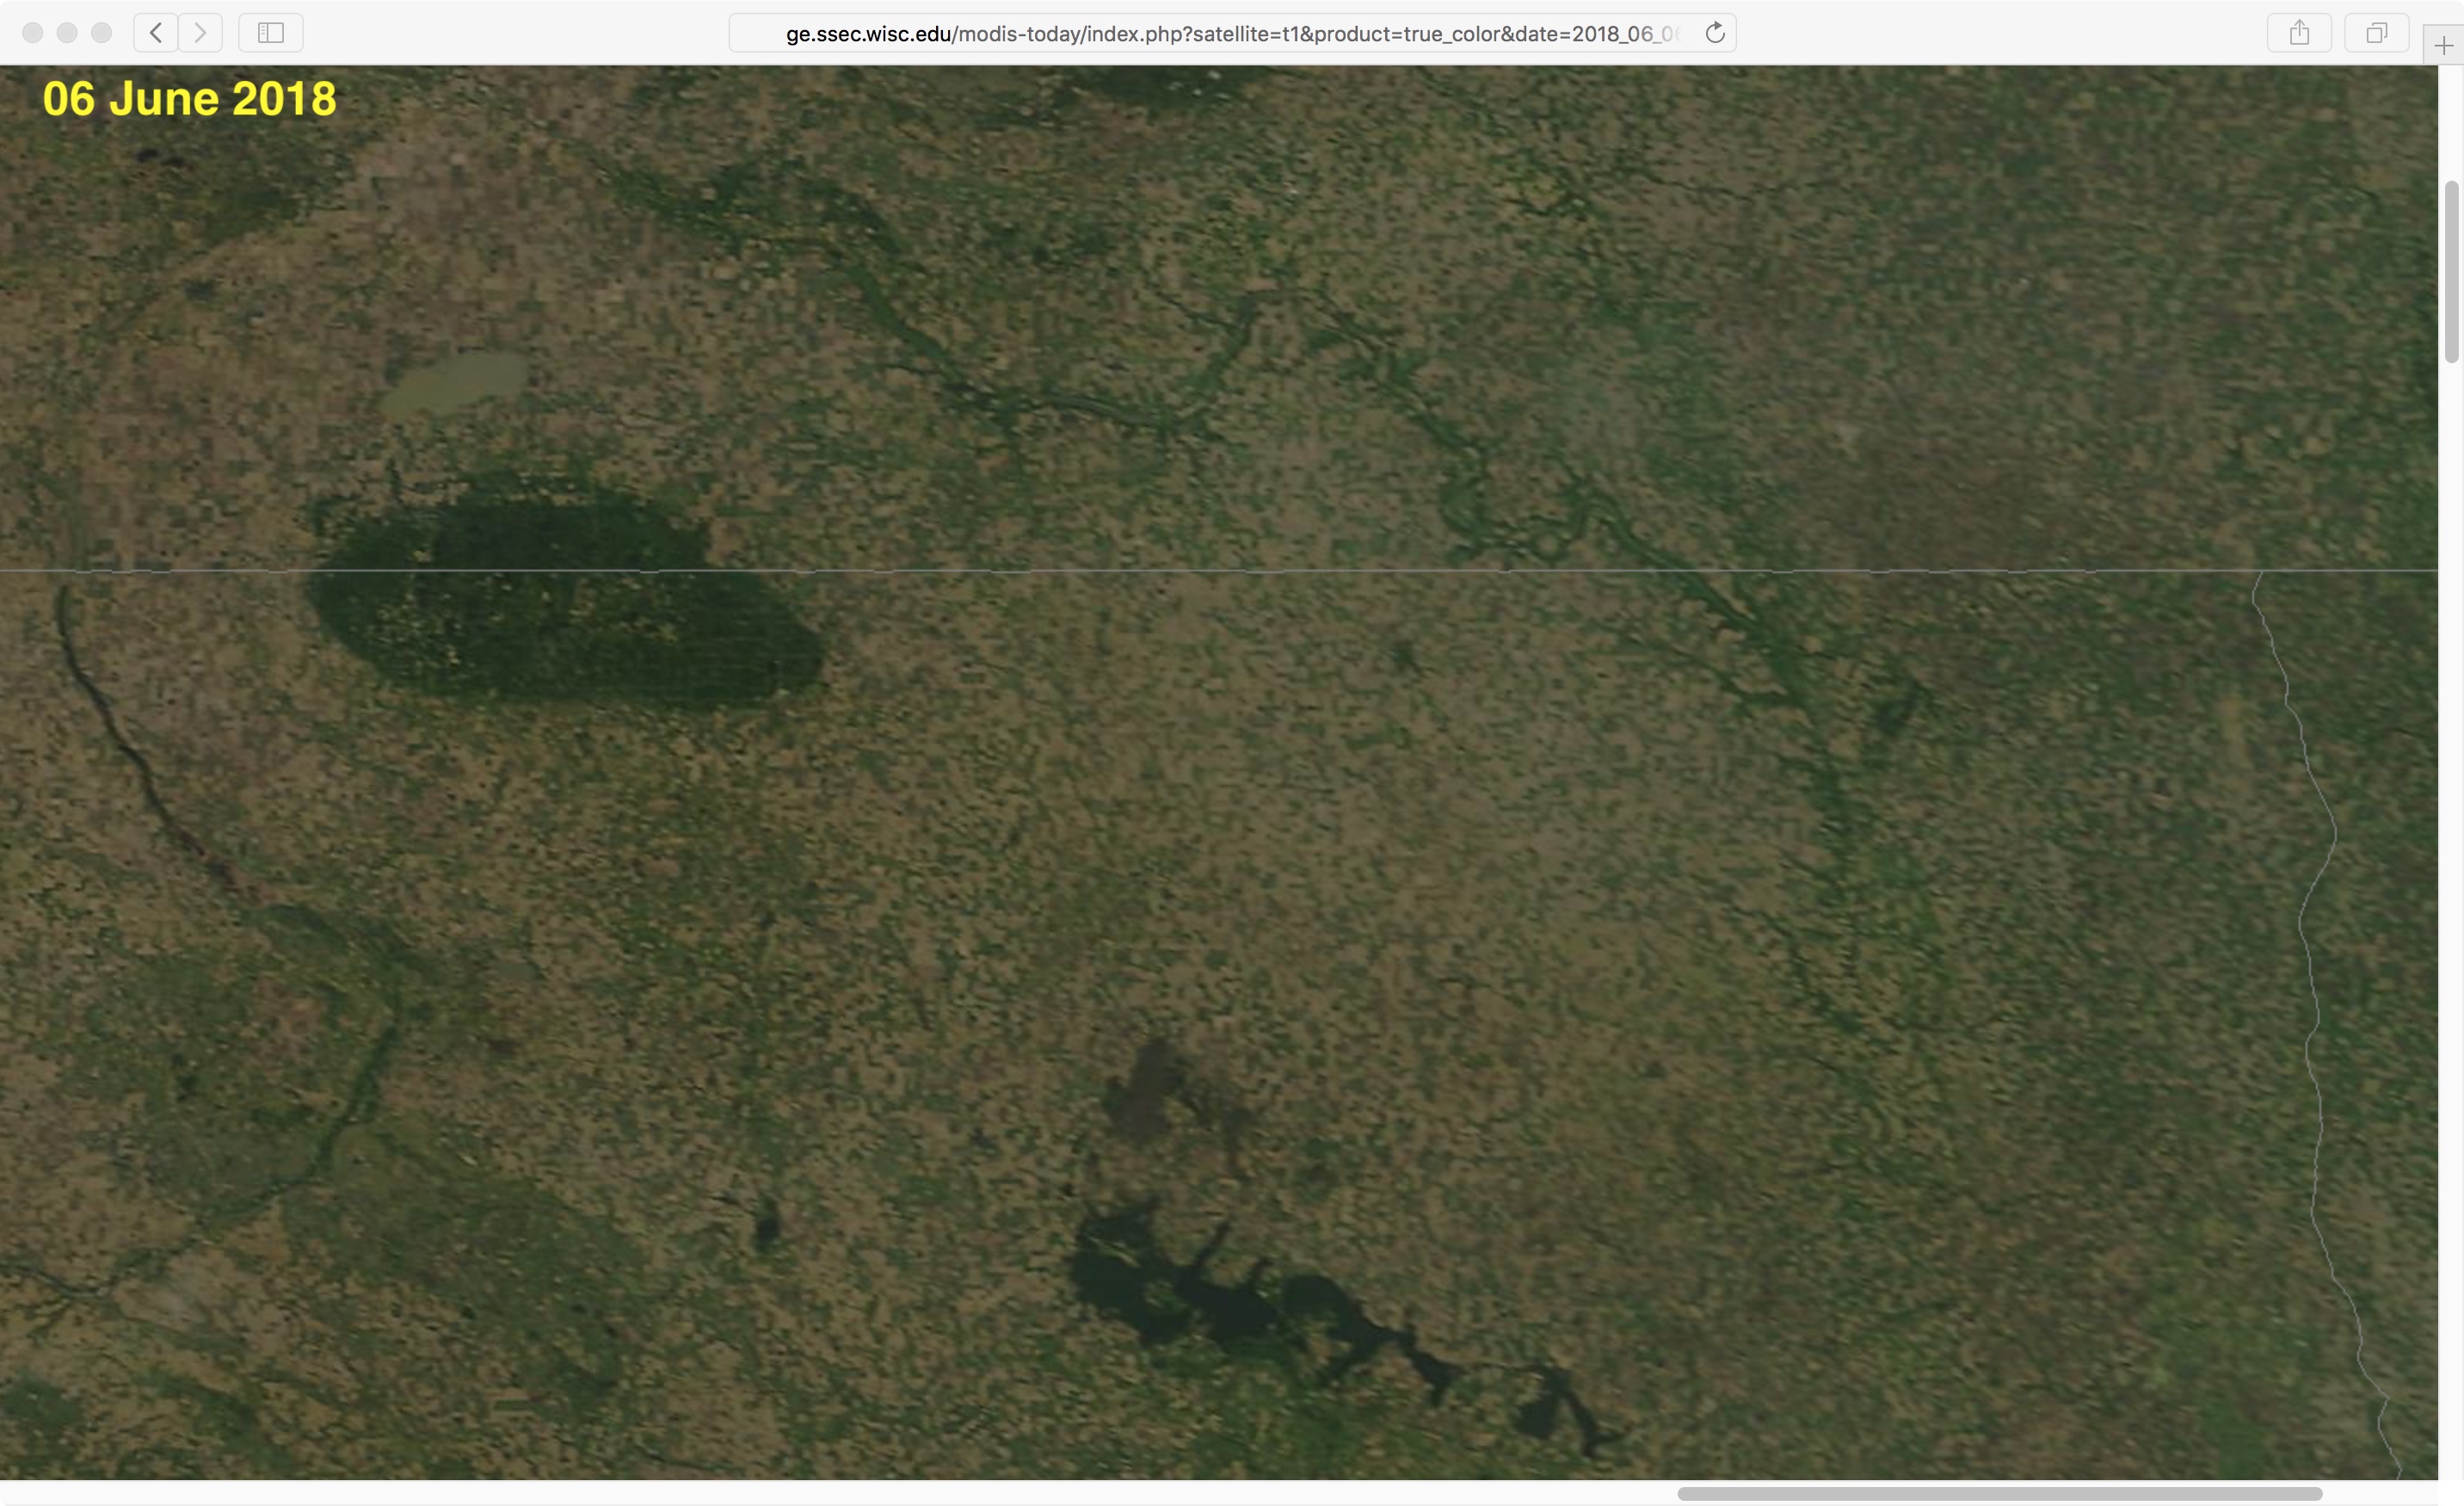
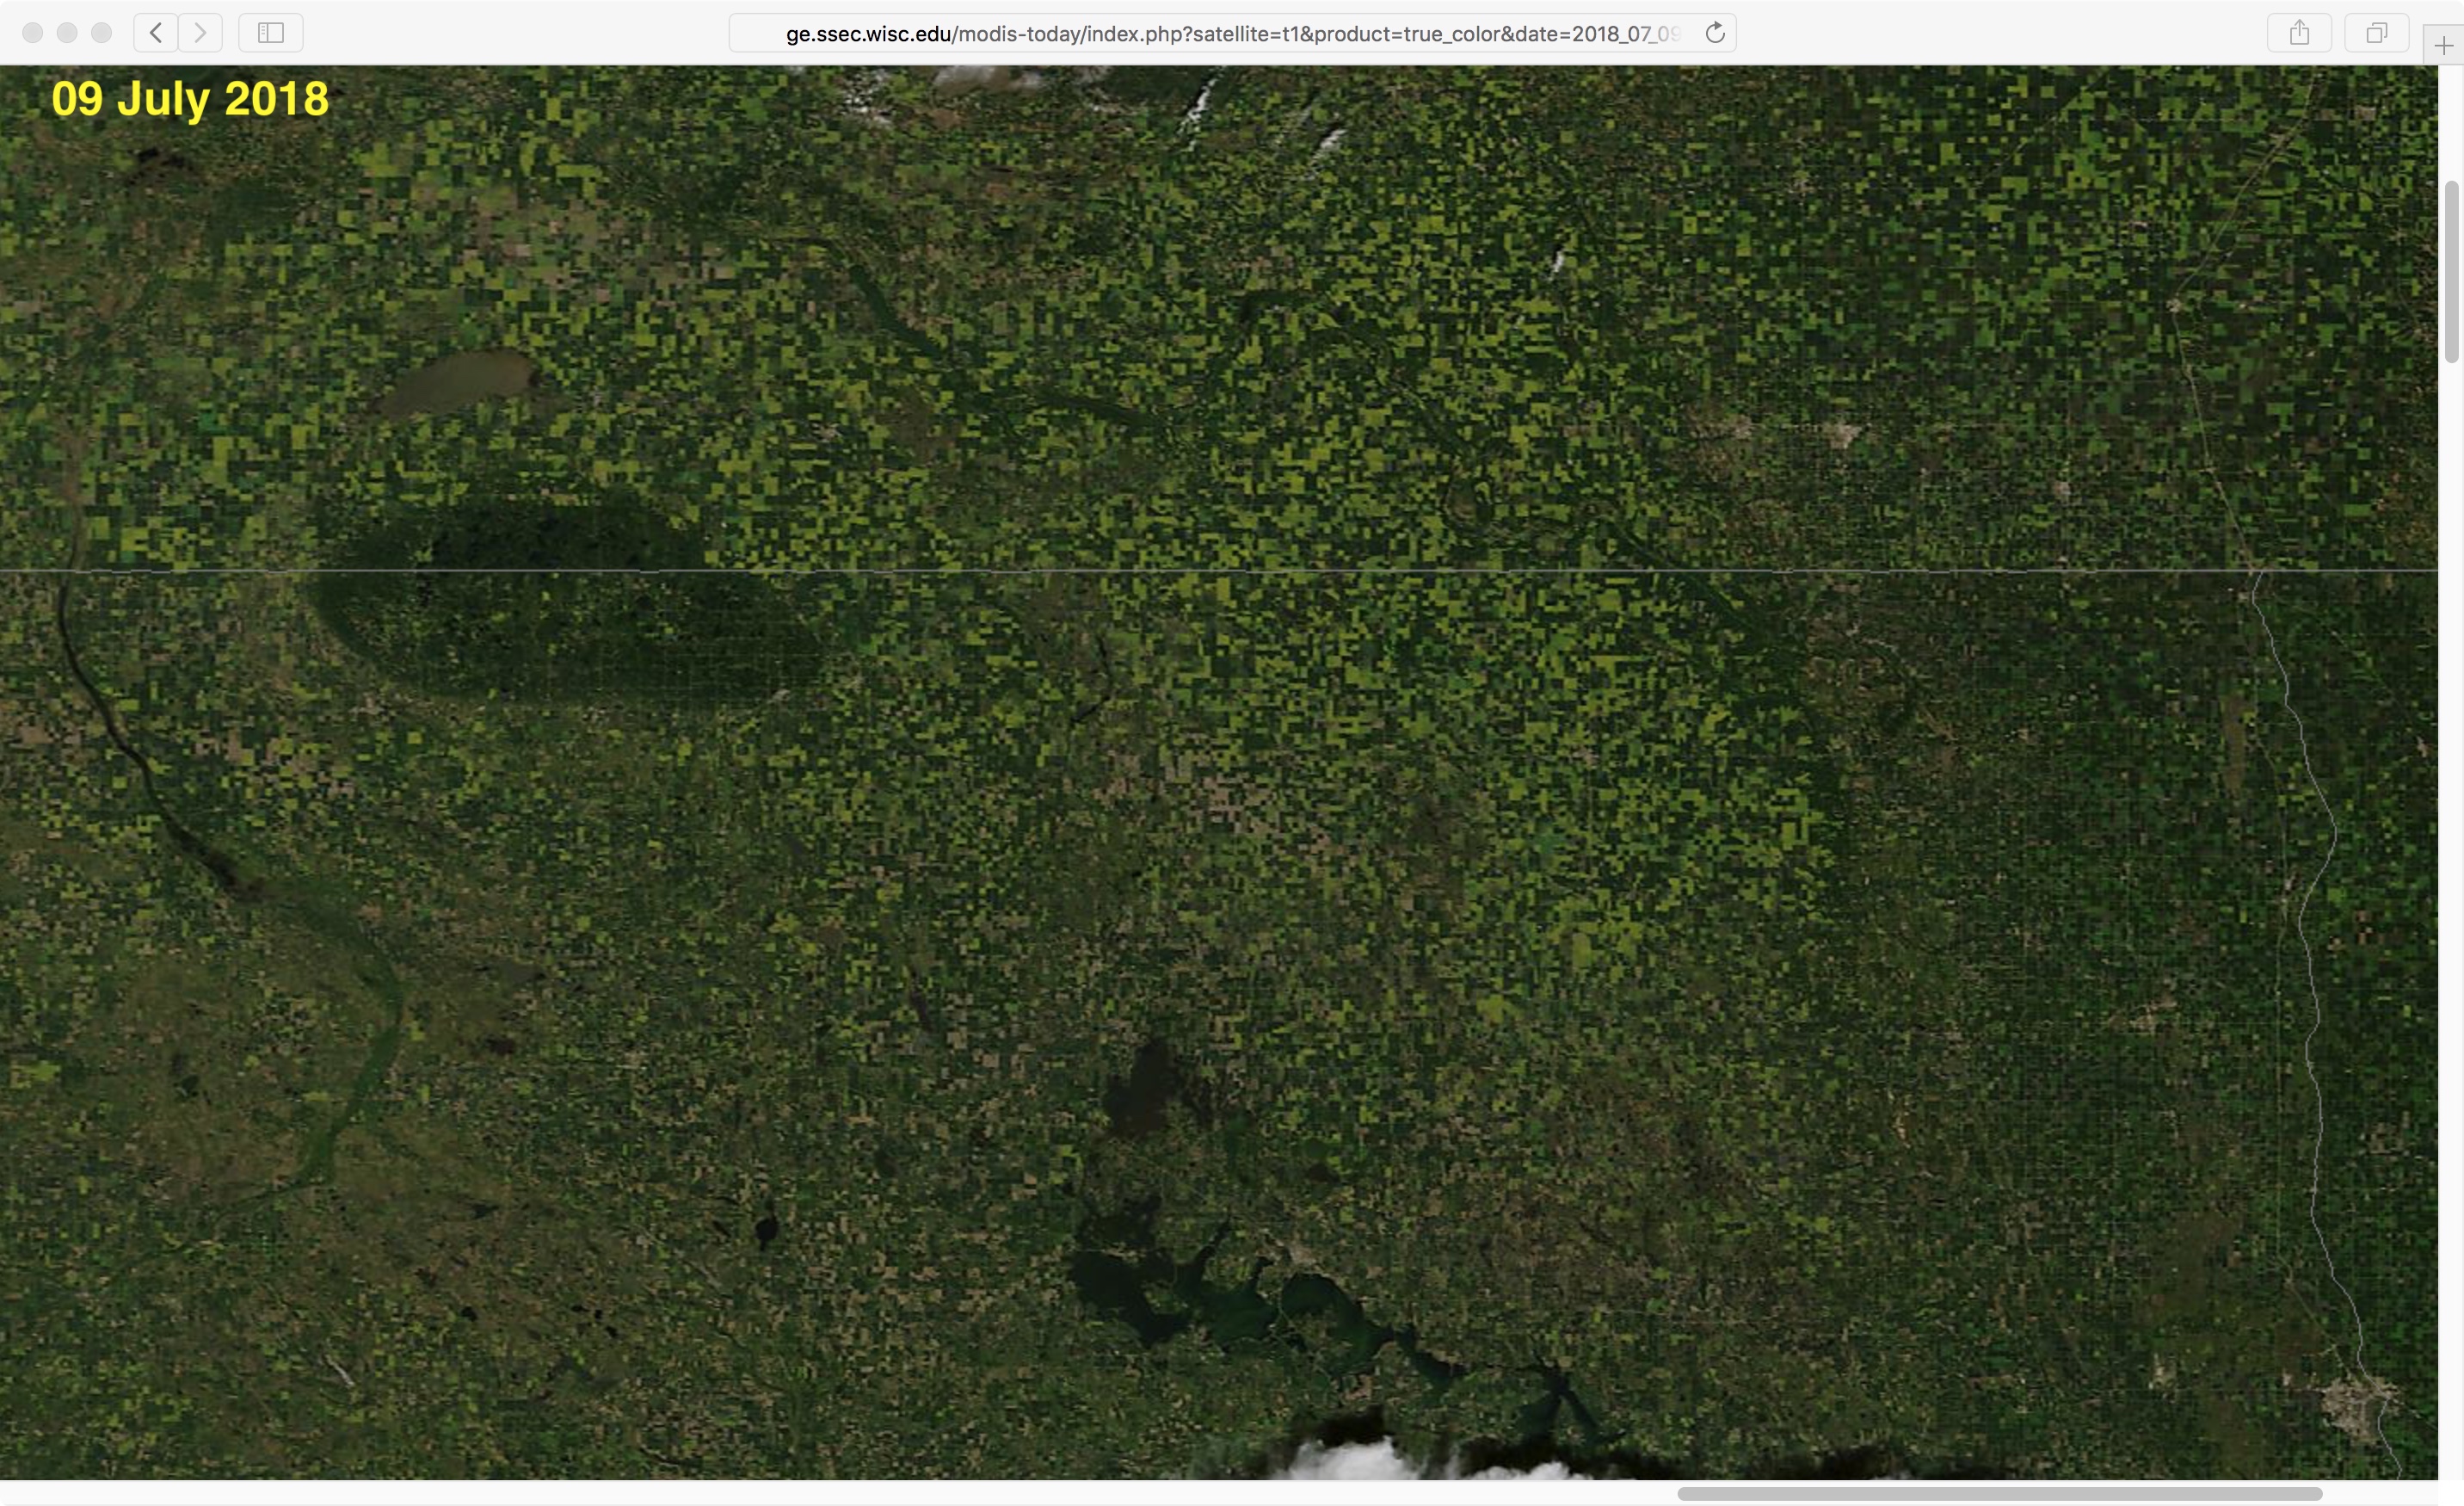
![Terra MODIS True Color RGB images on 06 June, 05 July and 09 July 2018 [click to enlarge]](https://cimss.ssec.wisc.edu/satellite-blog/wp-content/uploads/sites/5/2018/07/1806_1807_terra_modis_truecolor_ND_MB_anim.gif)

