This website works best with a newer web browser such as Chrome, Firefox, Safari or Microsoft
Edge. Internet Explorer is not supported by this website.
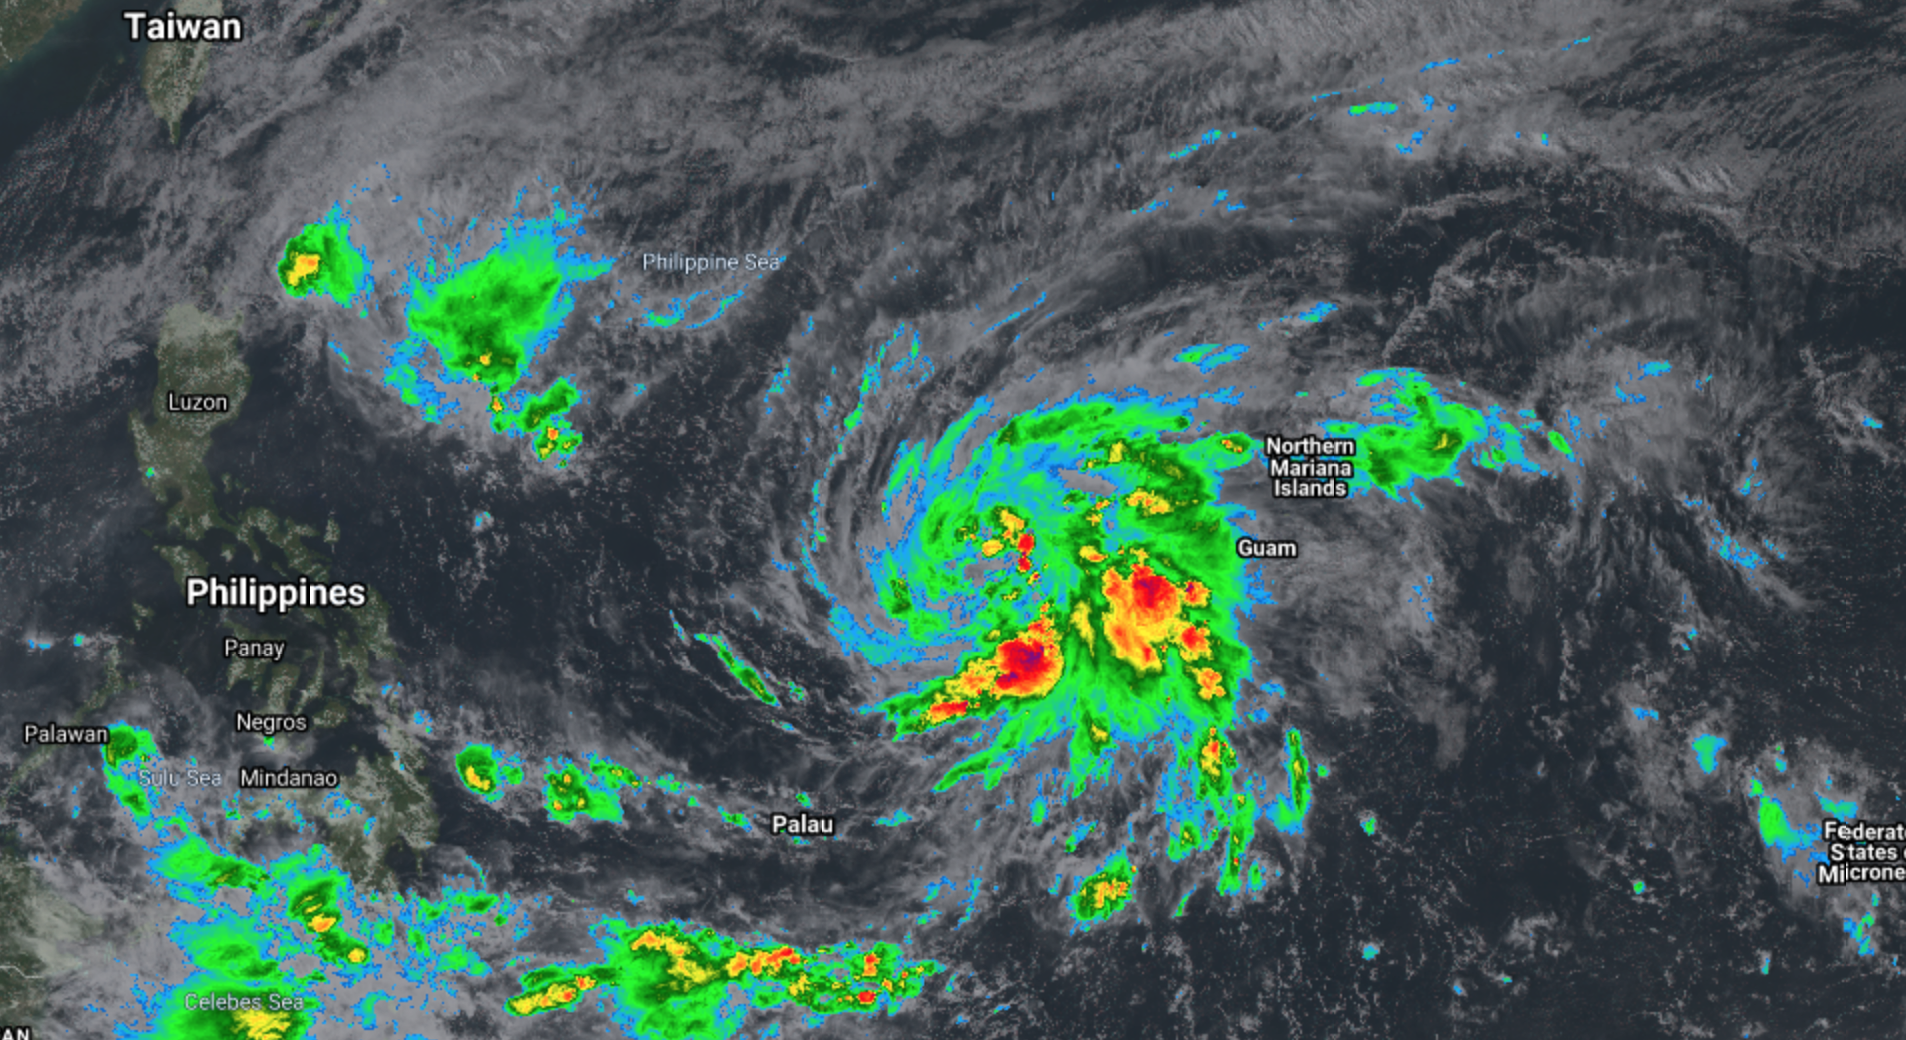
A tropical depression in the Philippine Sea has developed into Tropical Storm ‘Nyatoh’. The system is currently moving northwestward. Once it enters the Philippine Area of Responsibility (PAR), it will likely exit the area within 24 hours. Forecasters have predicted the storm will strengthen quickly, but its track will not... Read More
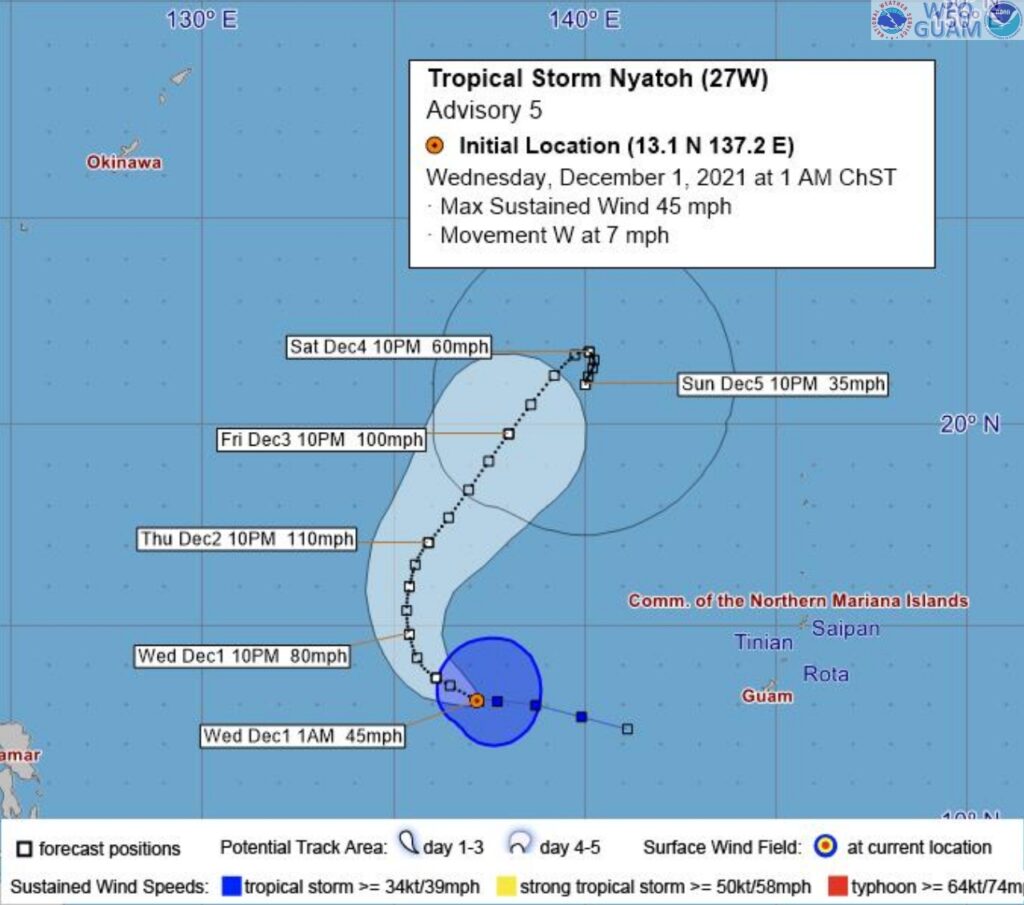
A tropical depression in the Philippine Sea has developed into Tropical Storm ‘Nyatoh’. The system is currently moving northwestward. Once it enters the Philippine Area of Responsibility (PAR), it will likely exit the area within 24 hours. Forecasters have predicted the storm will strengthen quickly, but its track will not pass over the Philippine islands. A Tropical Cyclone Advisory has already been issued by the NWS office in Guam.
The Himawari-8 satellite houses the Advanced Himawari Imager (AHI) that provides full disk geostationary data at a high temporal resolution, similar to the GOES-16/17 ABI. AHI’s domain is perfect for monitoring storms such as Nyatoh.
A composite of AHI true color and infrared imagery is shown, with the SSEC IR rain rate superimposed on top. Imagery is shown from 11-29-2021 at 22UTC to 11-30-2021 at 18UTC using RealEarth, a free data visualization web tool.
Tropical storm Nyatoh is currently moving northwestward but may change to move northeastward by December 2.
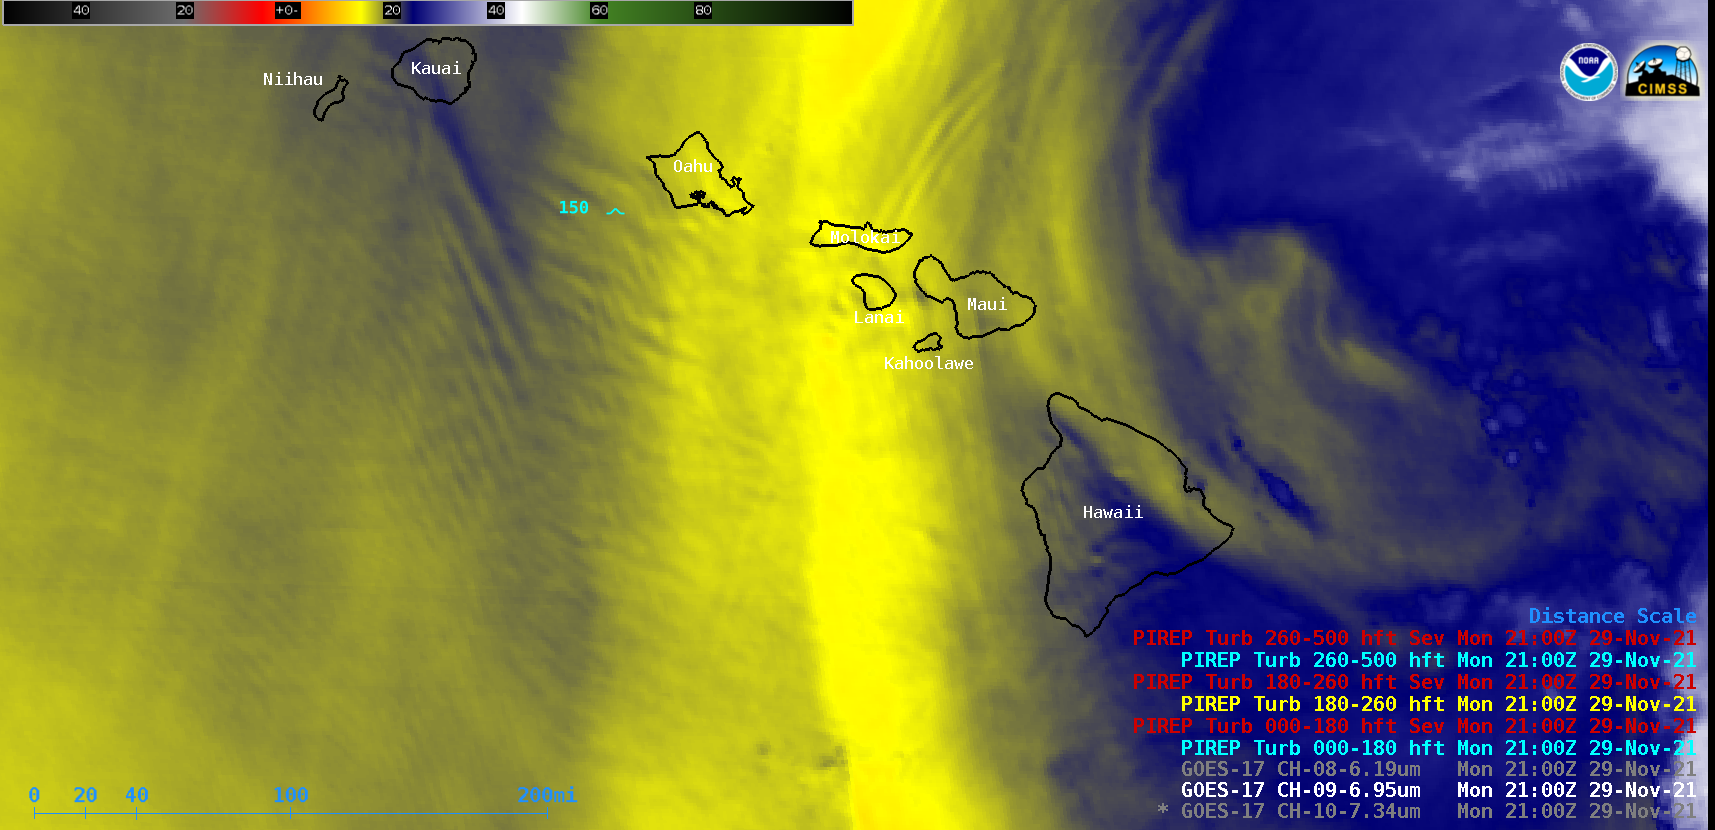
As a compact but anomalously-deep middle/upper-tropospheric low approached Hawai’i on 29 November 2021, GOES-17 (GOES-West) Low-level (7.3 µm), Mid-level (6.9 µm) and Upper-level (6.2 µm) Water Vapor images (above) showed complex lee wave structures southwest of the island chain. There were a few pilot reports of moderate turbulence in the general vicinity of... Read More
GOES-17 Low-level (7.3 µm), Mid-level (6.9 µm) and Upper-level (6.2 µm) Water Vapor images, with pilot reports of turbulence plotted in cyan [click to play animation | MP4]
As a compact but anomalously-deep middle/upper-tropospheric low approached Hawai’i on 29 November 2021, GOES-17 (GOES-West) Low-level (7.3 µm), Mid-level (6.9 µm) and Upper-level (6.2 µm) Water Vapor images (above) showed complex lee wave structures southwest of the island chain. There were a few pilot reports of moderate turbulence in the general vicinity of these waves.
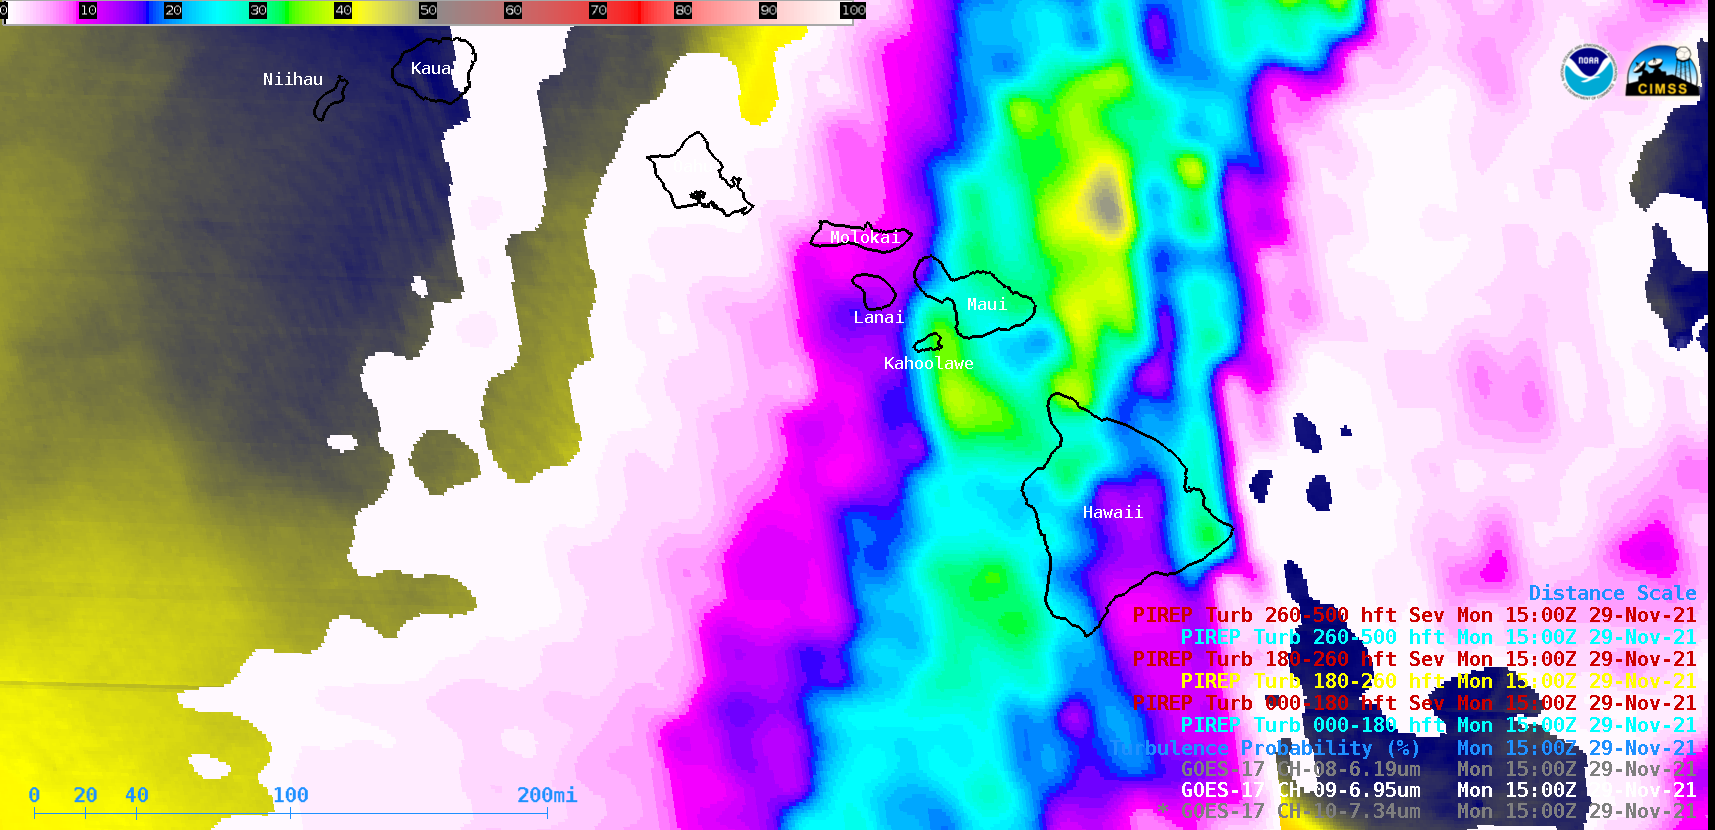
Even though 250 hPa wind speeds along the western side of the upper-level low were relatively light (30-60 knots), those north-northeasterly upper-tropospheric wind speeds were higher than normal for Hawai’i during the end of November. A Turbulence Probability product (below) indicated that the risk for Moderate or Greater (MOG) turbulence was generally low (less than 50%), and focused along the dry slot near the axis of the 250 hPa jet streak. Note that the Turbulence Probability began to decrease later in the period, as those 250 hPa jet streak winds began to relax over the area.
GOES-17 Mid-level (6.9 µm) Water Vapor images, with an overlay of Turbulence Probability after 1300 UTC [click to play animated GIF | MP4]
Training for this Turbulence Probability product is available here and here.
GOES-16 True-Color imagery from the CSPP Geosphere site (link showing the data above) on 26 November, above, show features associated with strong flow through Chivela Pass in southern Mexico, gap winds often called Tehuano winds or Tehuantepecers. Strong descent associated with these events can often limit the presence of clouds that... Read More
GOES-16 True Color imagery, 1330 – 1520 UTC on 26 November 2021
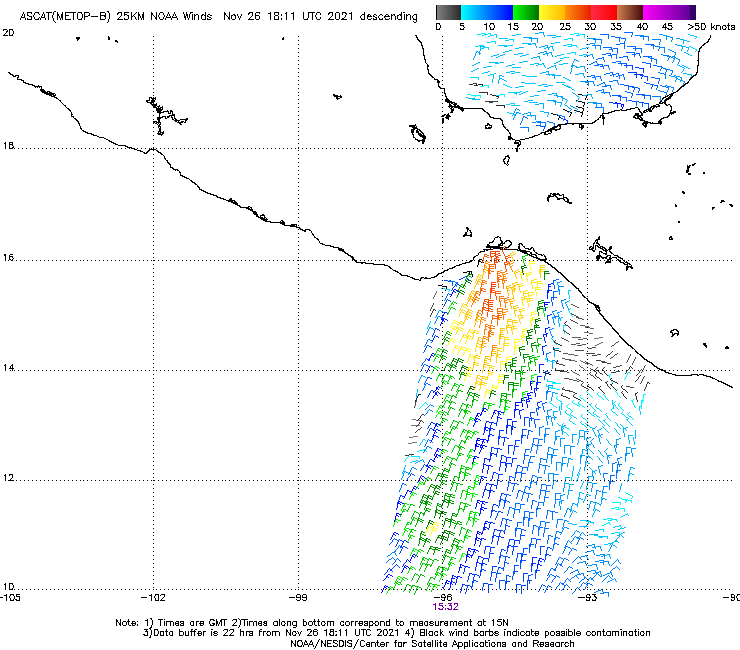
GOES-16 True-Color imagery from the CSPP Geosphere site (link showing the data above) on 26 November, above, show features associated with strong flow through Chivela Pass in southern Mexico, gap winds often called Tehuano winds or Tehuantepecers. Strong descent associated with these events can often limit the presence of clouds that can be used as tracers. However, scatterometry (from this website) will show surface winds, and an MetopB overpass shortly after the end of the animation above, below, shows a core of strong winds over the ocean.
ASCAT Winds from Metop-B, 1532 UTC on 26 November 2021 (Click to enlarge)
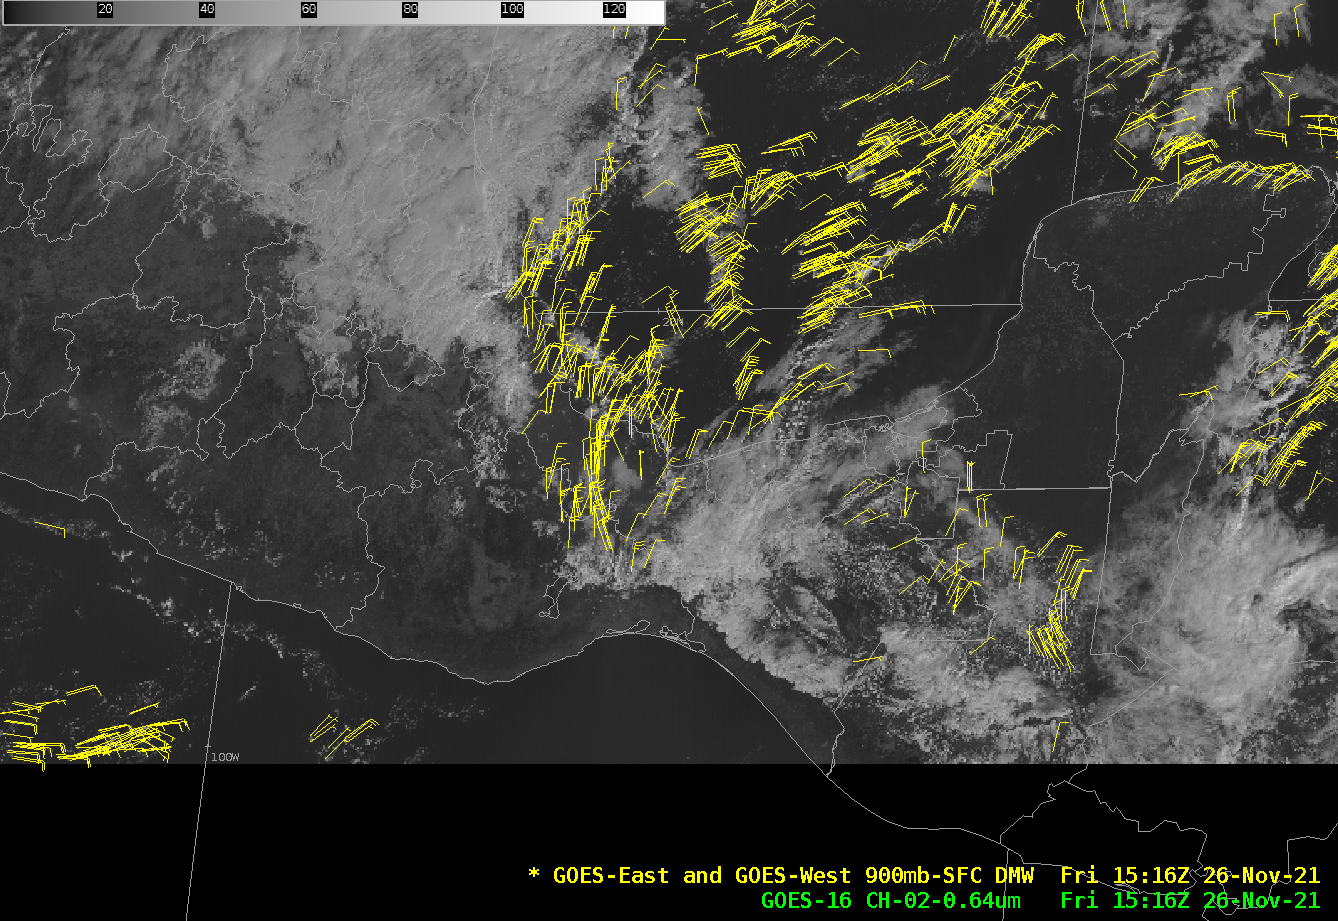
The GOES-16 CONUS domain extends southward to the northern part of the Gulf of Tehuantepec (about 14.6 N Latitude). Visible imagery from 1516 UTC, below, is overlain with the Derived Motion Wind vectors (in the surface – 900 mb layer) at the same time. Strong northerly winds north of Chivela Pass are apparent, but the lack of clouds to track in the Gulf prevented the inference of winds there from the GOES-16 data.
GOES-16 Visible Imagery (Band 2, 0.64 µm) and Derived Motion Winds, surface-900 mb, 1516 UTC 26 November 2021 (Click to enlarge)
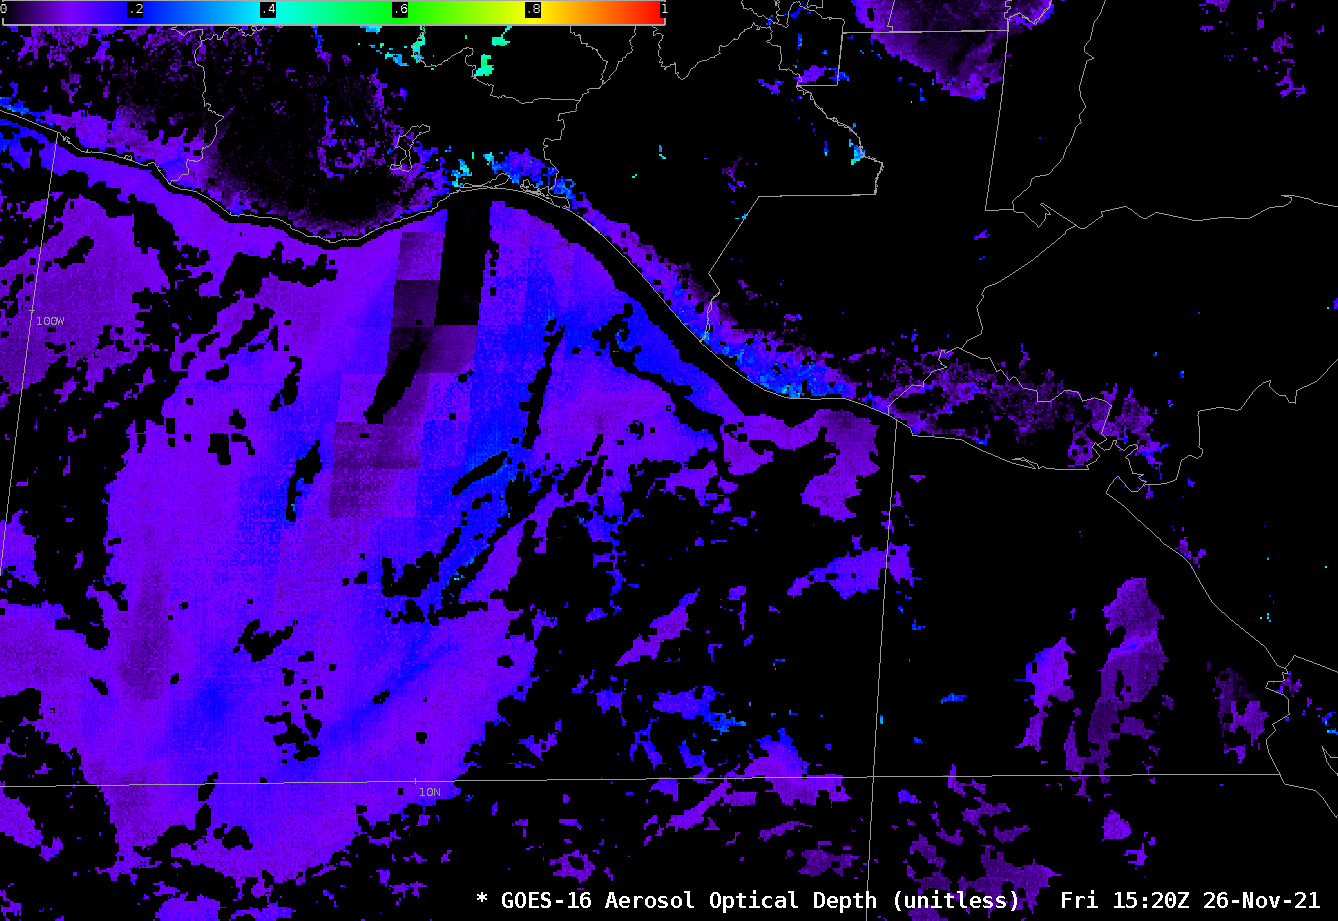
The strong winds are also associated with a local increase in Aerosol Optical Depth (AOD), as shown below.
GOES-16 Aerosol Optical Depth (AOD) at 1520 UTC on 26 November 2021 (click to enlarge)
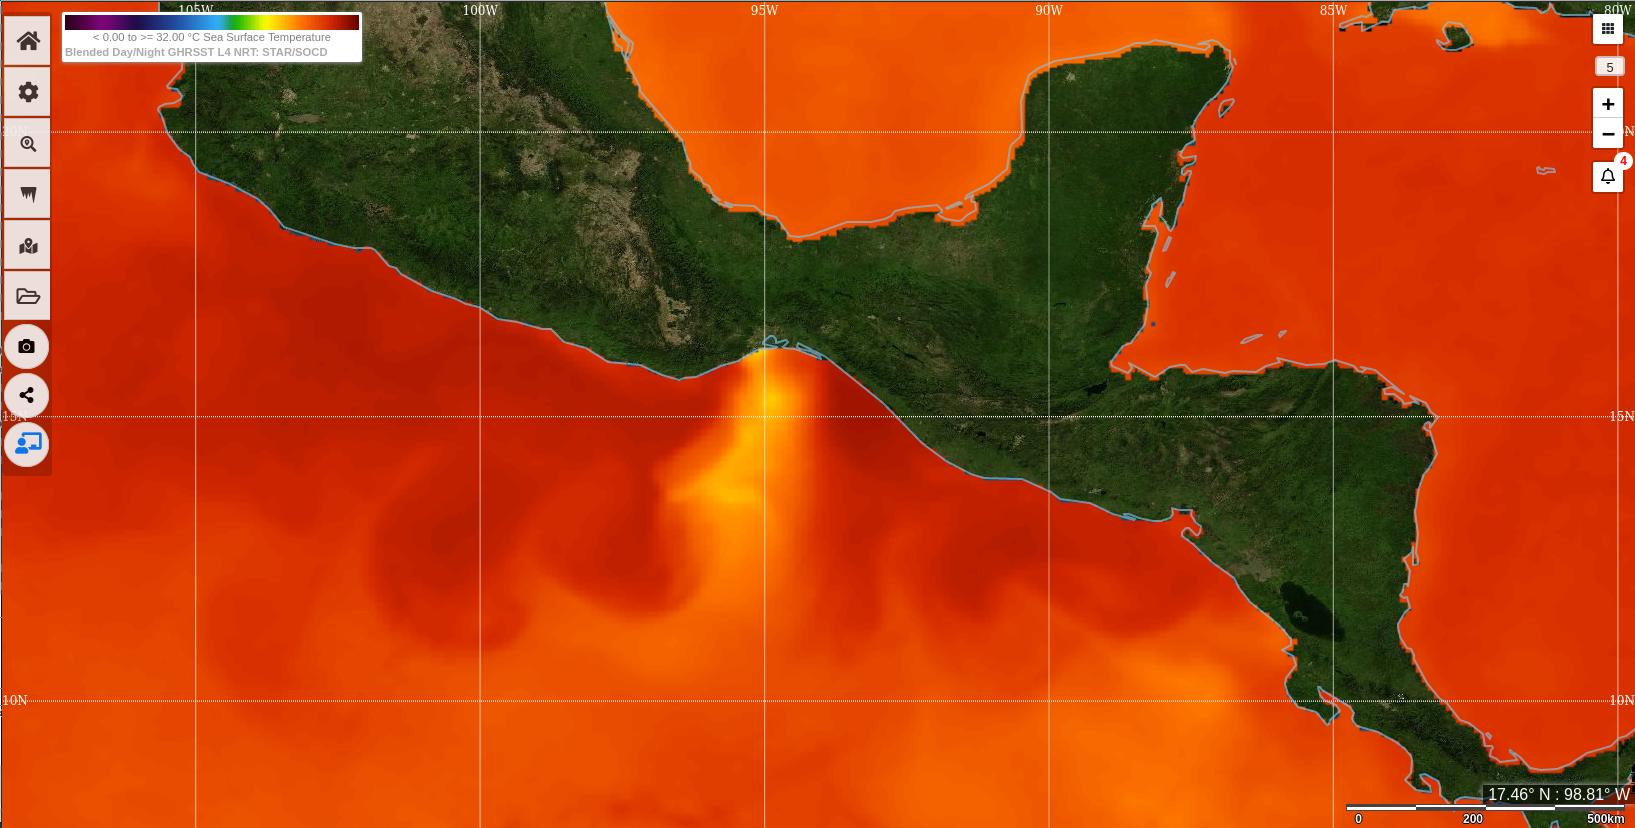
Strong winds will cause significant mixing in the upper part of the ocean, which will result in cooling. Imagery from this website (shown below) shows cooling in the Gulf from previous events. Here is an animation from that website, courtesy Tim Schmit, NOAA/NESDIS/STAR
SST analysis valid at 24 November 2021 (Click to enlarge)
GOES-17 True Color RGB images (credit Scott Bachmeier, CIMSS) [click to play animated GIF | MP4]
In GOES-17 True Color images created using Geo2Grid(above), enhanced forward scattering during the morning hours helped to highlight the offshore transport of airborne dust.
Other blog posts discussing similar Tehuano wind events can be found here.
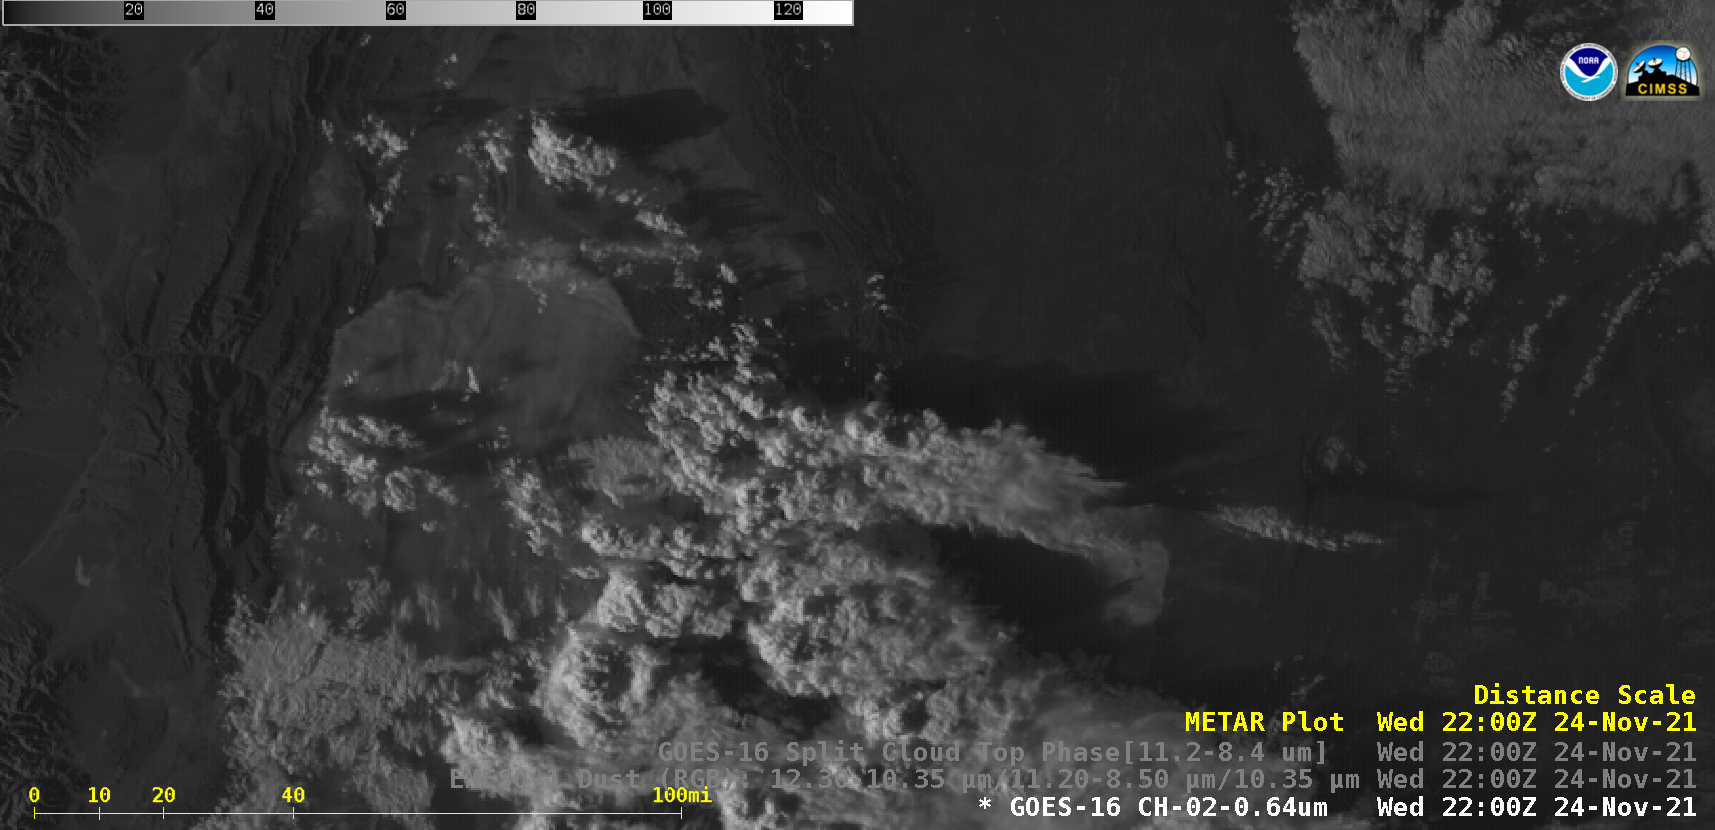
30-second Mesoscale Domain Sector GOES-16 (GOES-East) “Red” Visible (0.64 µm), Dust RGB and Split Cloud Top Phase (11.2 µm – 8.4 µm) brightness temperature difference (BTD) images (above) revealed a plume of blowing dust propagating northward across the San Juan Province of western Argentina late in the day on 24 November 2021. The dust was being channeled through a gap... Read More
GOES-16 “Red” Visible (0.64 µm), Dust RGB and Split Cloud Top Phase (11.2 µm – 8.4 µm) BTD images [click to play animated GIF | MP4]
30-second Mesoscale Domain Sector GOES-16 (GOES-East) “Red” Visible (0.64 µm), Dust RGB and Split Cloud Top Phase (11.2 µm – 8.4 µm) brightness temperature difference (BTD) images (above) revealed a plume of blowing dust propagating northward across the San Juan Province of western Argentina late in the day on 24 November 2021. The dust was being channeled through a gap in higher terrain along the foothills of the Andes (below).
GOES-16 “Red” Visible (0.64 µm) and topography images [click to enlarge]
A larger-scale view of hourly GOES-16 Visible images with plots of surface reports (below) suggested that this dust occurred in the vicinity of a strong cold front that was moving northward across Argentina.
GOES-16 “Red” Visible (0.64 µm) images, with METAR surface reports plotted in cyan [click to enlarge]
Mendoza — located south-southwest of where the dust plume first became apparent in GOES-16 imagery — reported a thunderstorm with dust at 2000 UTC (along with a southeasterly wind gust to 32 knots), followed by a reduction of surface visibility to 0.5 miles at 2215 UTC as the air temperature sharply dropped with the cold frontal passage (below). About 260 miles (420 km) east of Mendoza at Rio Cuarto, a similar sharp temperature drop was seen as the cold front passed.
Time series of surface data at Mendoza, Argentina [click to enlarge]


