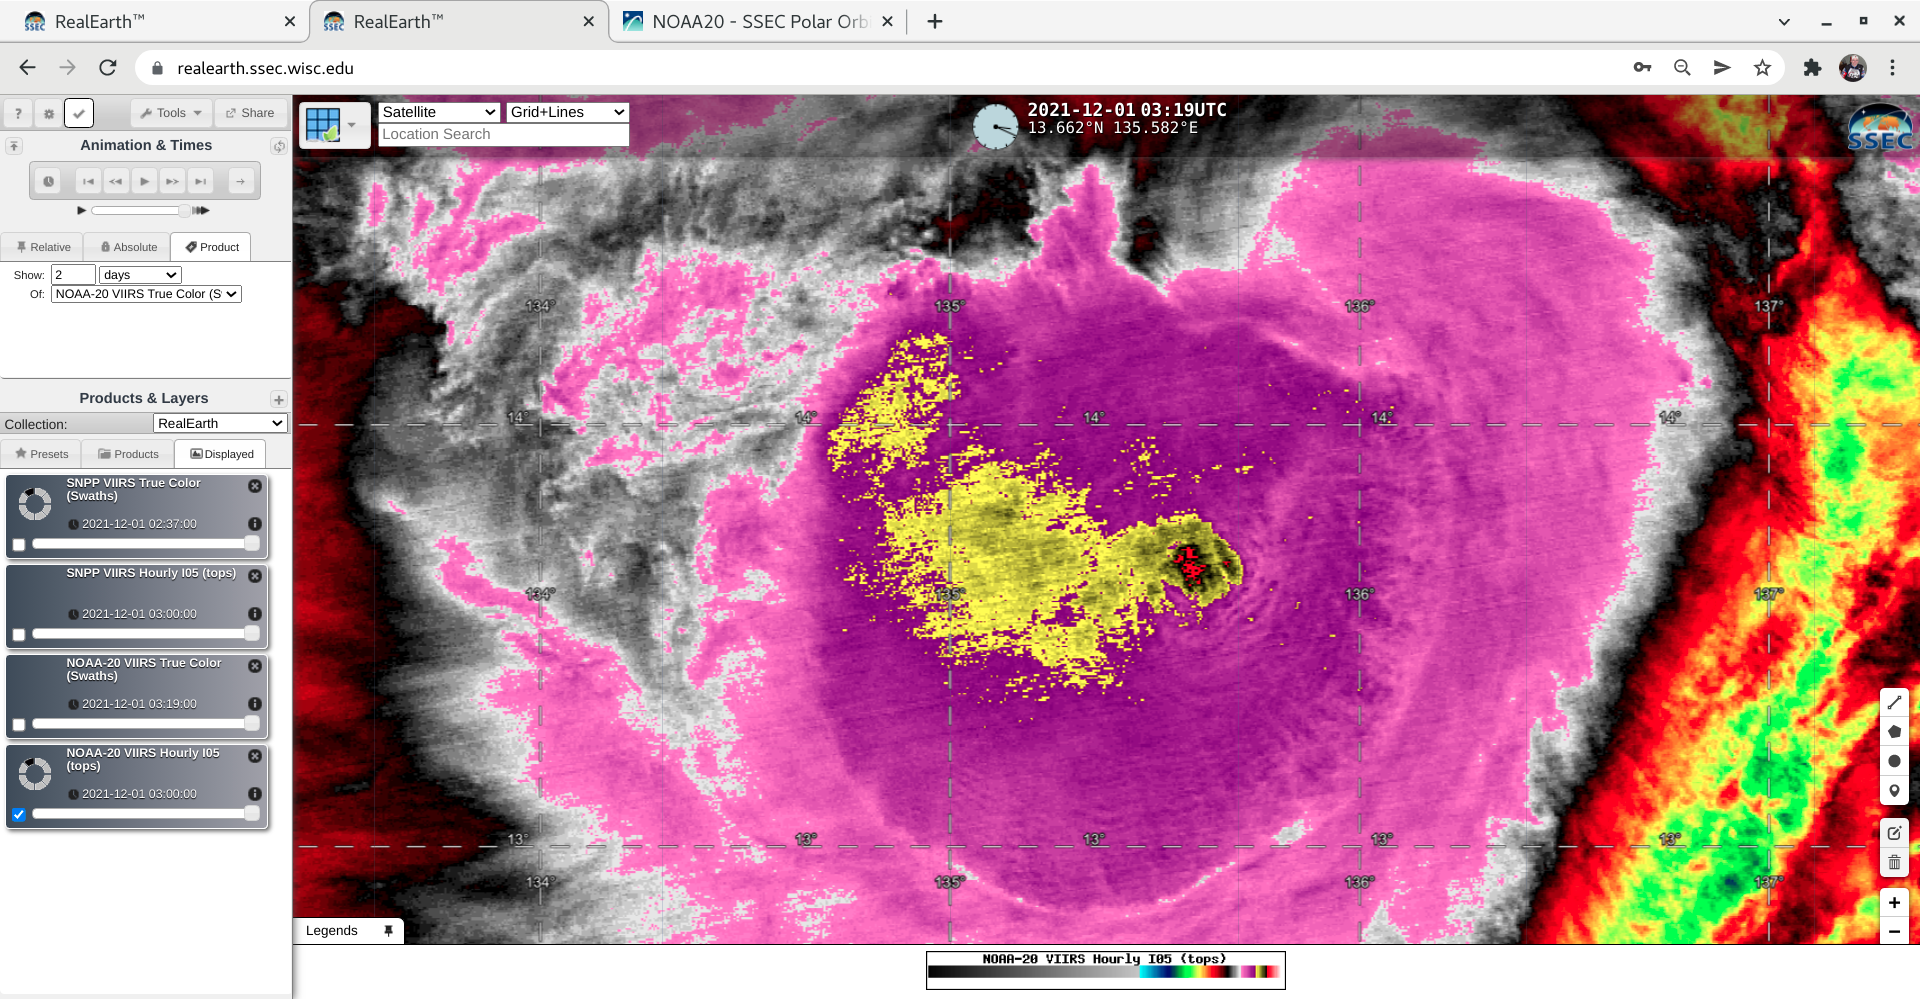

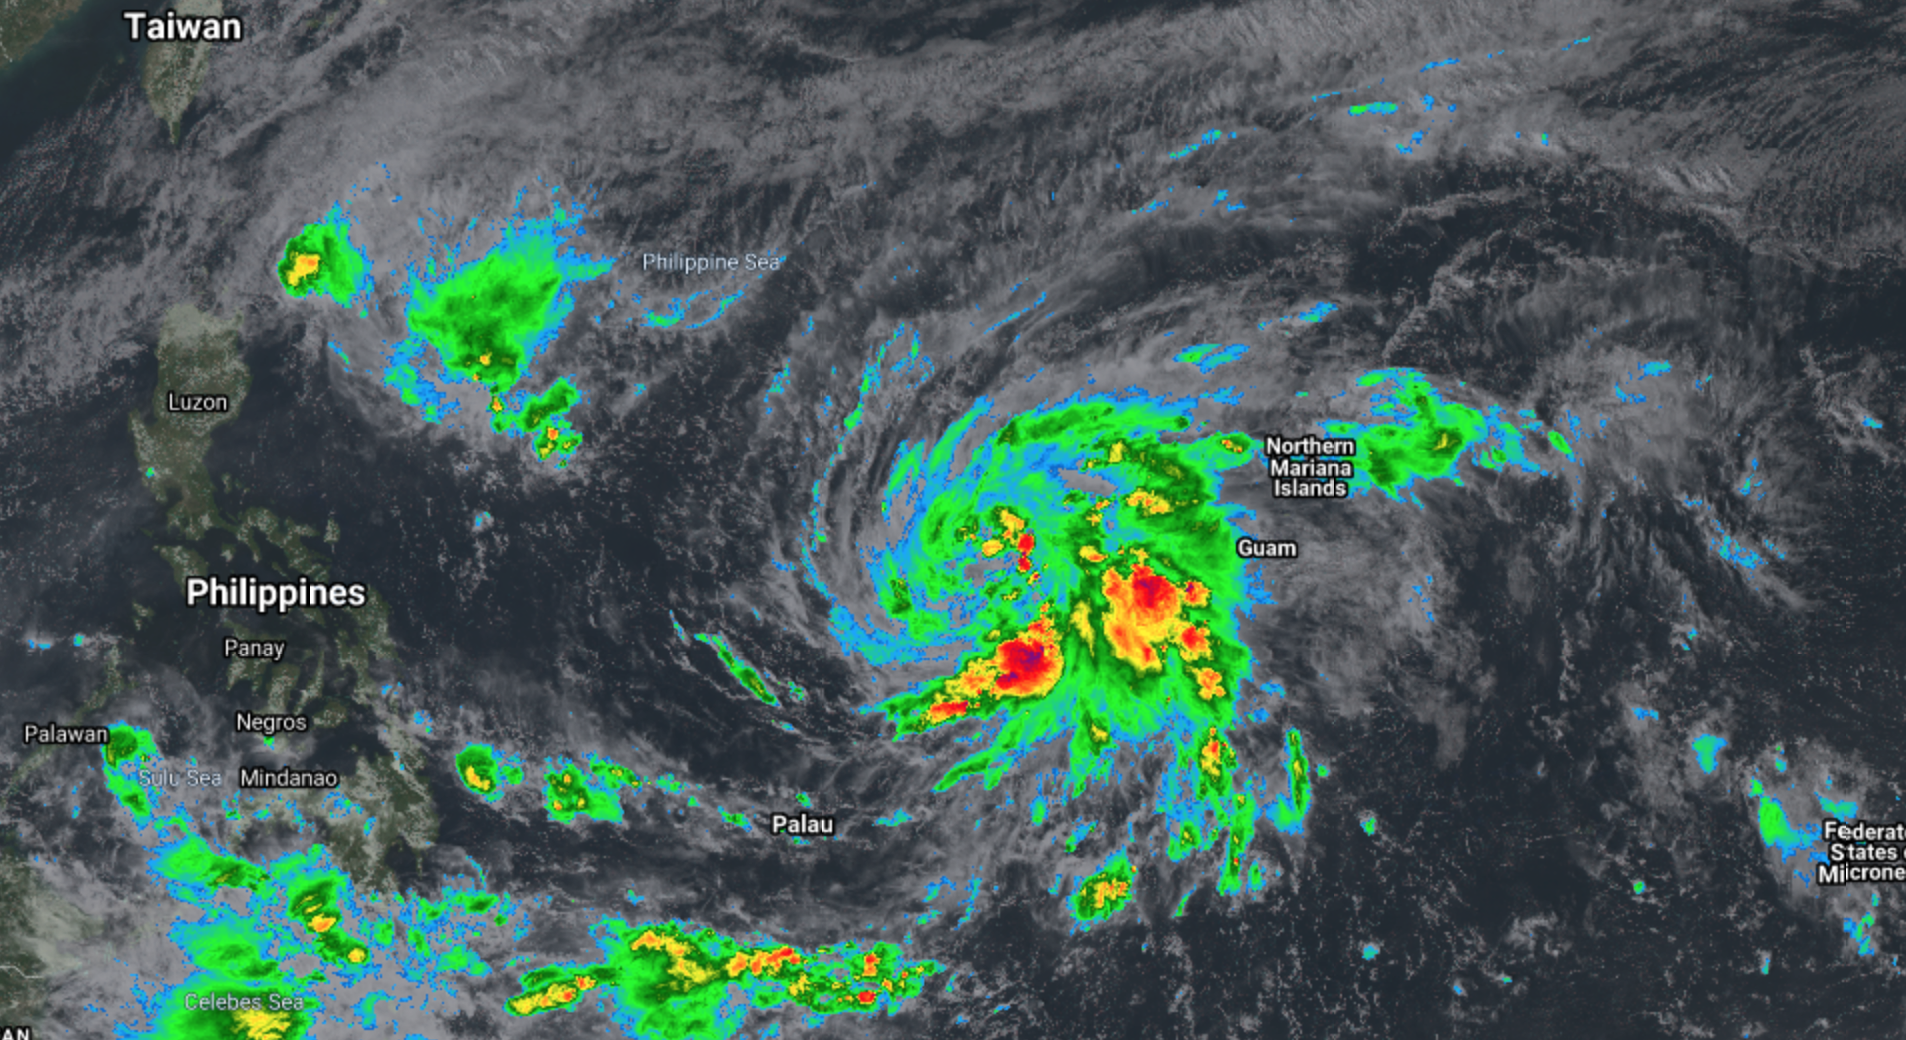
NOAA-20 True Color RGB and Infrared Window (11.45 µm) images [click to enlarge]
NOAA-20 True Color RGB and Infrared Window (11.45 µm) images viewed using RealEarth (above) showed a large convective burst south of the center of Tropical Storm Nahtoh — located in the Philippine Sea — at 0356 UTC on 01 December 2021. A robust overshooting top near the center of the convective burst exhibited a cluster of cloud-top infrared brightness temperatures of -100ºC and colder (red pixels embedded within purple-to-yellow-to-black enhancement).
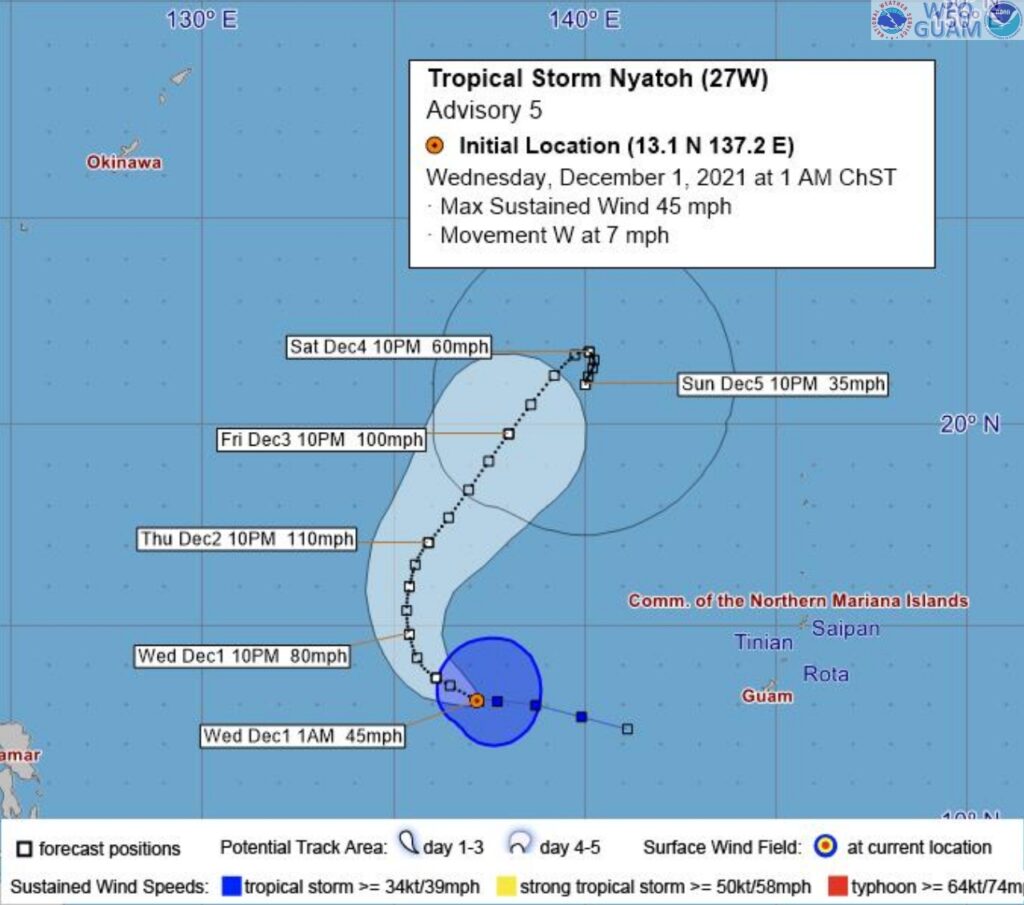
2.5-minute rapid scan JMA Himawari-8 Infrared Window (10.4 µm) images (below) displayed the evolution of Nyatoh as it transitioned from a Tropical Storm to a Category 1 Typhoon at 1200 UTC. The coldest cloud-top infrared brightness temperatures of convective overshooting tops were in the -90 to -98ºC range, but did not quite reach the -100ºC threshold that was seen in the VIIRS imagery.

JMA Himawari-8 Infrared Window (10.4 µm) images [click to play animated GIF | MP4]
Himawari-8 Infrared images with contours of 18 UTC deep-layer wind shear from the CIMSS Tropical Cyclones site (below) showed that Nyatoh was moving through an environment of low to moderate shear.
Himawari-8 Infrared images, with contours of 18 UTC deep-layer wind shear [click to enlarge]
Himawari-8 Infrared – Water Vapor Difference images (below) indicated that much of the deep convection associated with Typhoon Nyatoh was likely penetrating the local tropopause. This product is discussed here.
Himawari-8 Infrared – Water Vapor Difference images [click to enlarge]
DMSP SSMIS Microwave (85 GHz) images at 1905 UTC and 2148 UTC are shown below. A completely closed eyewall had not yet formed at those times.

DMSP-18 SSMIS Microwave (85 GHz) image at 1905 UTC [click to enlarge]
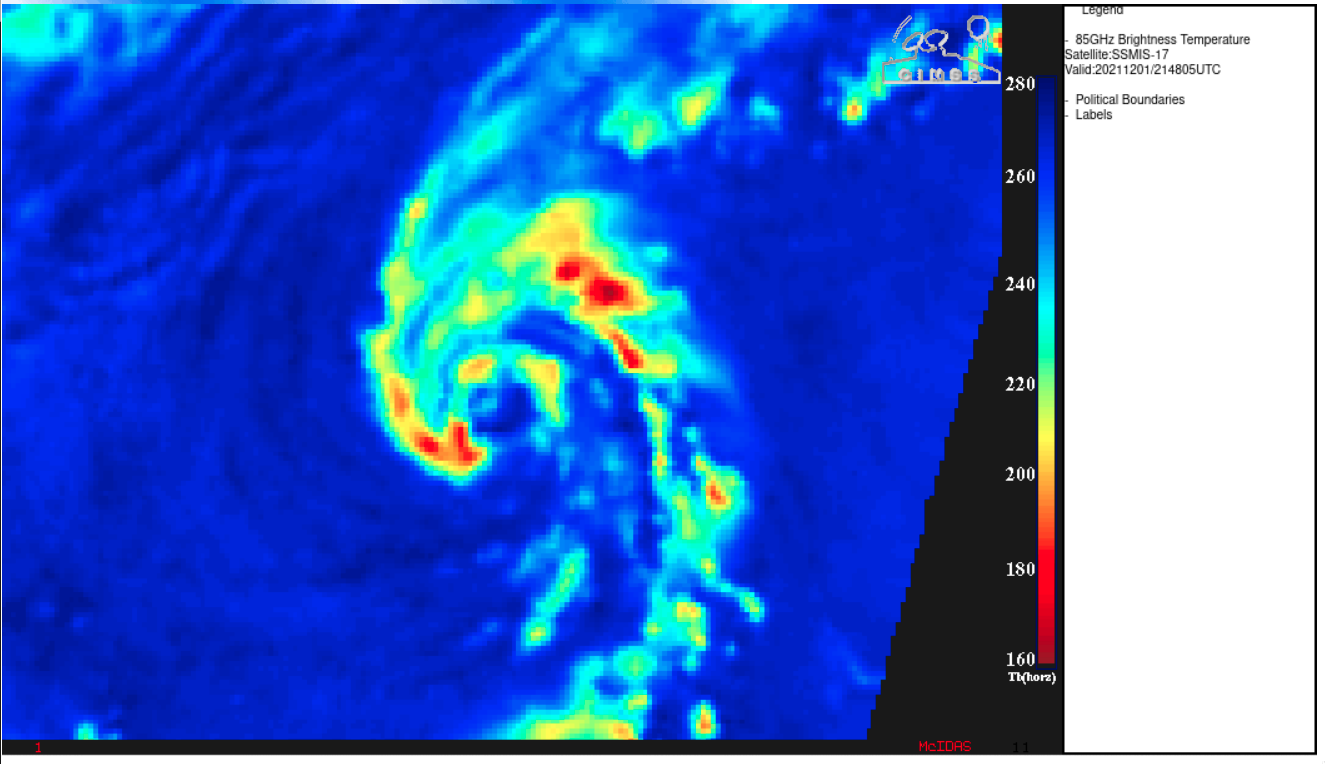
DMSP-17 SSMIS Microwave (85 GHz) image at 2148 UTC [click to enlarge]
===== 02 December Update =====

JMA Himawari-8 Infrared Window (10.4 µm) images [click to play animated GIF | MP4]
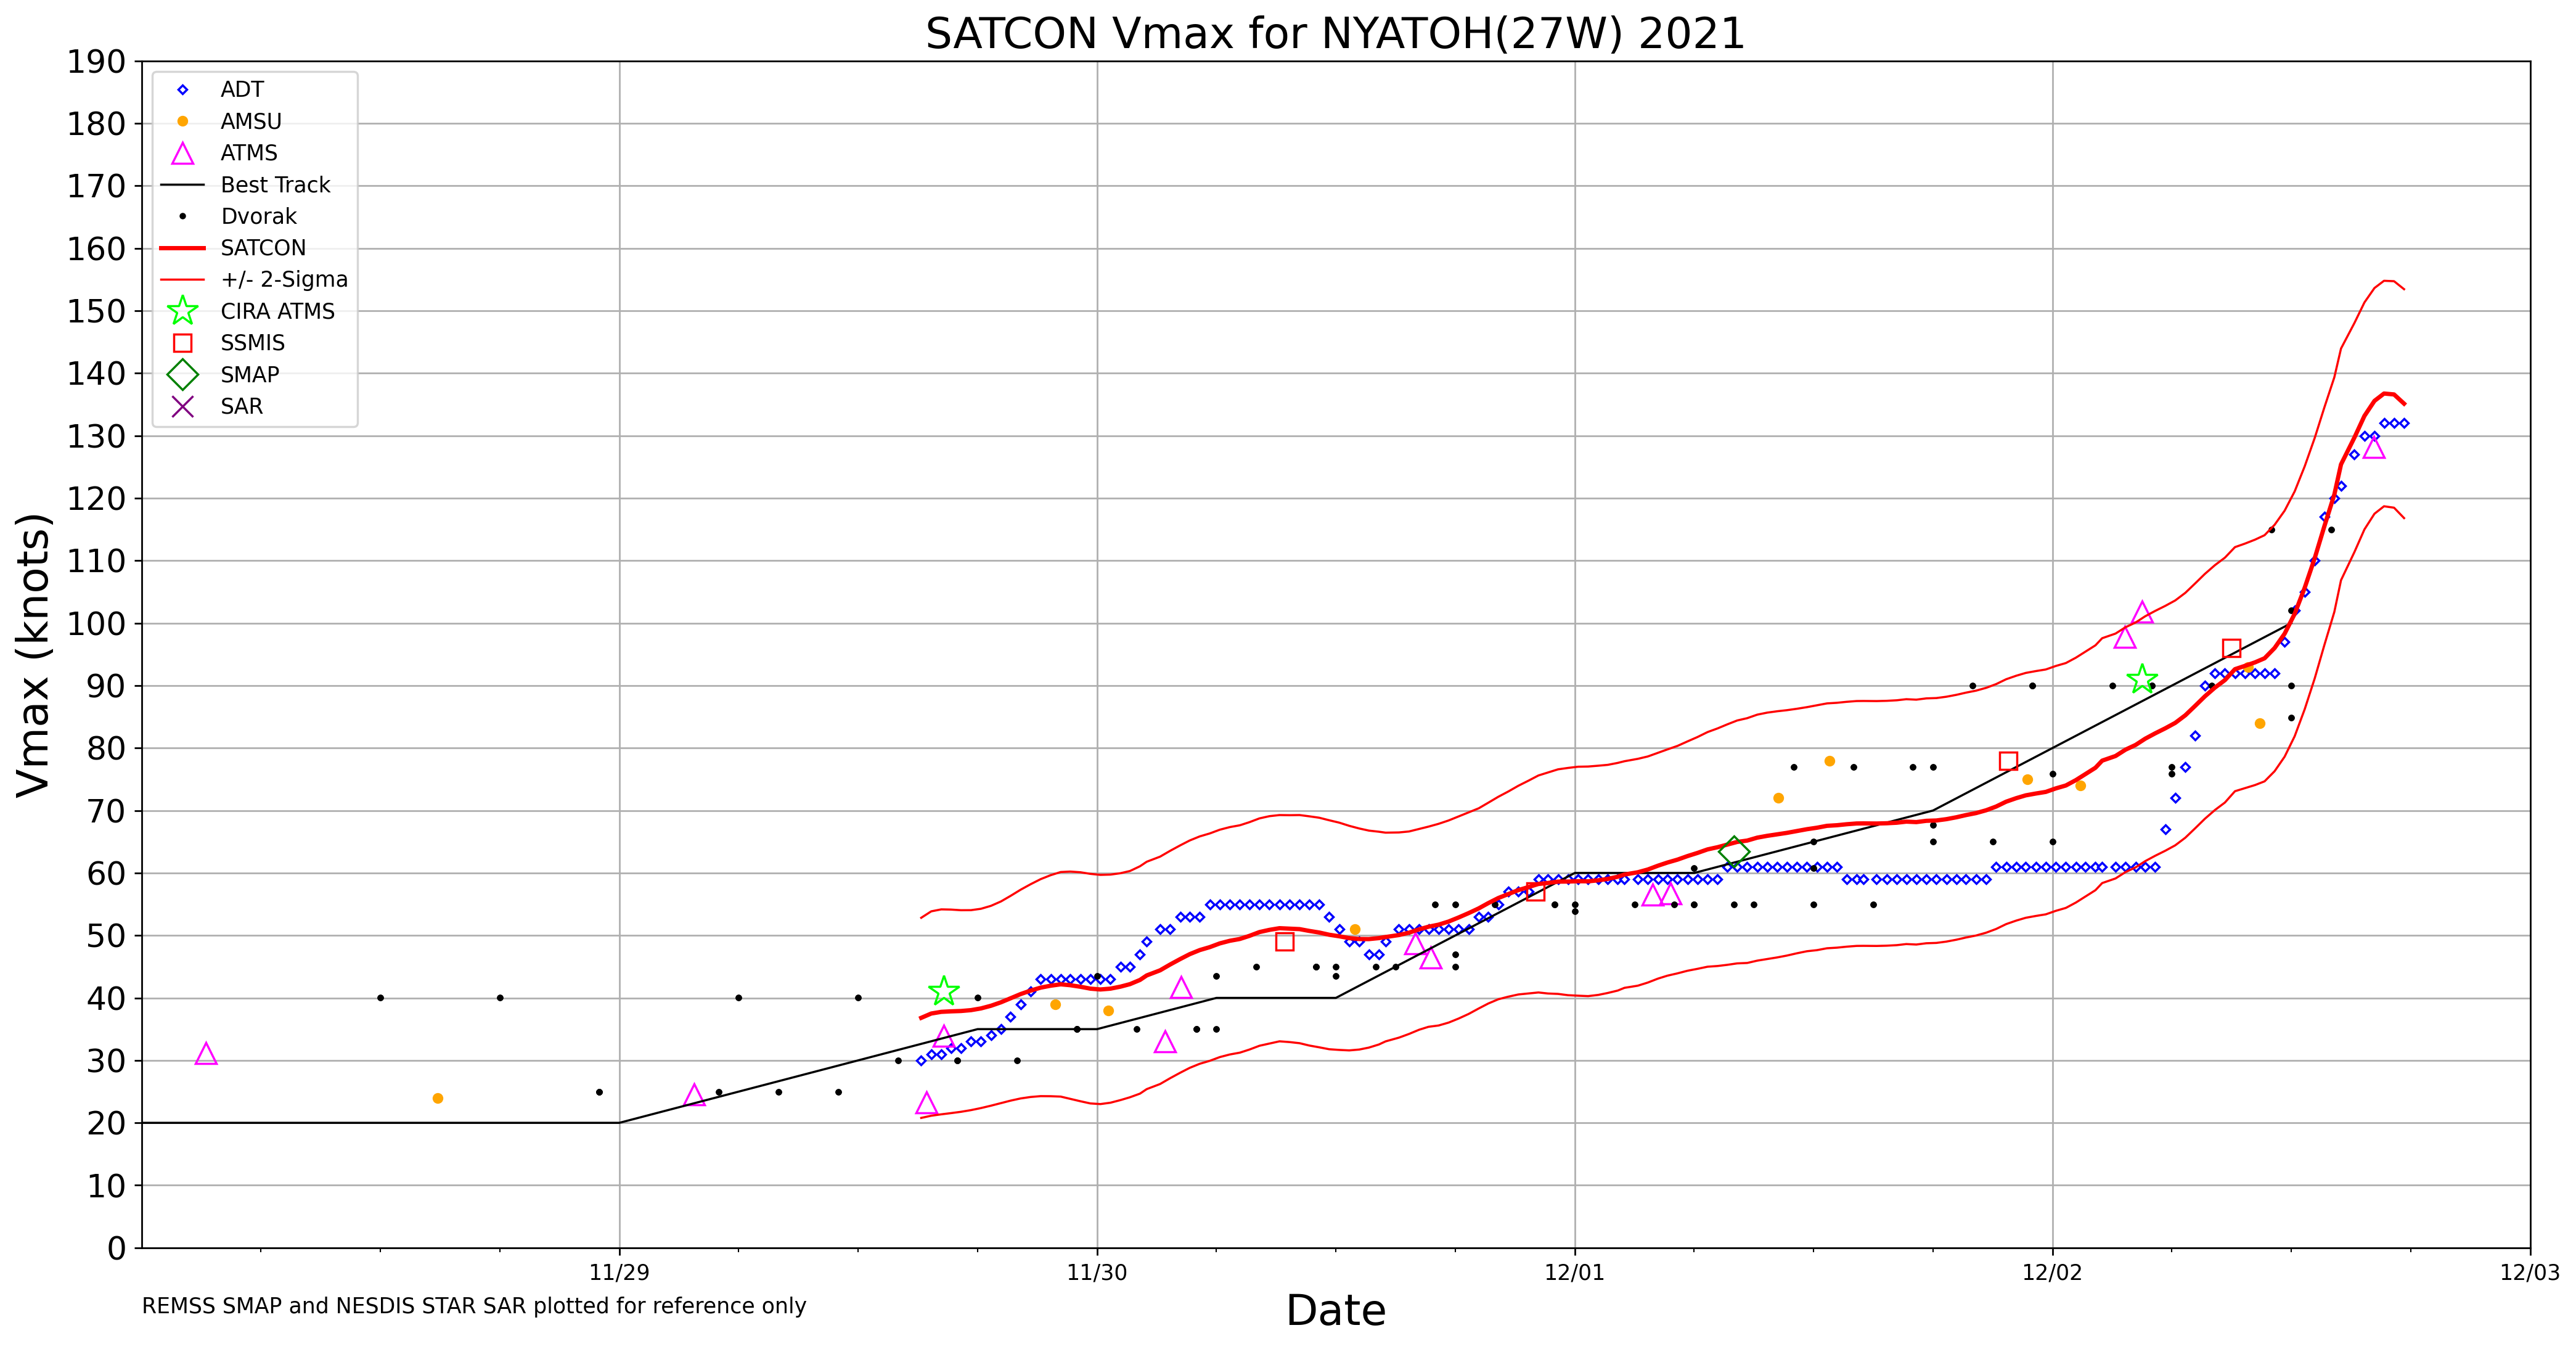
Typhoon Nyatoh rapidly intensified to a Category 3 storm by 1200 UTC, and then Category 4 by 1800 on 02 December (ADT | SATCON) — 2.5-minute rapid scan Himawari-8 Infrared images (above) showed the storm during this intensification period. During the 1200-1800 UTC time frame, subtle waves could be seen propagating south-southwestward across the cold central dense overcast, away from the center of Nyatoh. Energy from those waves was apparently propagating vertically, such that mesospheric airglow waves (reference) were evident in a Suomi-NPP VIIRS Day/Night Band (0.7 µm) image around 1650 UTC (below). Other examples of mesospheric airglow waves — caused by tropical cyclones, deep convection or jet streams — are available here .

Suomi-NPP VIIRS Day/Night Band (0.7 µm) image at 1650 UTC [click to enlarge]
View only this post Read Less


