From the CIMSS Satellite Blog mailbag:
This morning Lufthansa flight DLH469 AUS-IAD at FL370 0011Z at 34.9198N 89.5592W turbulence event, with 4 minor injuries. Your product (ed. note: The CIMSS Turbulence Product, available here) had highlighted the area up pretty well!
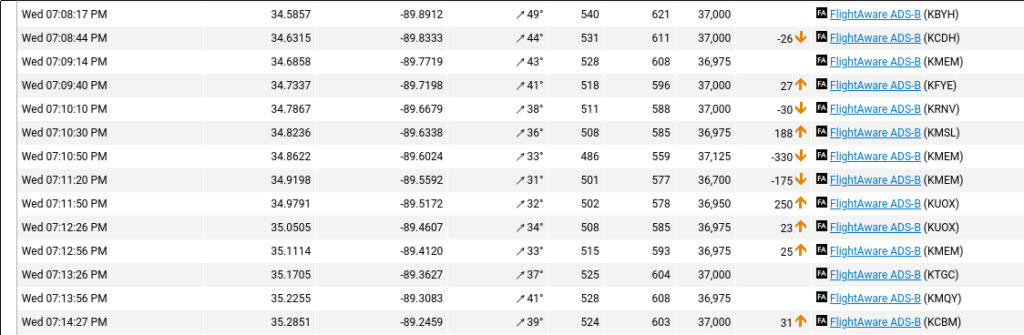
The Flight Log for this Airbus A330, snipped from the FlightAware website (direct link), below, shows the changes in speed/altitude that occurred with this event.
The CIMSS Turbulence product at 0000 UTC, just before that event is shown below. Note that 34.9198oN / 89.5592oW is very near the middle of the Mississippi/Tennessee border.
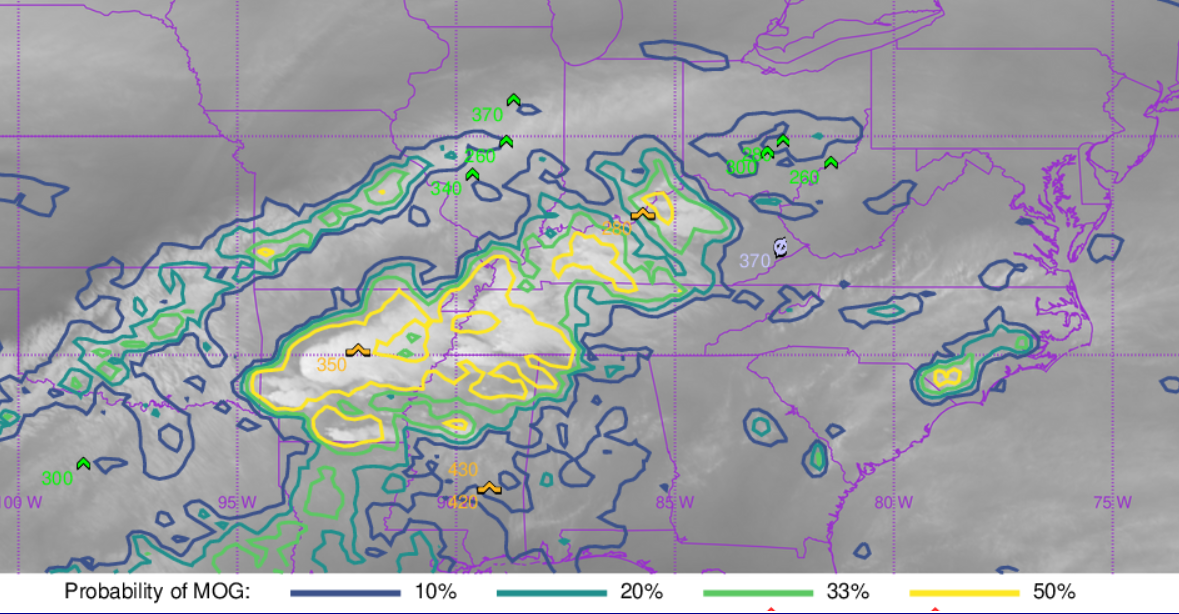
The animation from 2300 UTC on 1 March through 0100 UTC on 2 March, below, shows a general expansion of the area with larger MOG Probabilities along the northern Mississippi border with Tennessee.
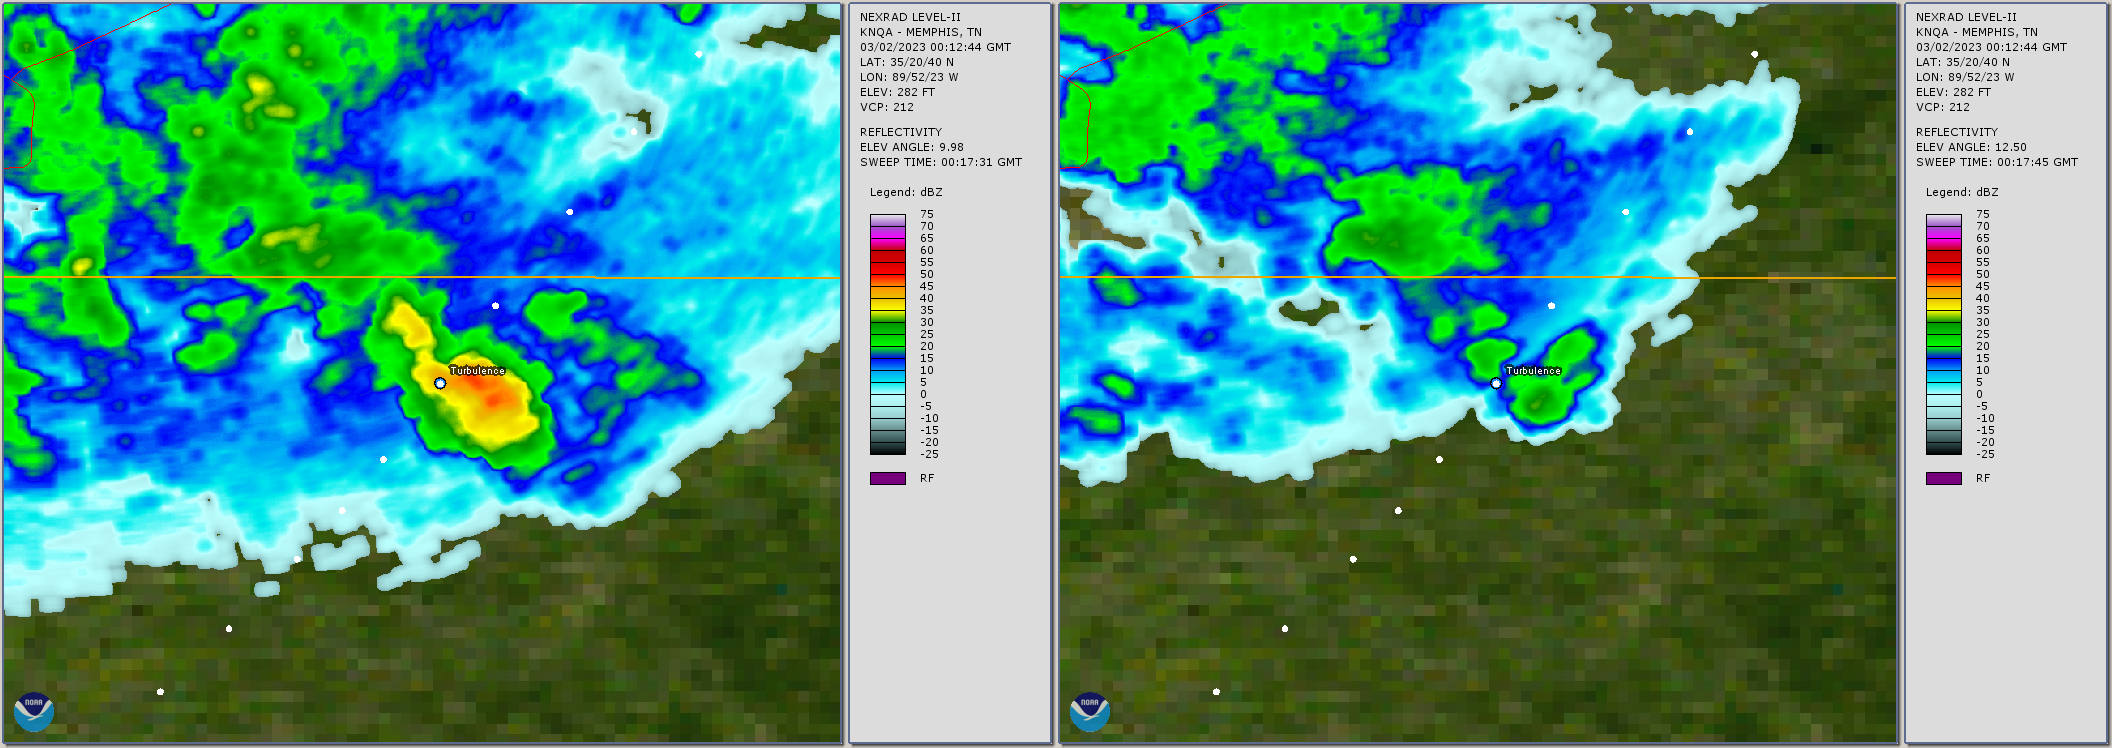
Radar imagery from NQA, shown below (courtesy Don Eick, NTSB), shows the path of the plane into the observed convection.
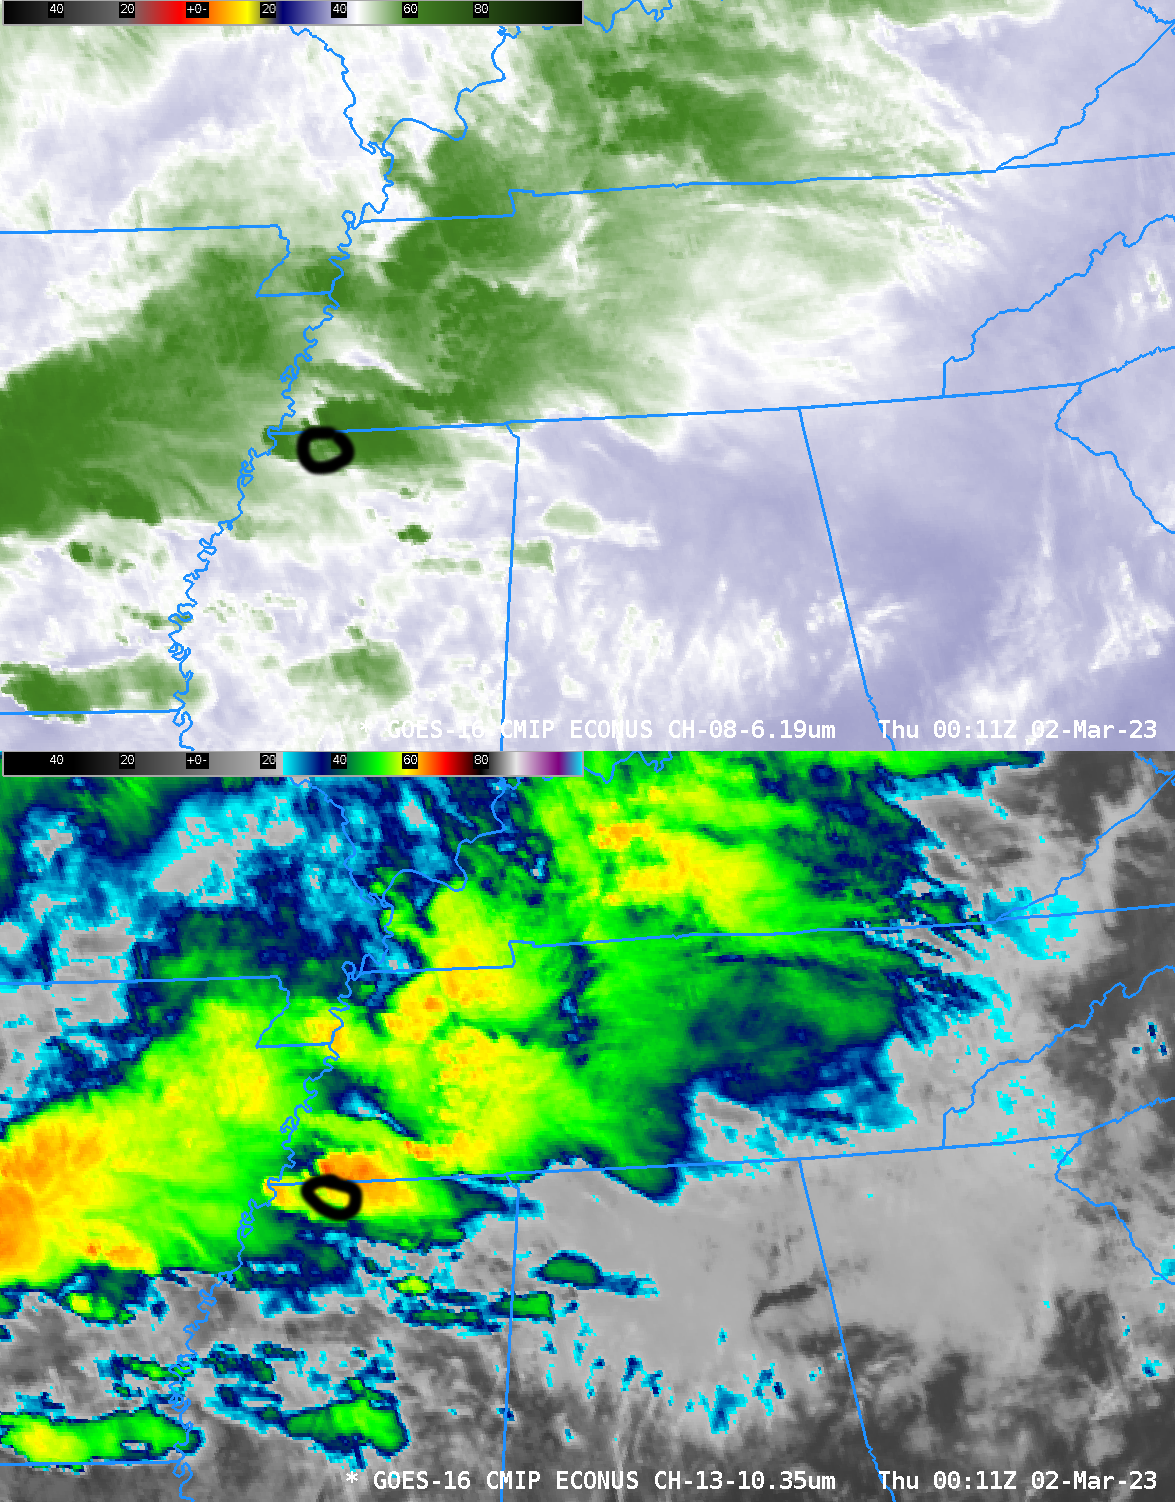
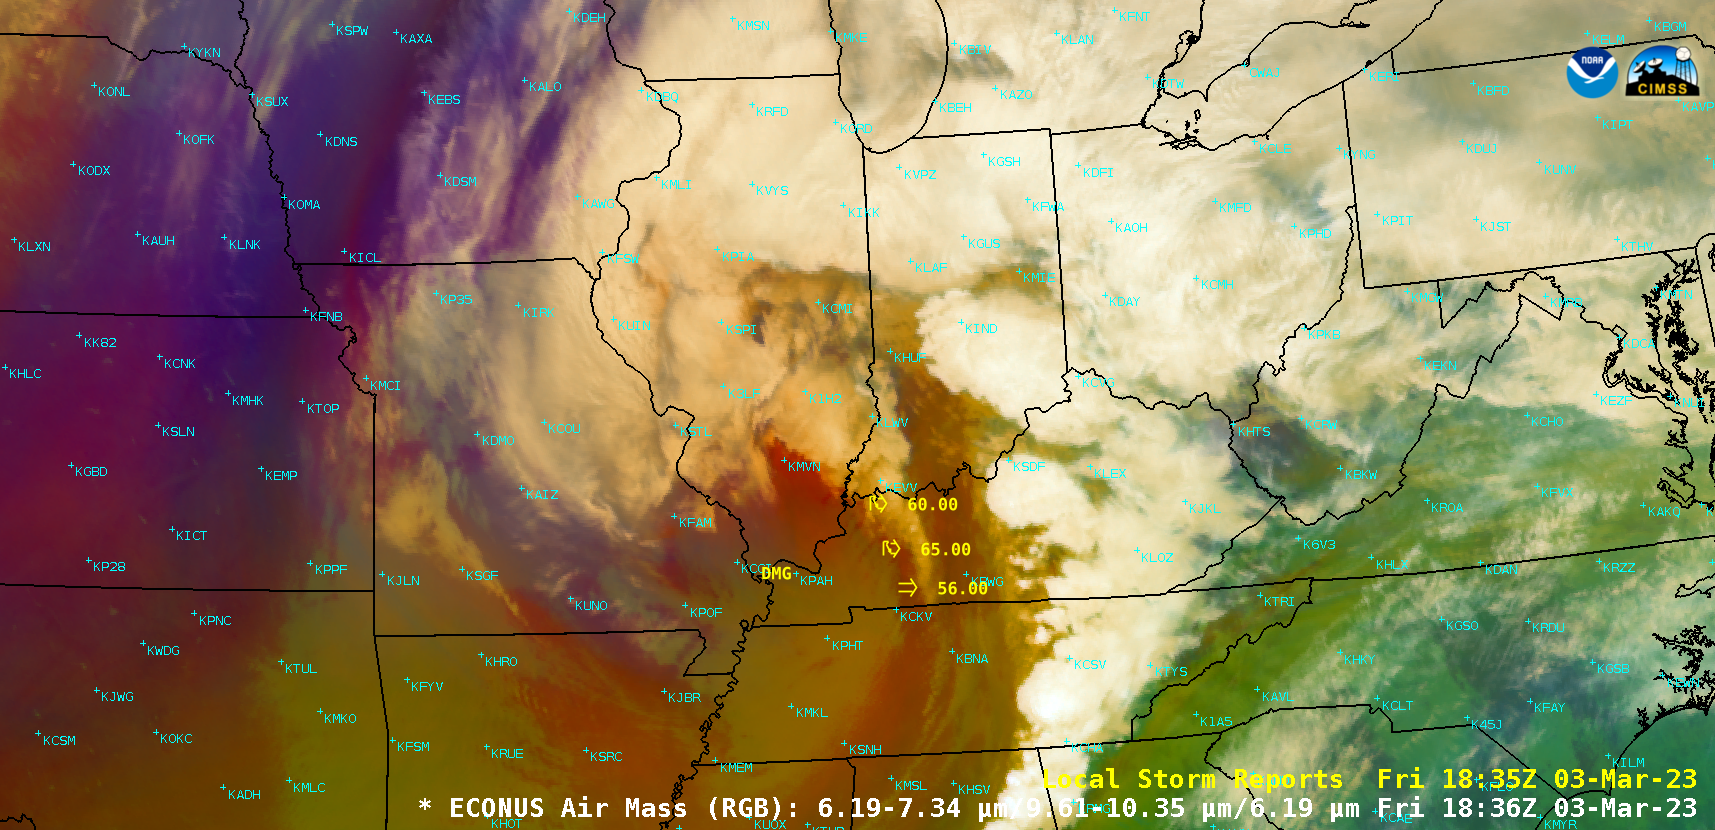
What did the satellite imagery show for this event? Band 8 (Upper level water vapor, 6.19 µm) and Band 13 (Clean Window, 10.3 µm) infrared imagery, below, shows the plane flying through a region of developing convection. How adept are you at picking out the region of convection associated with this turbulence?
The imagery below brackets the time of the convection, and the region of turbulence is circled. The satellite imagery shows multiple convective towers erupting.
The plane diverted to Dulles (KIAD) because of injuries on board. The screencapture below is from an Instagram user on board the plane. Flight information from FlightAware shows that the flight continued for about an hour after the turbulence before the diversion to Dulles.

View only this post Read Less


