This website works best with a newer web browser such as Chrome, Firefox, Safari or Microsoft
Edge. Internet Explorer is not supported by this website.
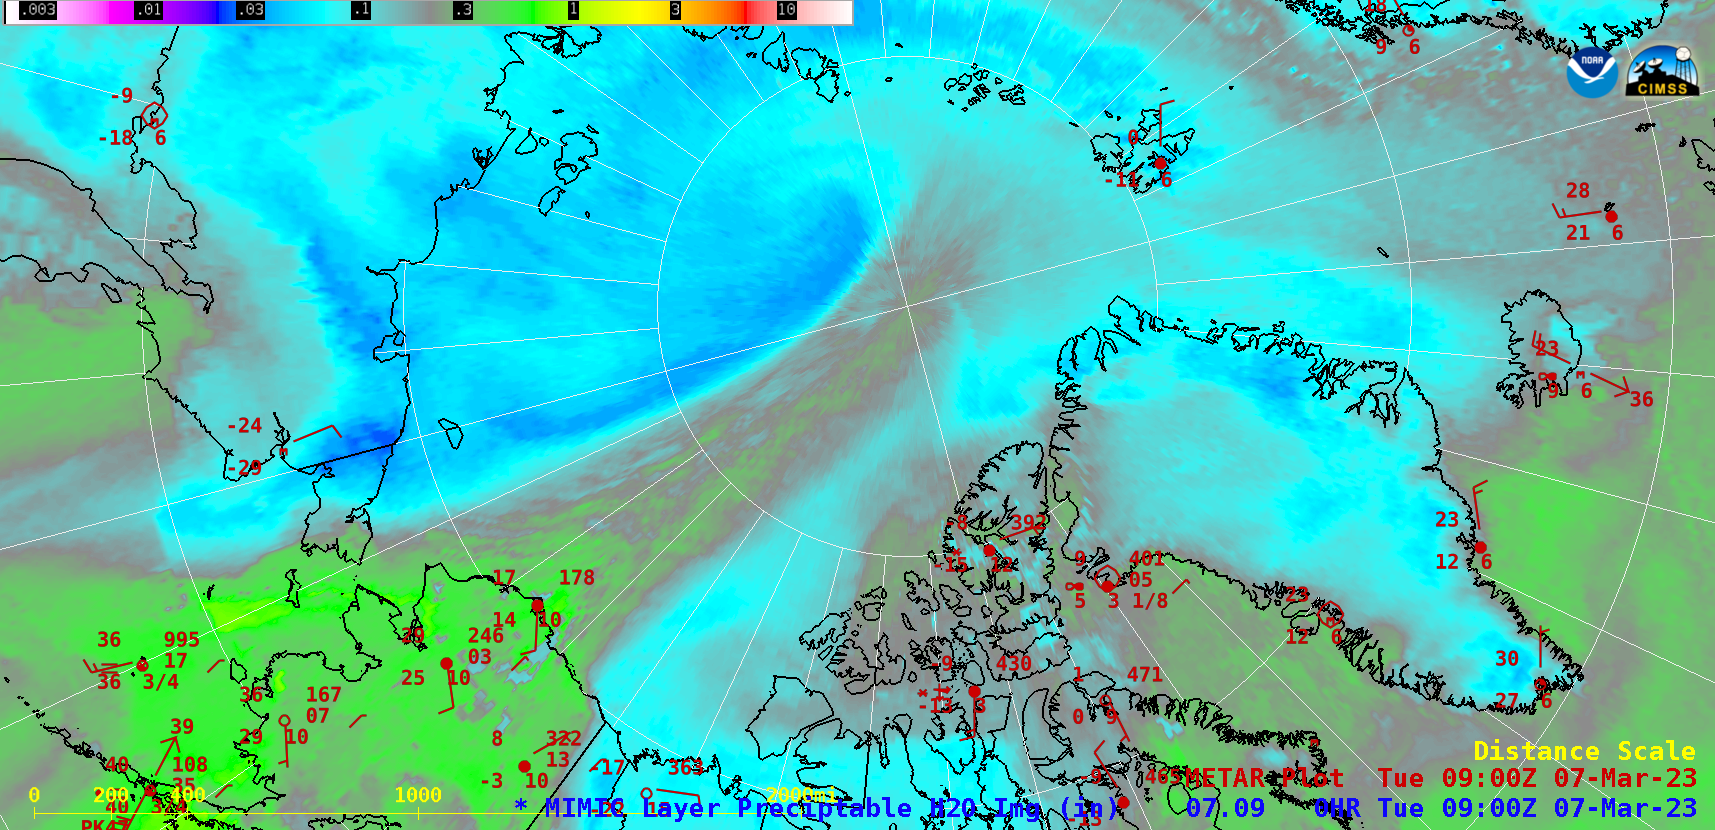
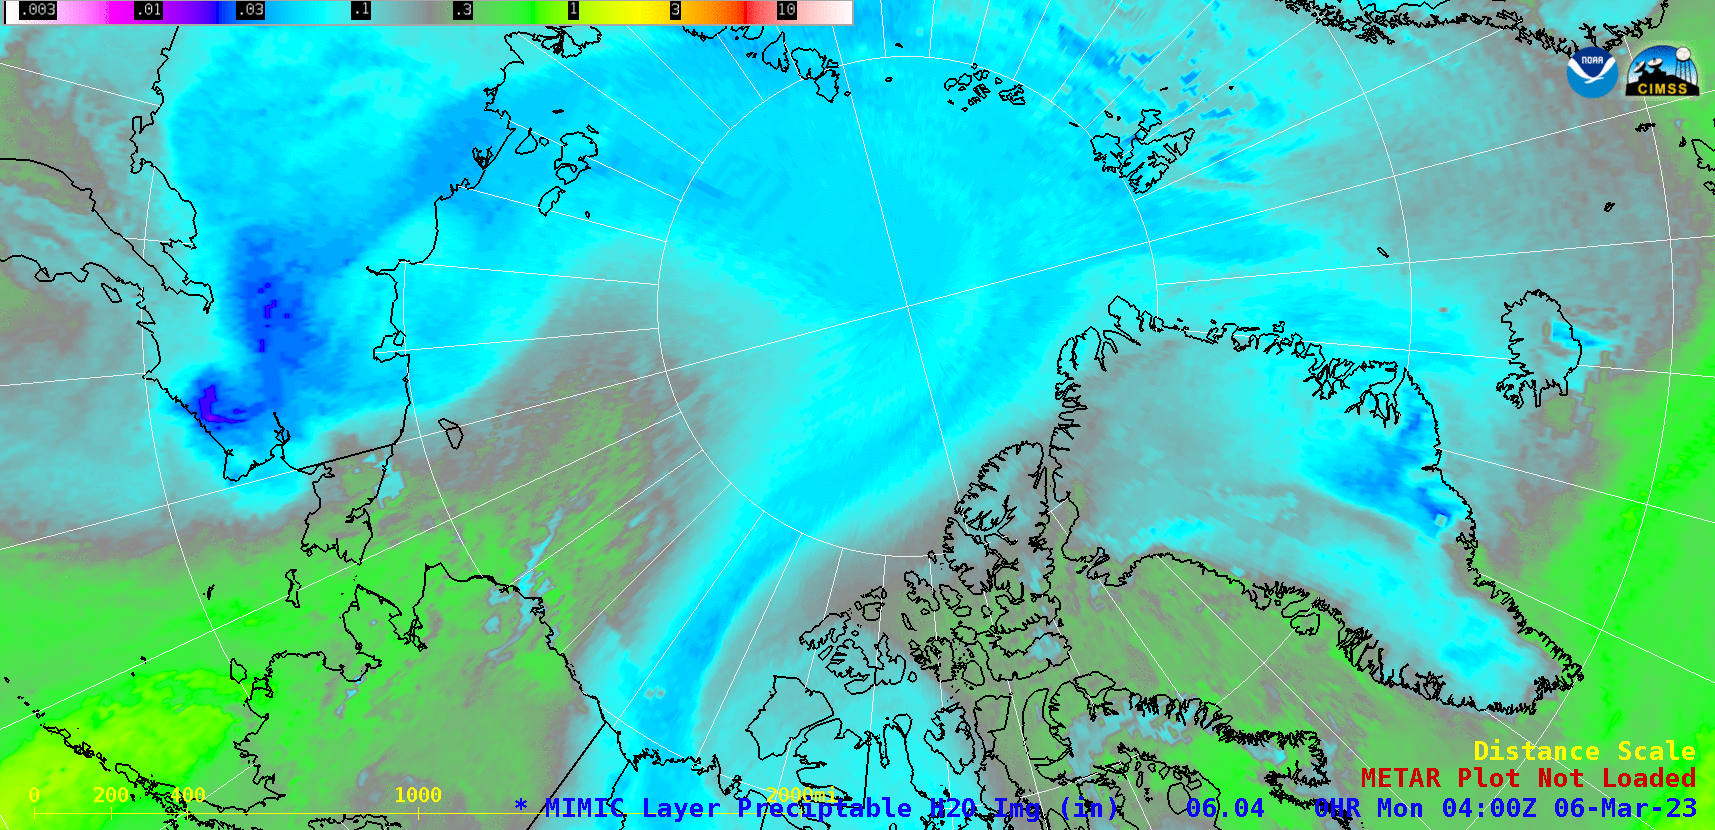
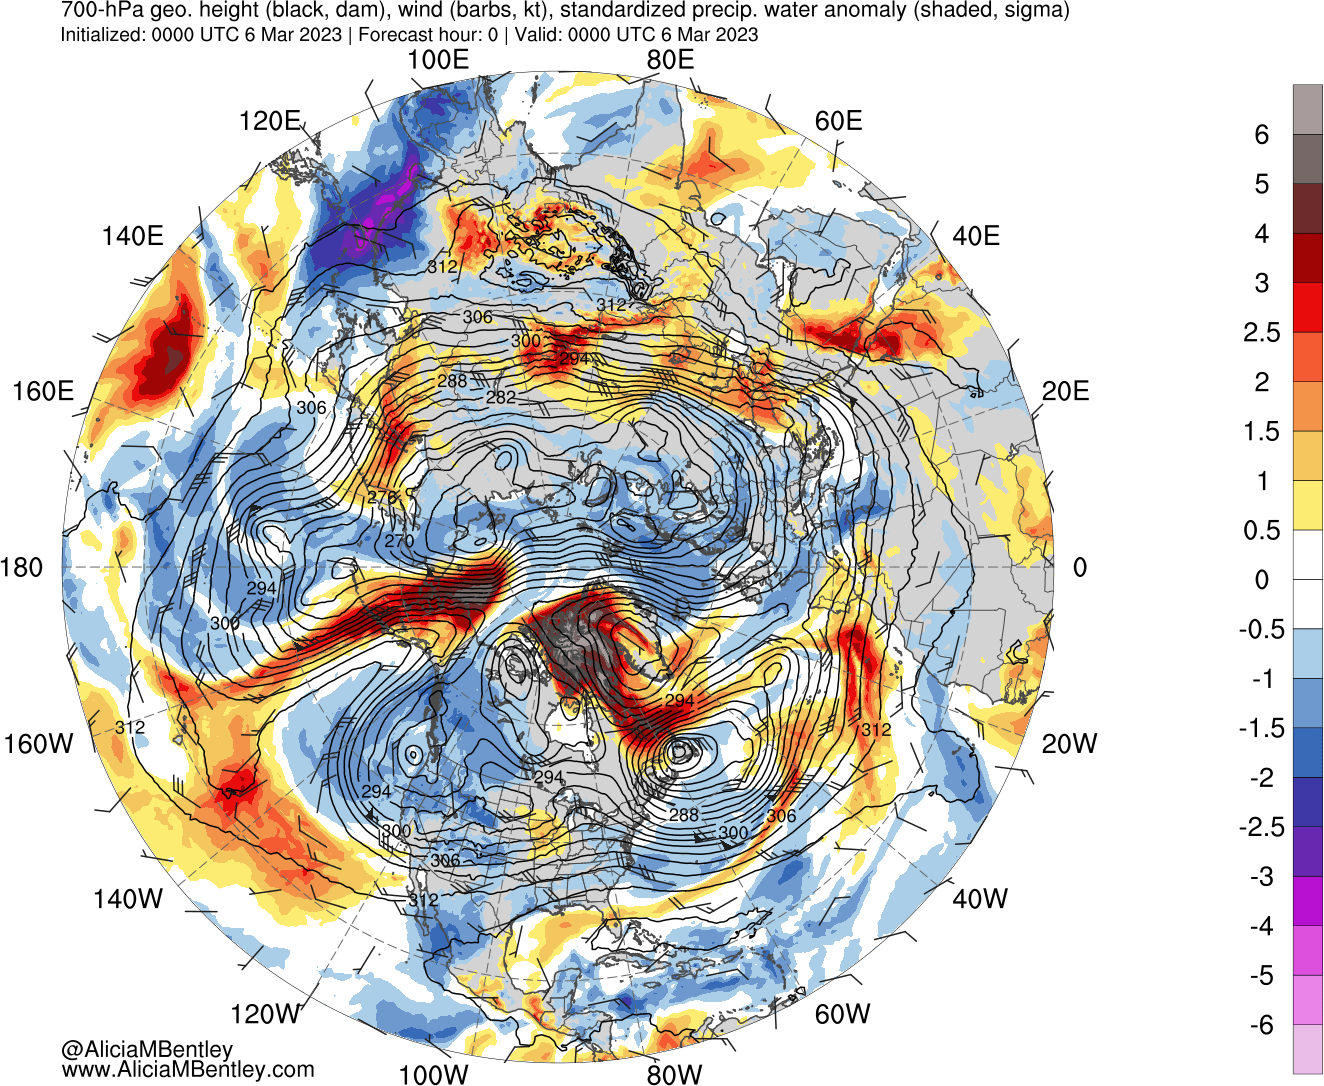
The MIMIC Total Precipitable Water product during the period 0400 UTC on 06 March to 1200 UTC on 08 March 2023 (above) displayed the poleward transport of an atmospheric river (AR) that moved across Alaska and then the North Pole — eventually passing over Svalbard (located between Norway and Greenland). As this AR was... Read More
MIMIC Total Precipitable Water product during the period 0400 UTC on 06 March to 1200 UTC on 08 March 2023 [click to play animated GIF | MP4]
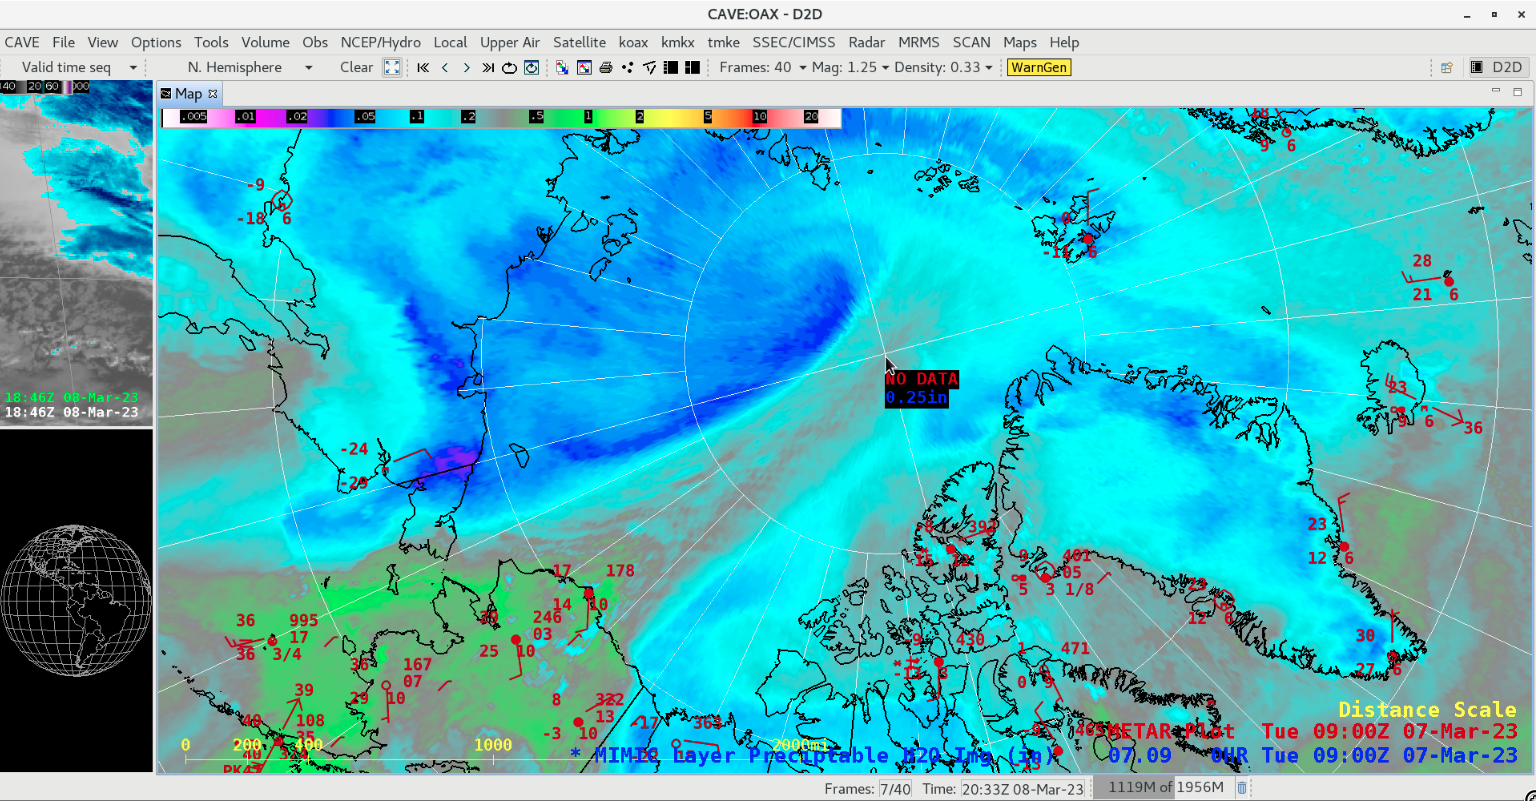
The MIMIC Total Precipitable Water product during the period 0400 UTC on 06 March to 1200 UTC on 08 March 2023 (above) displayed the poleward transport of an atmospheric river (AR) that moved across Alaska and then the North Pole — eventually passing over Svalbard (located between Norway and Greenland). As this AR was emerging from the north coast of Alaska and approaching the North Pole, Total Precipitable Water (TPW) value anomalies were as high as 5-6 standard deviations above normal (source).
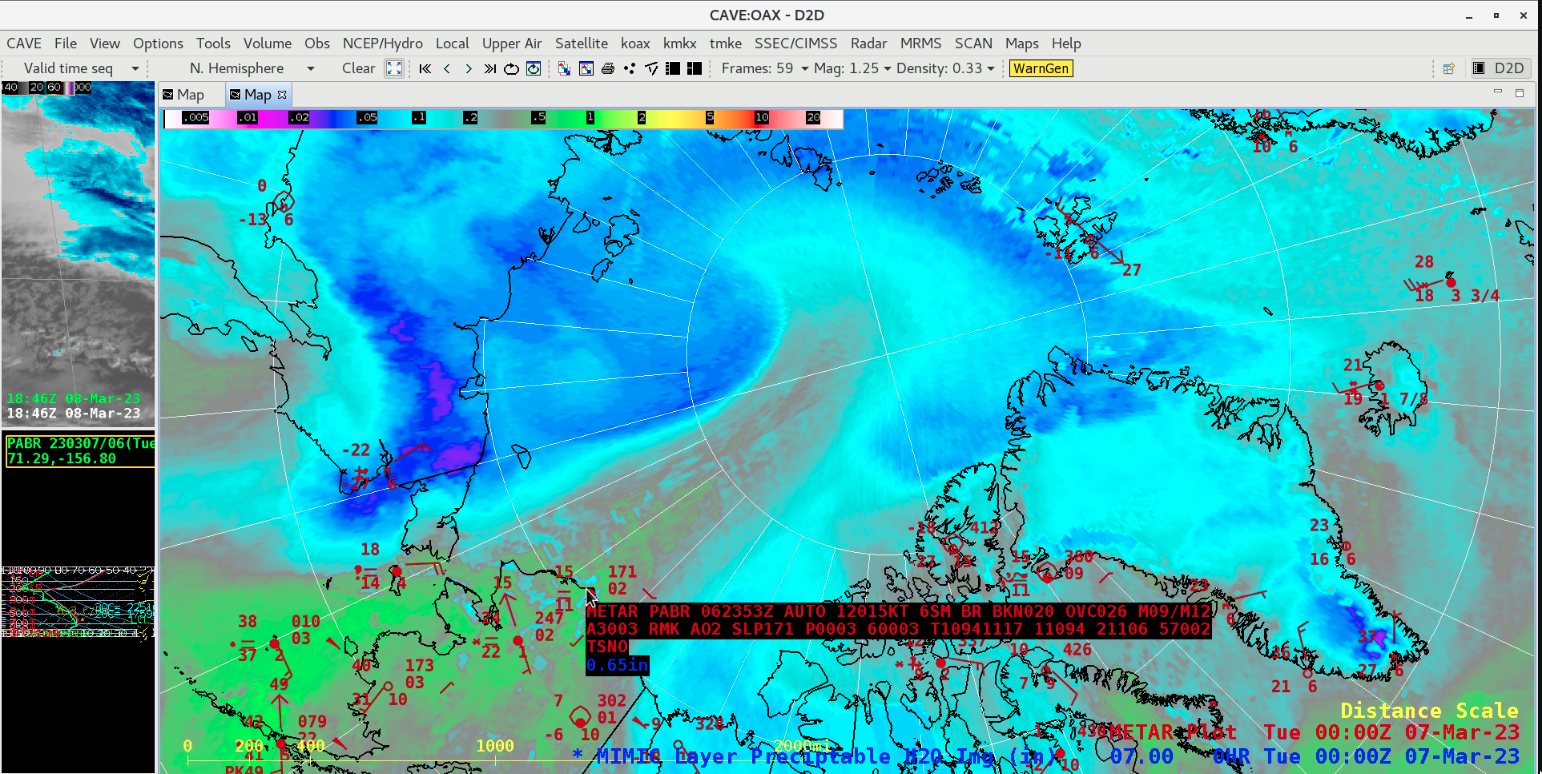
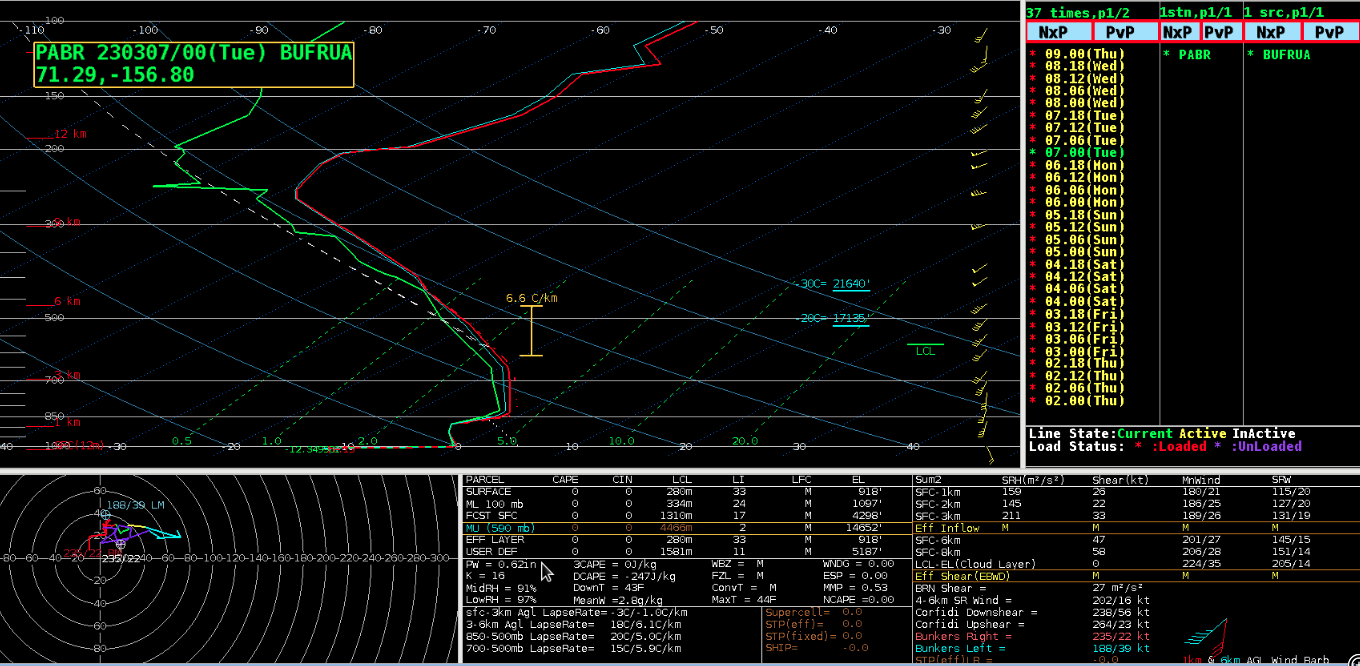
As the AR moisture plume was moving over Utqiagvik (formerly “Barrow”; station identifier PABR) Alaska at 0000 UTC on 07 March, the rawinsonde-derived TPW value was 0.62 inch (which might have been a monthly record high TPW for PABR, according to this tweet). At that particular time there was good agreement with the MIMIC TPW product, whose value in the vicinity of PABR was 0.65 inch (below).
MIMIC Total Precipitable Water product at 0000 UTC on 07 March, along with a cursor sample showing the PABR surface report at that time [click to enlarge]
The NESDIS Snowfall Rate product from the CICS site (below) showed the AR plume of clouds that was likely producing snowfall at the surface as it moved northward from the coast of Alaska to the Arctic Ocean.
NESDIS Snowfall Rate product [click to play animated GIF]
Here’s a special image! This shows a snowfall rate product, giving liquid equivalent of snow in inches/hr. What’s special is that the remote north pole typically doesn't have observations of snowfall, but now we have a satellite product that can provide this information! #akwxpic.twitter.com/wPn4wVLpvX
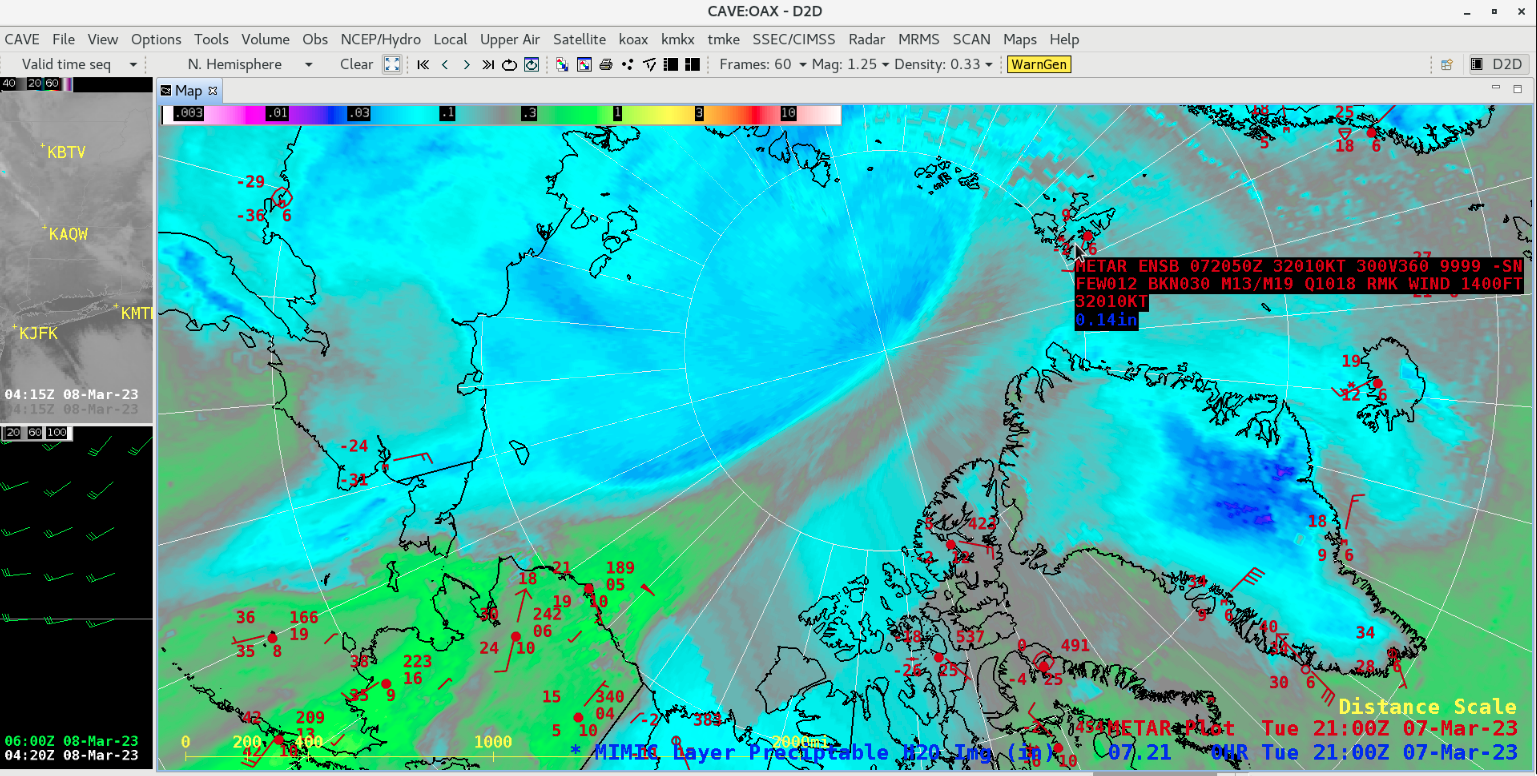
As the AR was passing across the North Pole, the maximum MIMIC TPW value at that location was 0.25 inch at 0900 UTC on 07 March (below).
MIMIC TPW value over the North Pole at 0900 UTC on 07 March [click to enlarge]
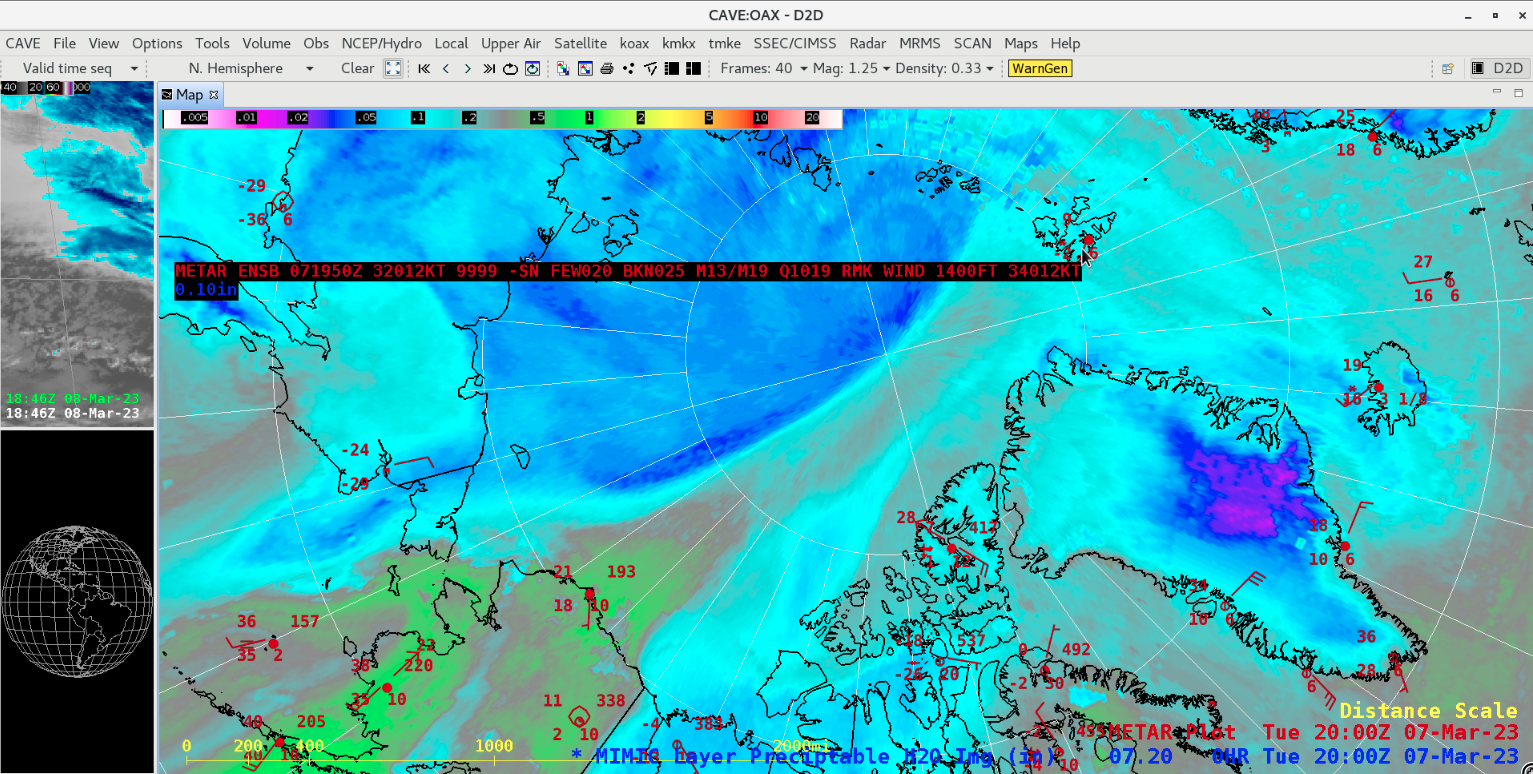
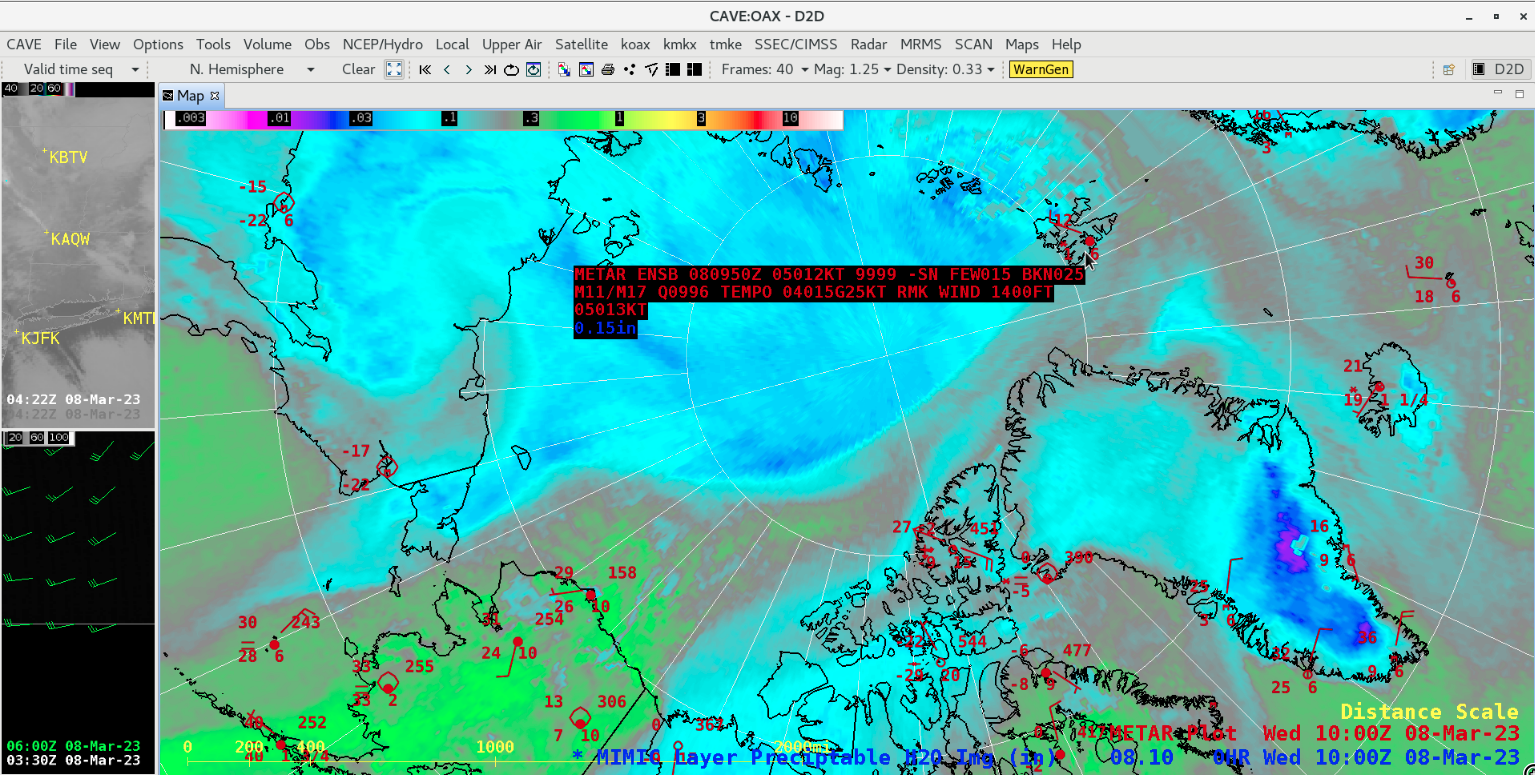
As the leading edge of the AR eventually began moving over Svalbard (station identifier ENSB) — a distance of approximately 2000 miles from the northern coast of Alaska — light snow was observed at 2000 UTC (below) and 2100 UTC on 07 March, and then again at 0900-1000 UTC on 08 March.
MIMIC TPW product at 2000 UTC on 07 March, with a cursor sample of the METAR surface observation at Svalbard ENSB [click to enlarge]
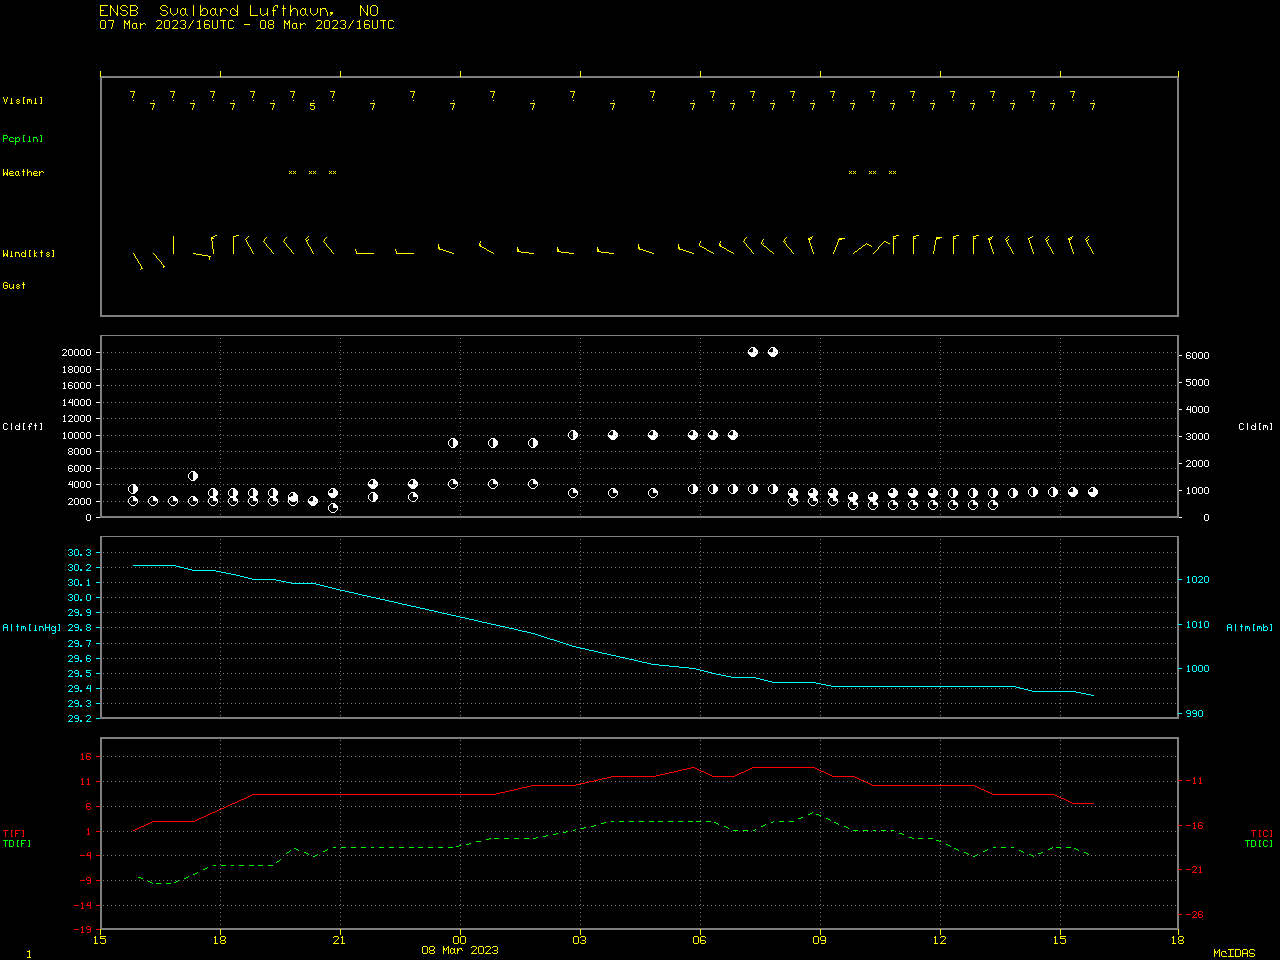
Note the gradual increase in temperature and dew point as the AR continued to traverse Svalbard (below).
Time-series plot of surface report data from Svalbard Lufthaven [click to enlarge]
Note: NOAA-21 data used in this blog post are preliminary and non-operational. Imagery was created using Polar2Grid v3.0.The CIMSS Community Satellite Processing Package (CSPP) team has released Polar2Grid version 3.0, a software package that can be used (among many other things!) to create high-quality imagery from JPSS Sensor Data Record (SDR) files... Read More
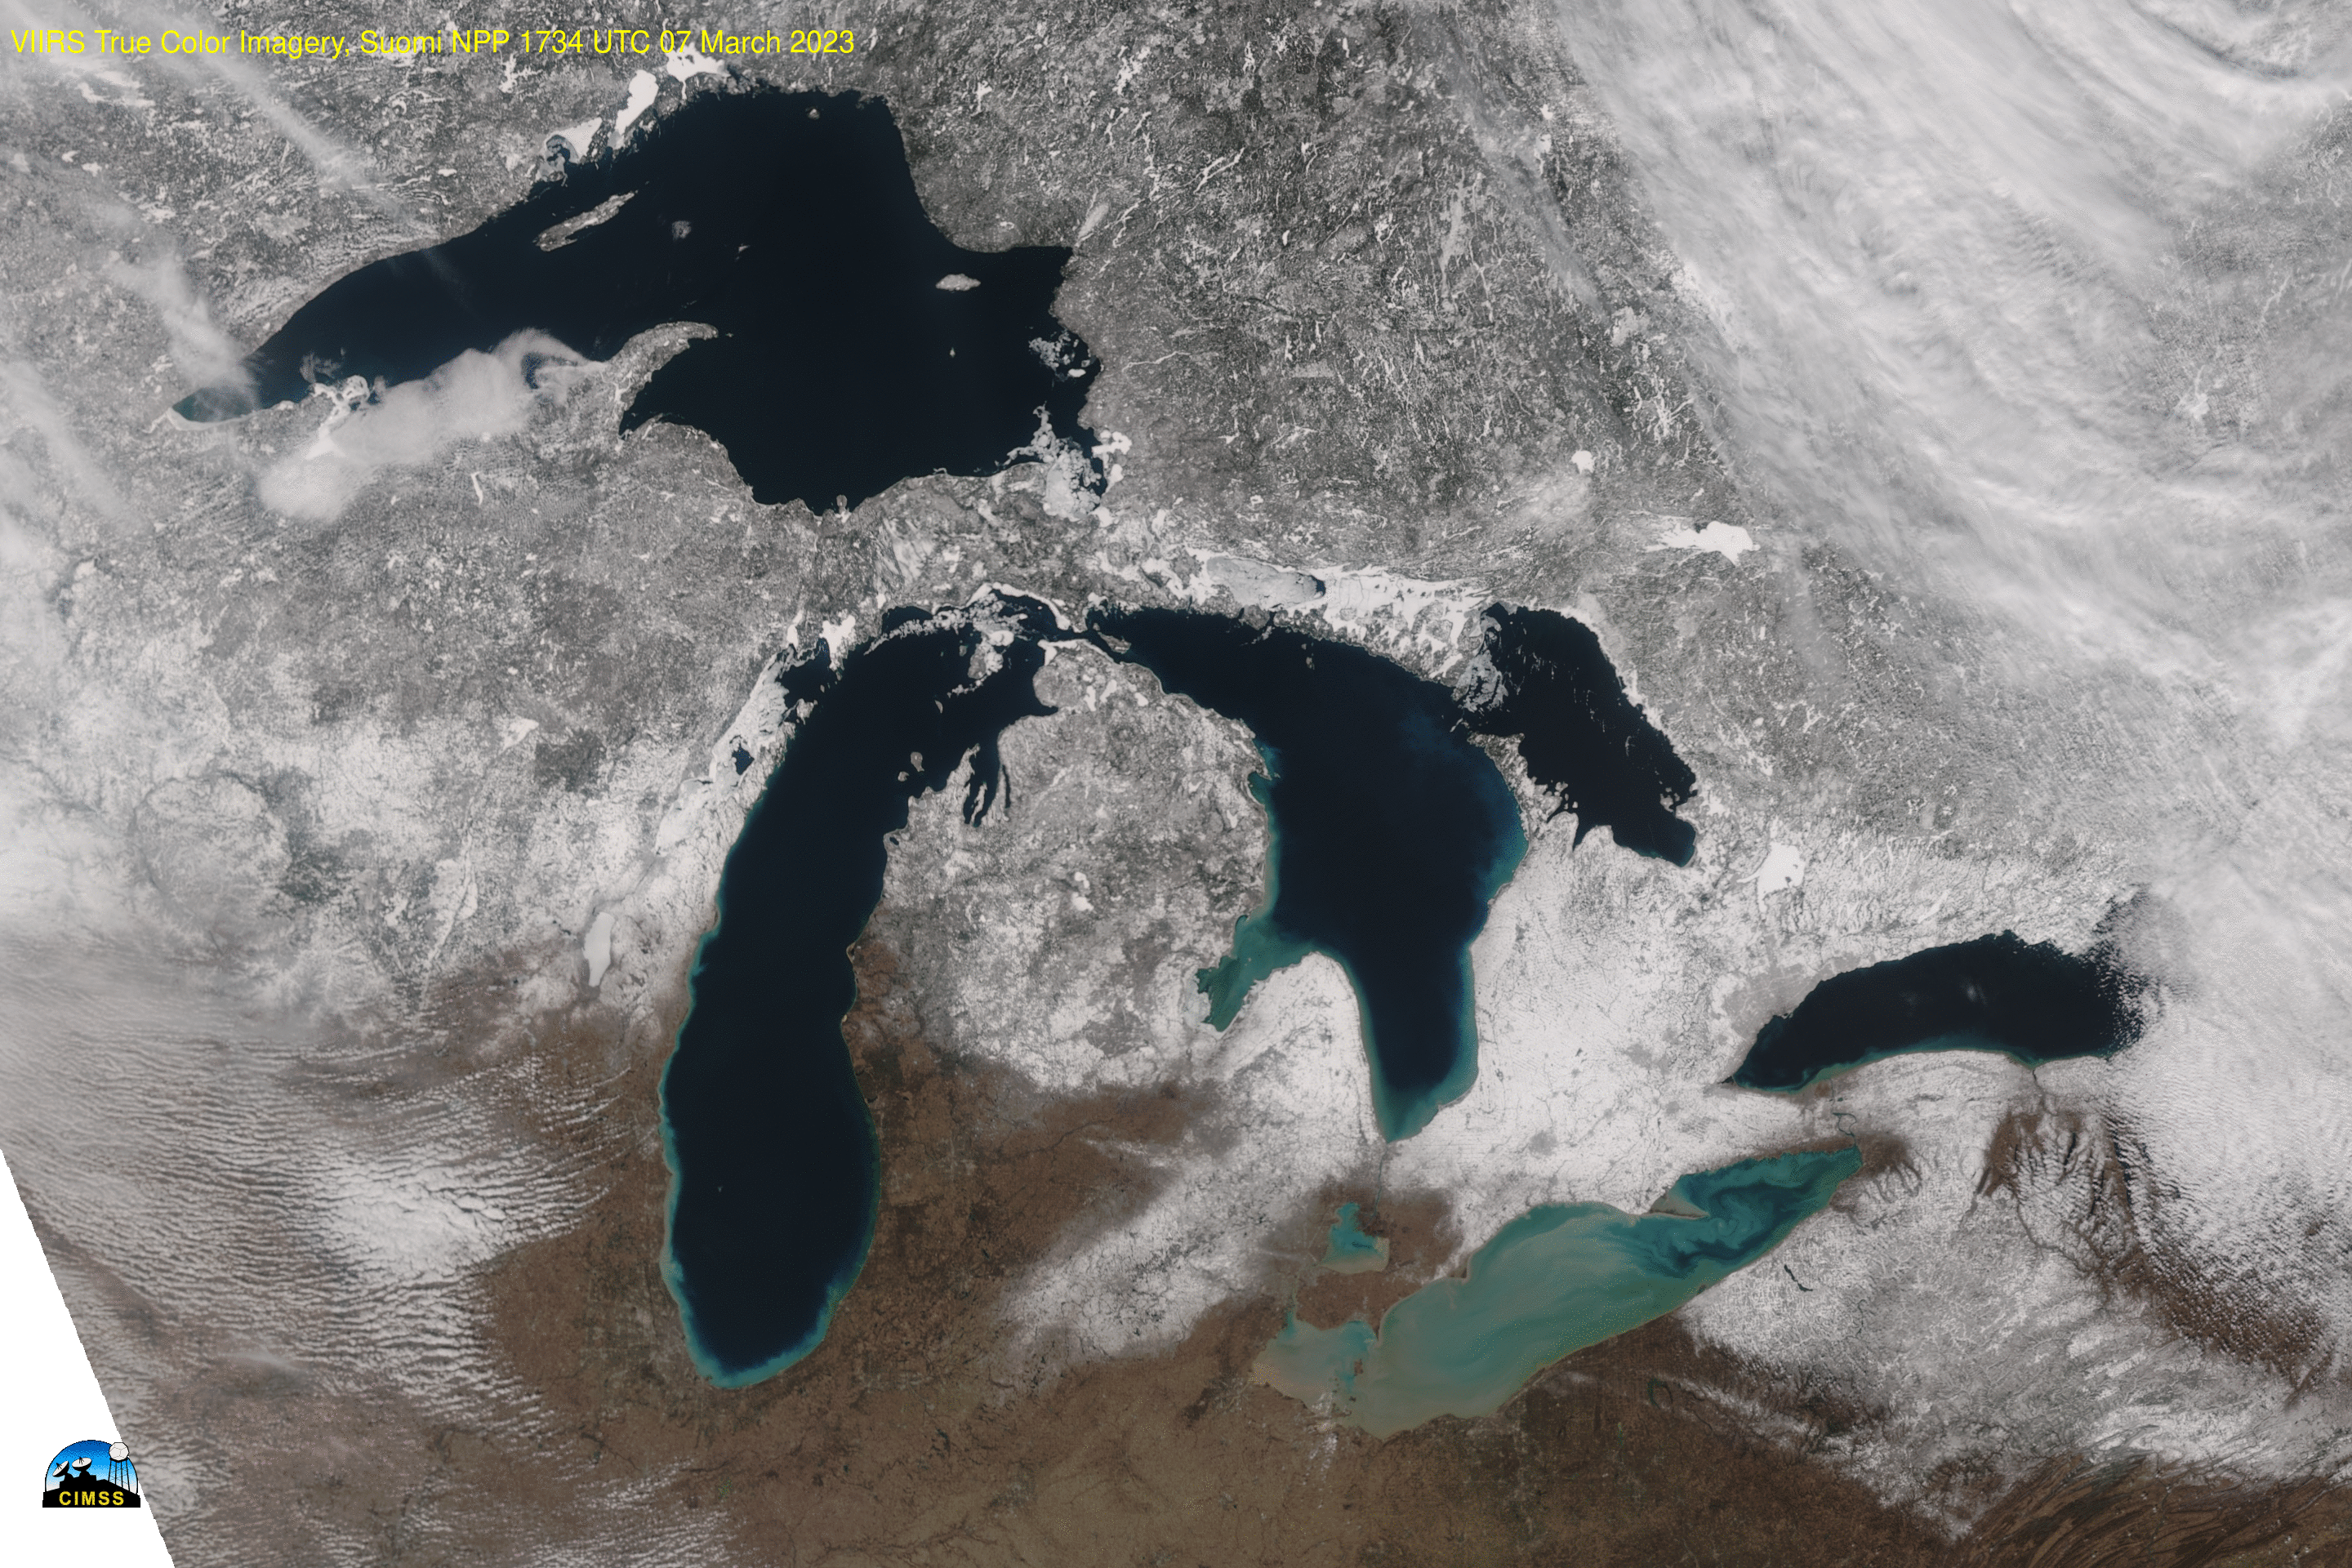
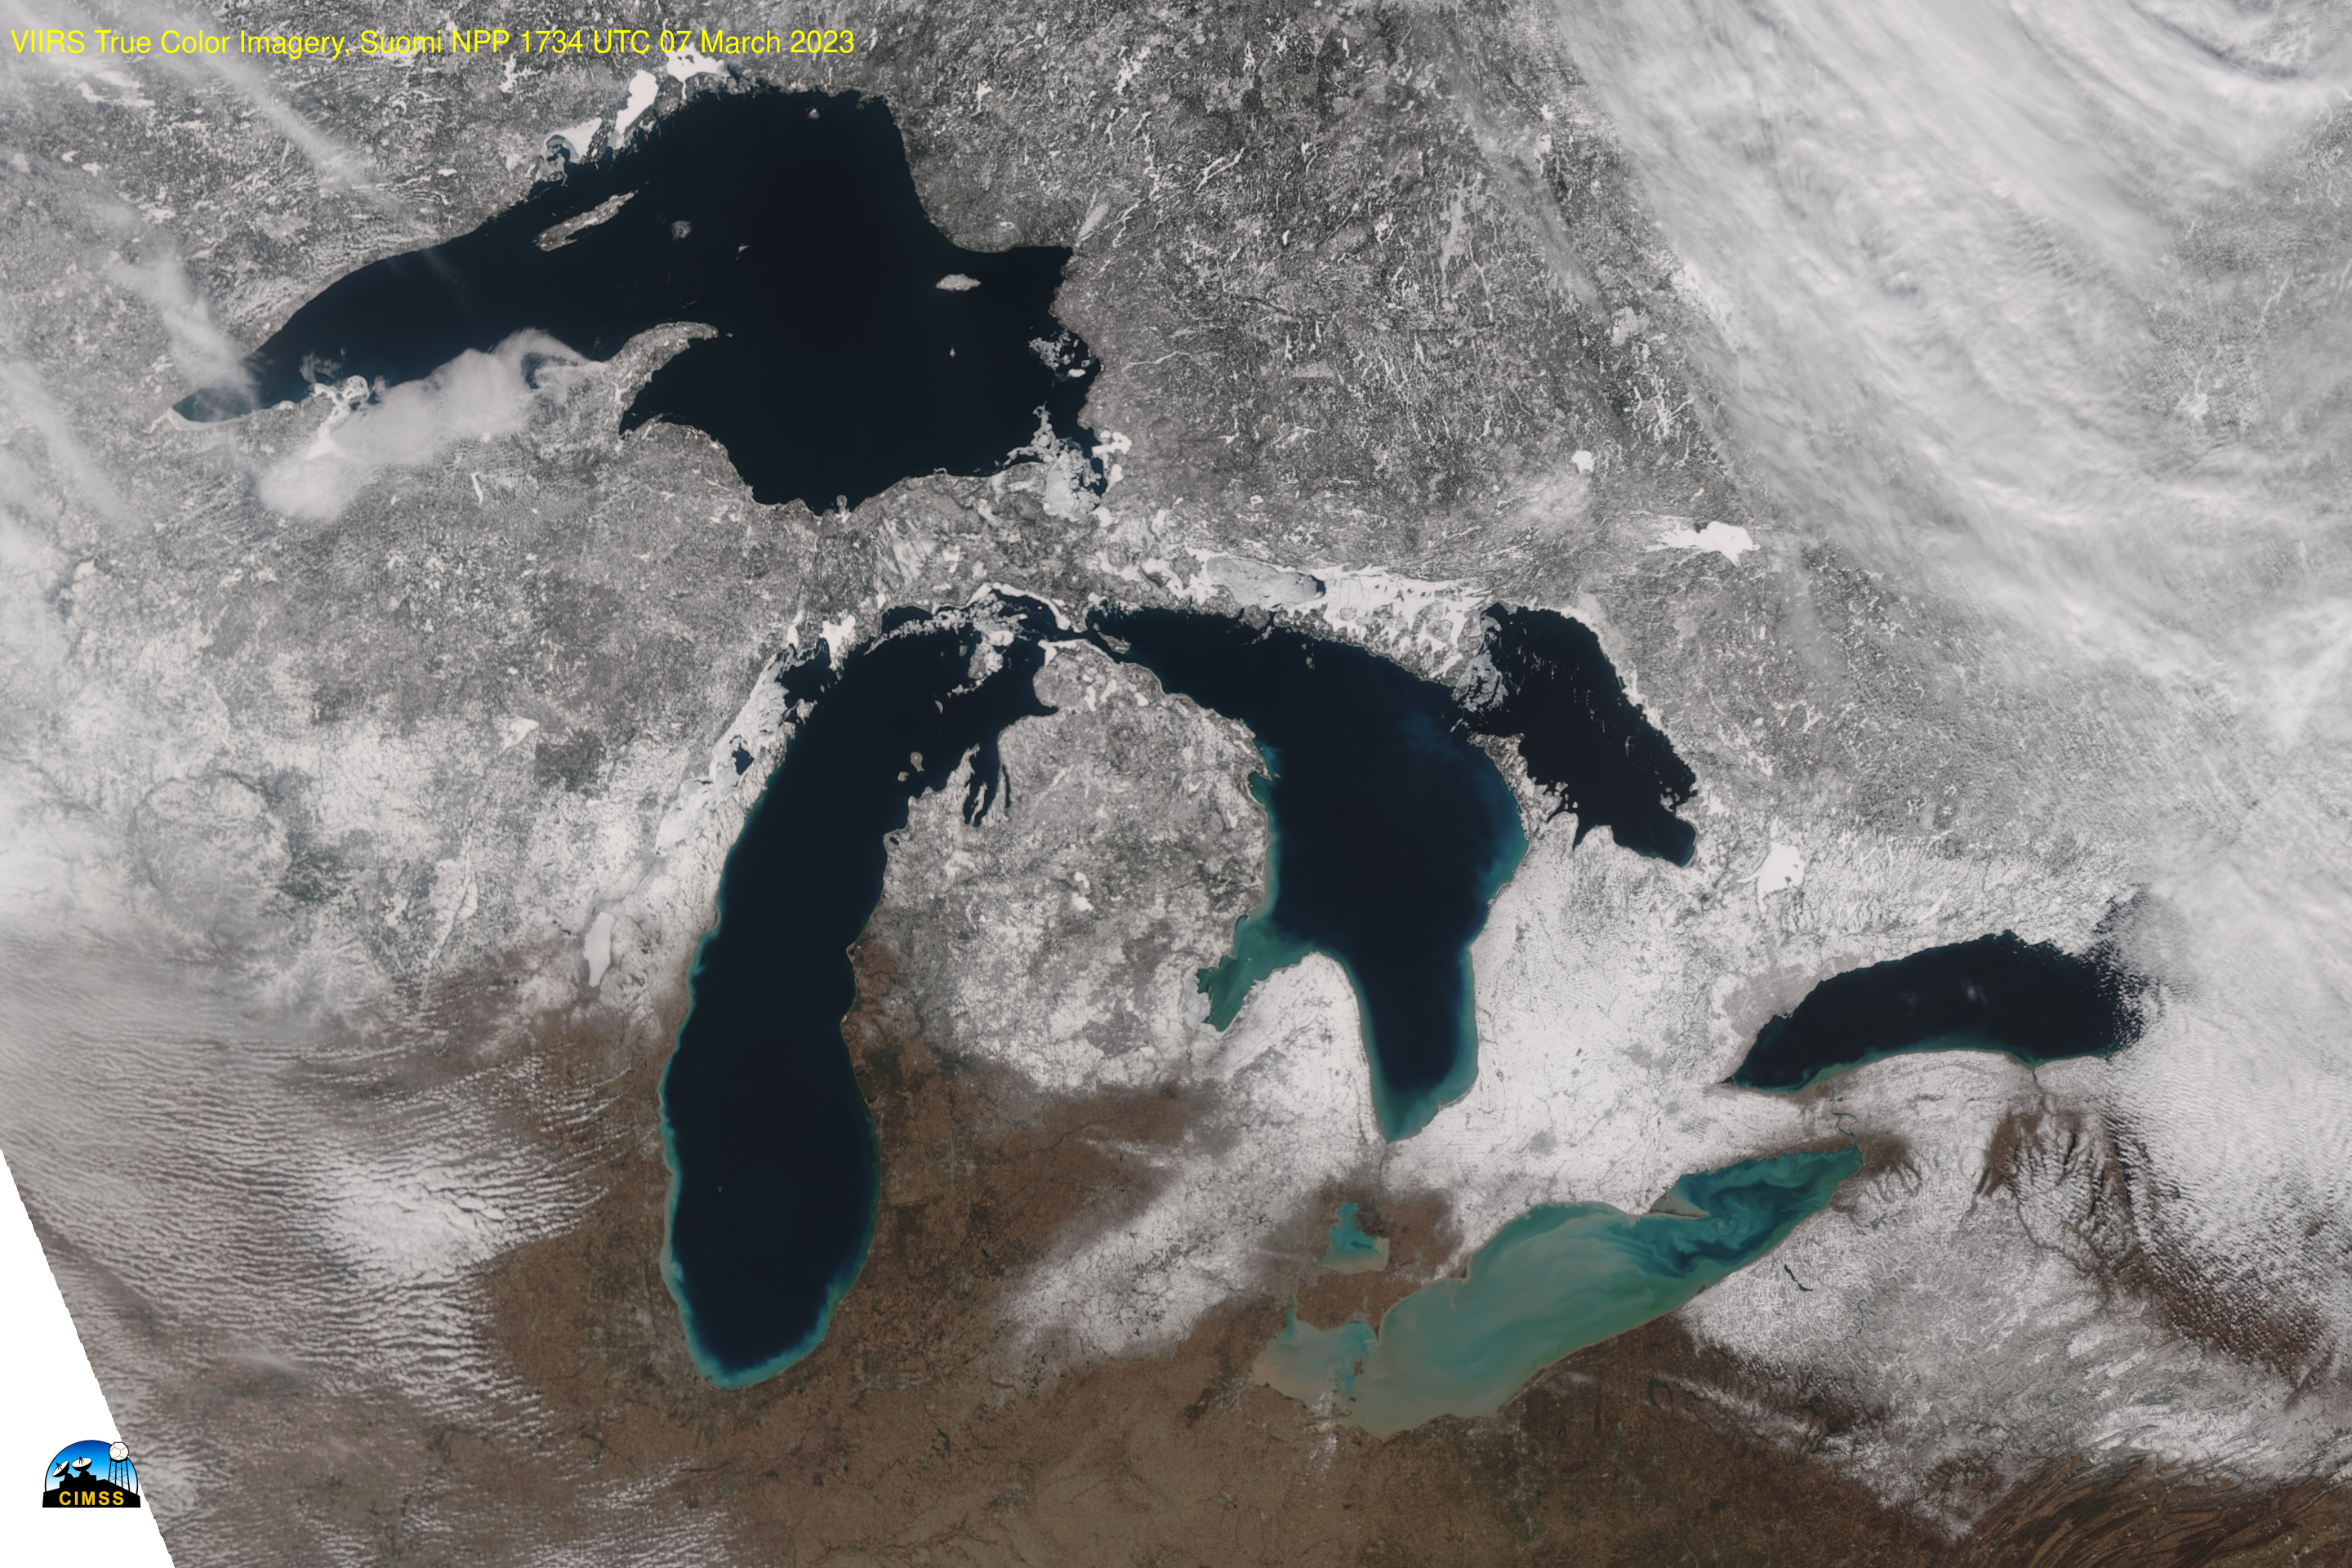
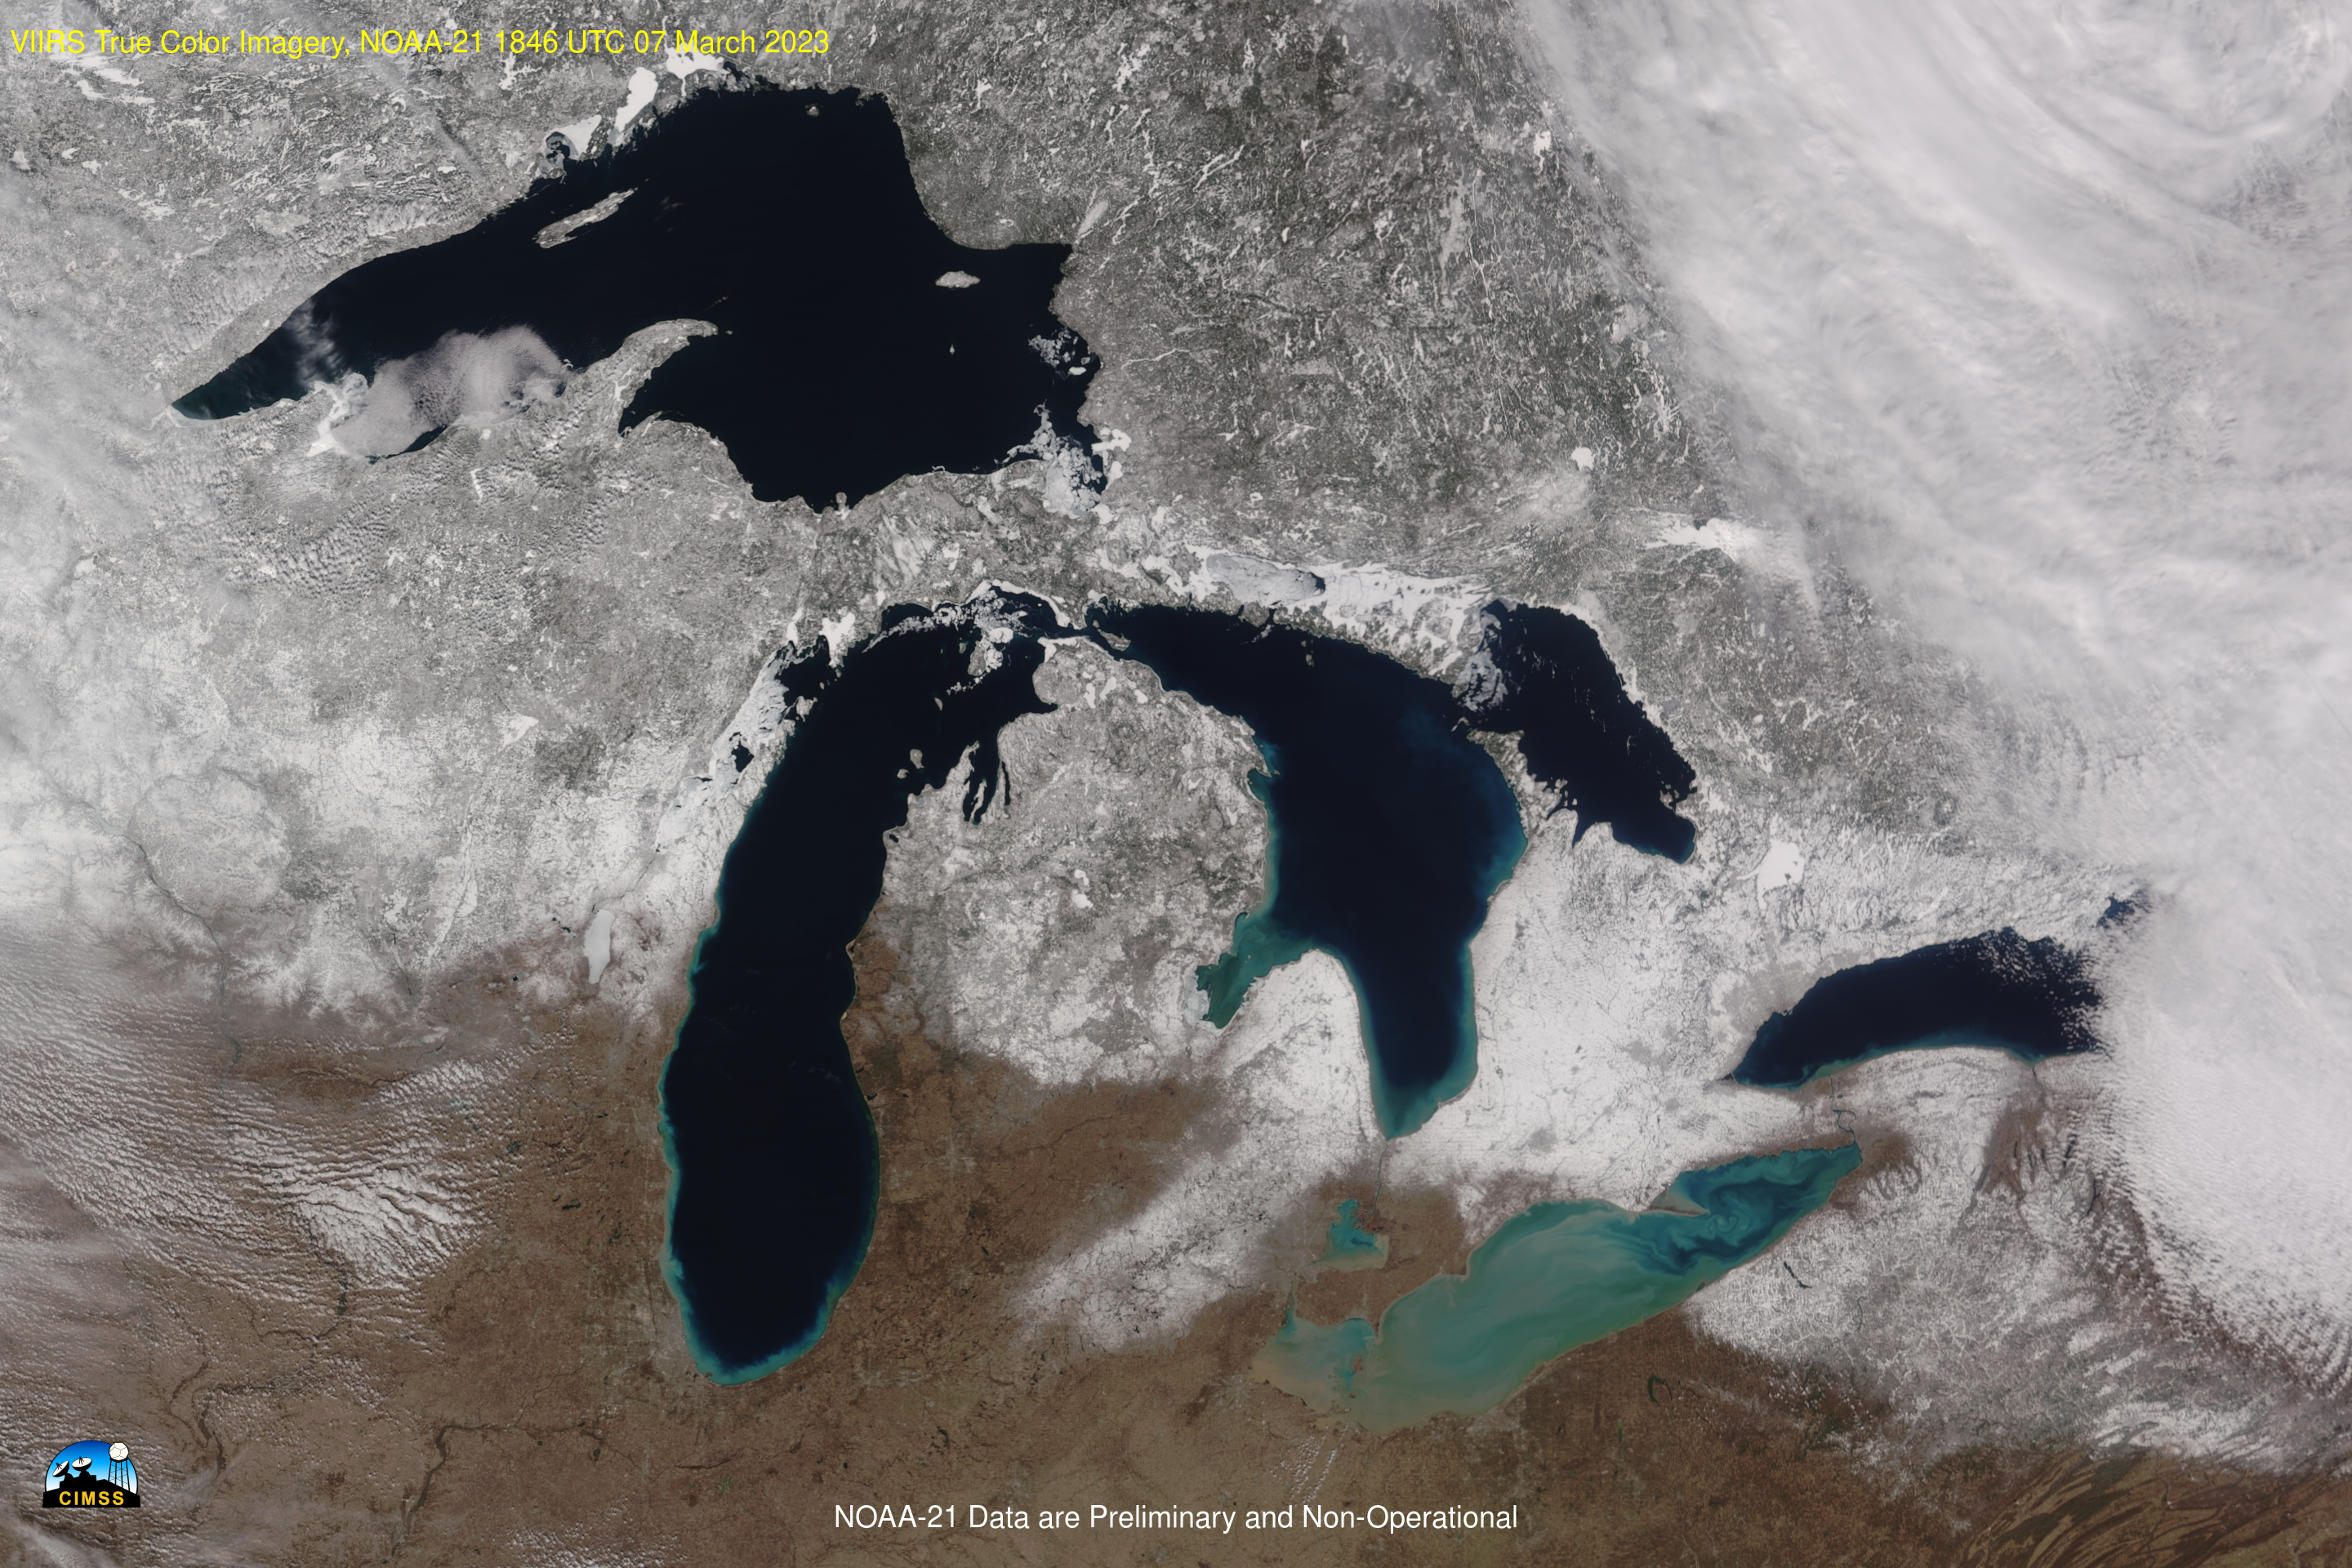
VIIRS True-Color imagery over the Great Lakes, 7 March 2023, from Suomi NPP (1734 UTC), NOAA-20 (1821 UTC) and NOAA-21 (1846 UTC). (Click to enlarge)
Note: NOAA-21 data used in this blog post are preliminary and non-operational. Imagery was created using Polar2Grid v3.0.
The CIMSS Community Satellite Processing Package (CSPP) team has released Polar2Grid version 3.0, a software package that can be used (among many other things!) to create high-quality imagery from JPSS Sensor Data Record (SDR) files as might be produced at a Direct Broadcast site (or ordered/downloaded from NOAA CLASS). Polar2Grid v3.0 represents a significant change from Polar2Grid v2.3, and some of those changes are documented here. The latest Polar2Grid also has significantly faster processing. The three true-color images above were created using Suomi NPP, NOAA-20 and NOAA-21 VIIRS imagery. (Note that NOAA-21 data are still preliminary and non-operational, although Beta maturity has been reached. They are included here to show that Polar2Grid can produce NOAA-21 imagery every bit as stunning as imagery from Suomi NPP and NOAA-20!). An especial advantage of 3 Polar Orbiters is obvious in the imagery above: the capability to animate high-resolution JPSS data.
Polar2Grid linux-based software can be downloaded from this website in the form of a gzipped tar file (Documentation on Polar2Grid is also available.) After expanding the downloaded file, and setting an environment file, i.e., export POLAR2GRID_HOME = /directory/where/software/sits, the various packages within $POLAR2GRID_HOME/bin can be run. To create the imagery above, I first created a map on which to reproject the data. This required the use of the p2g_grid_helper.sh scripts that creates the required navigation information in a format Polar2Grid recognizes. I wanted to create something that covered the Great Lakes because all 3 JPSS satellites — Suomi-NPP, NOAA-20 and NOAA-21 — scanned the entire Great Lakes in one swath on a relatively clear day. How will the three scenes compare? After some trial and error, I used this command
that created a grid (called ‘GreatLakes’) centered at 84oW, 45oN, with 500 m resolution in the N-S and E-W directions, with a grid size of 2880×1920. The information created was redirected into the file ‘GreatLakes.yaml’; Polar2Grid software by default now expects grid configuration files created by the p2g_grid_helper shell script to reside in files with a suffix of ‘yaml’.
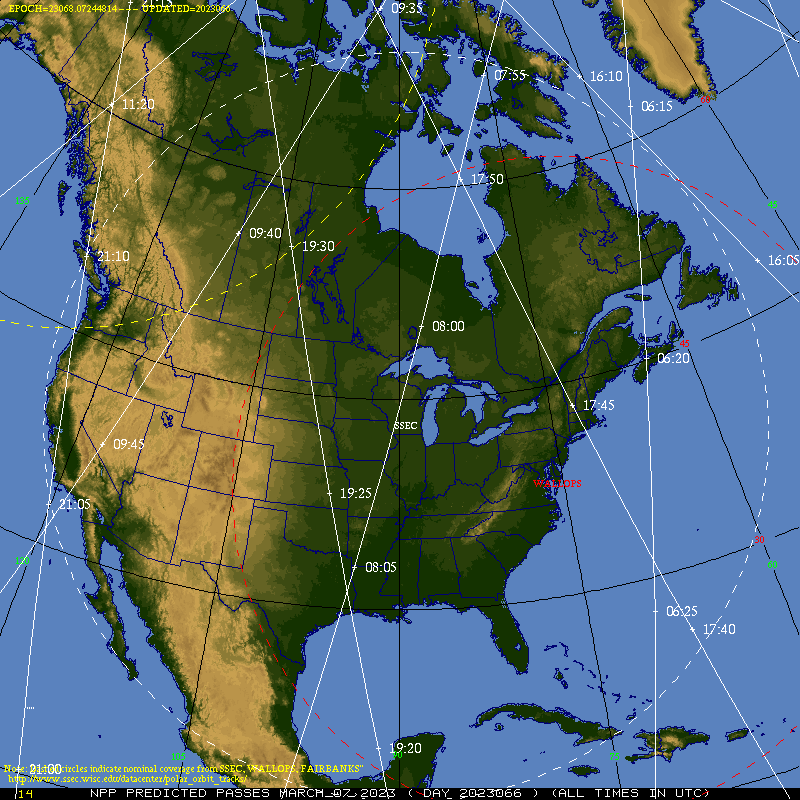
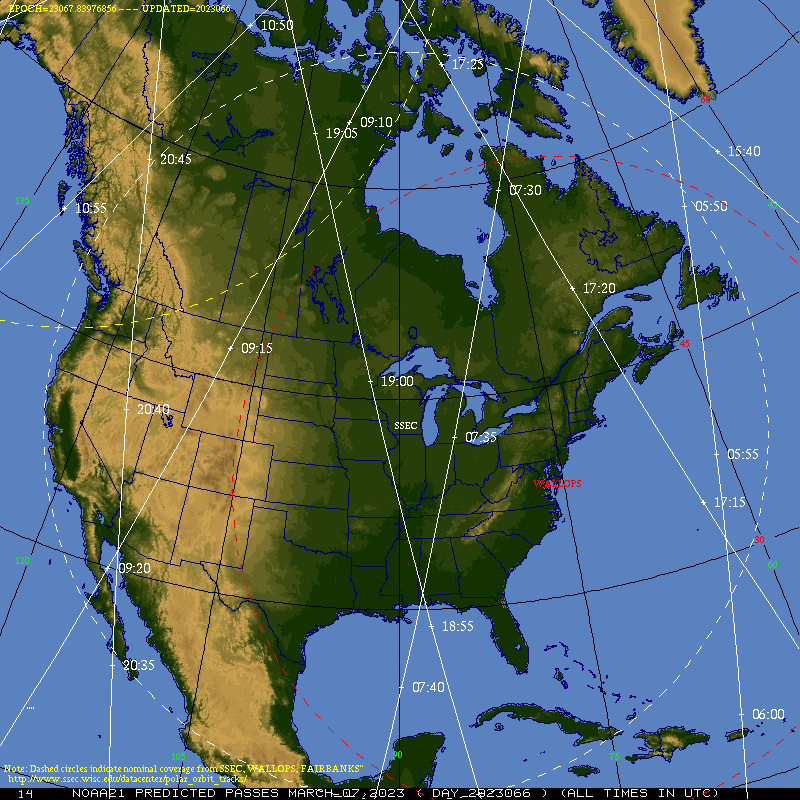
To acquire data for Polar2Grid to process, I accessed the CIMSS real-time system holding files created from the Direct Broadcast site. Data are separated out by satellite, and by day/time. Multiple granules are within each day/time file, especially now that CIMSS is producing expanded files by using data from other Direct Broadcast sites! Suomi NPP data for this case, for example, are at this link from 1734 UTC on 7 March; data from NOAA-20 are from 1821 UTC; data from NOAA-21 are from 1846 UTC. I could also have requested data from NOAA CLASS by selecting ‘JPSS VIIRS Sensor Data Record Operational (VIIRS_SDR) — although this site only distributes Operational data: NOAA-21 data are not available (yet). Usually when I access JPSS data from NOAA CLASS, I first view the orbits (from this website) for the day in question (7 March in this instance) for NPP, NOAA-20 and (eventually) NOAA-21, so I can access specific times that cover the region of interest.
Once the data were on the machine that holds the Polar2Grid software, it was straightforward to create imagery, using these commands for Suomi-NPP, NOAA-20 and NOAA-21 data, respectively; all the data were in the same directory:
Polar2Grid’s viirs_sdr reader (the -r flag) is being used, as is the geotiff writer (the -w flag). This syntax is different from earlier versions of Polar2Grid, but more in line with that in Geo2Grid. The data are being regridded (the -g flag) to a ‘GreatLakes’ grid, and grid configurations are stored within the ‘GreatLakes.yaml’ file. The product (-p flag) being created is ‘true_color’ and the data files (the -f flag) are found in the relative directory specified. If a user is unsure of what products can be created given the data in the data directory, the –list-products-all instruction can be used in place of -p to find that out.
The three commands above create (spectacular!!) True-Color imagery from Suomi-NPP, NOAA-20 and NOAA-21, seen in the animation above. Polar2Grid can also be used to add maps to the imagery, but this blogger thought those weren’t necessary.
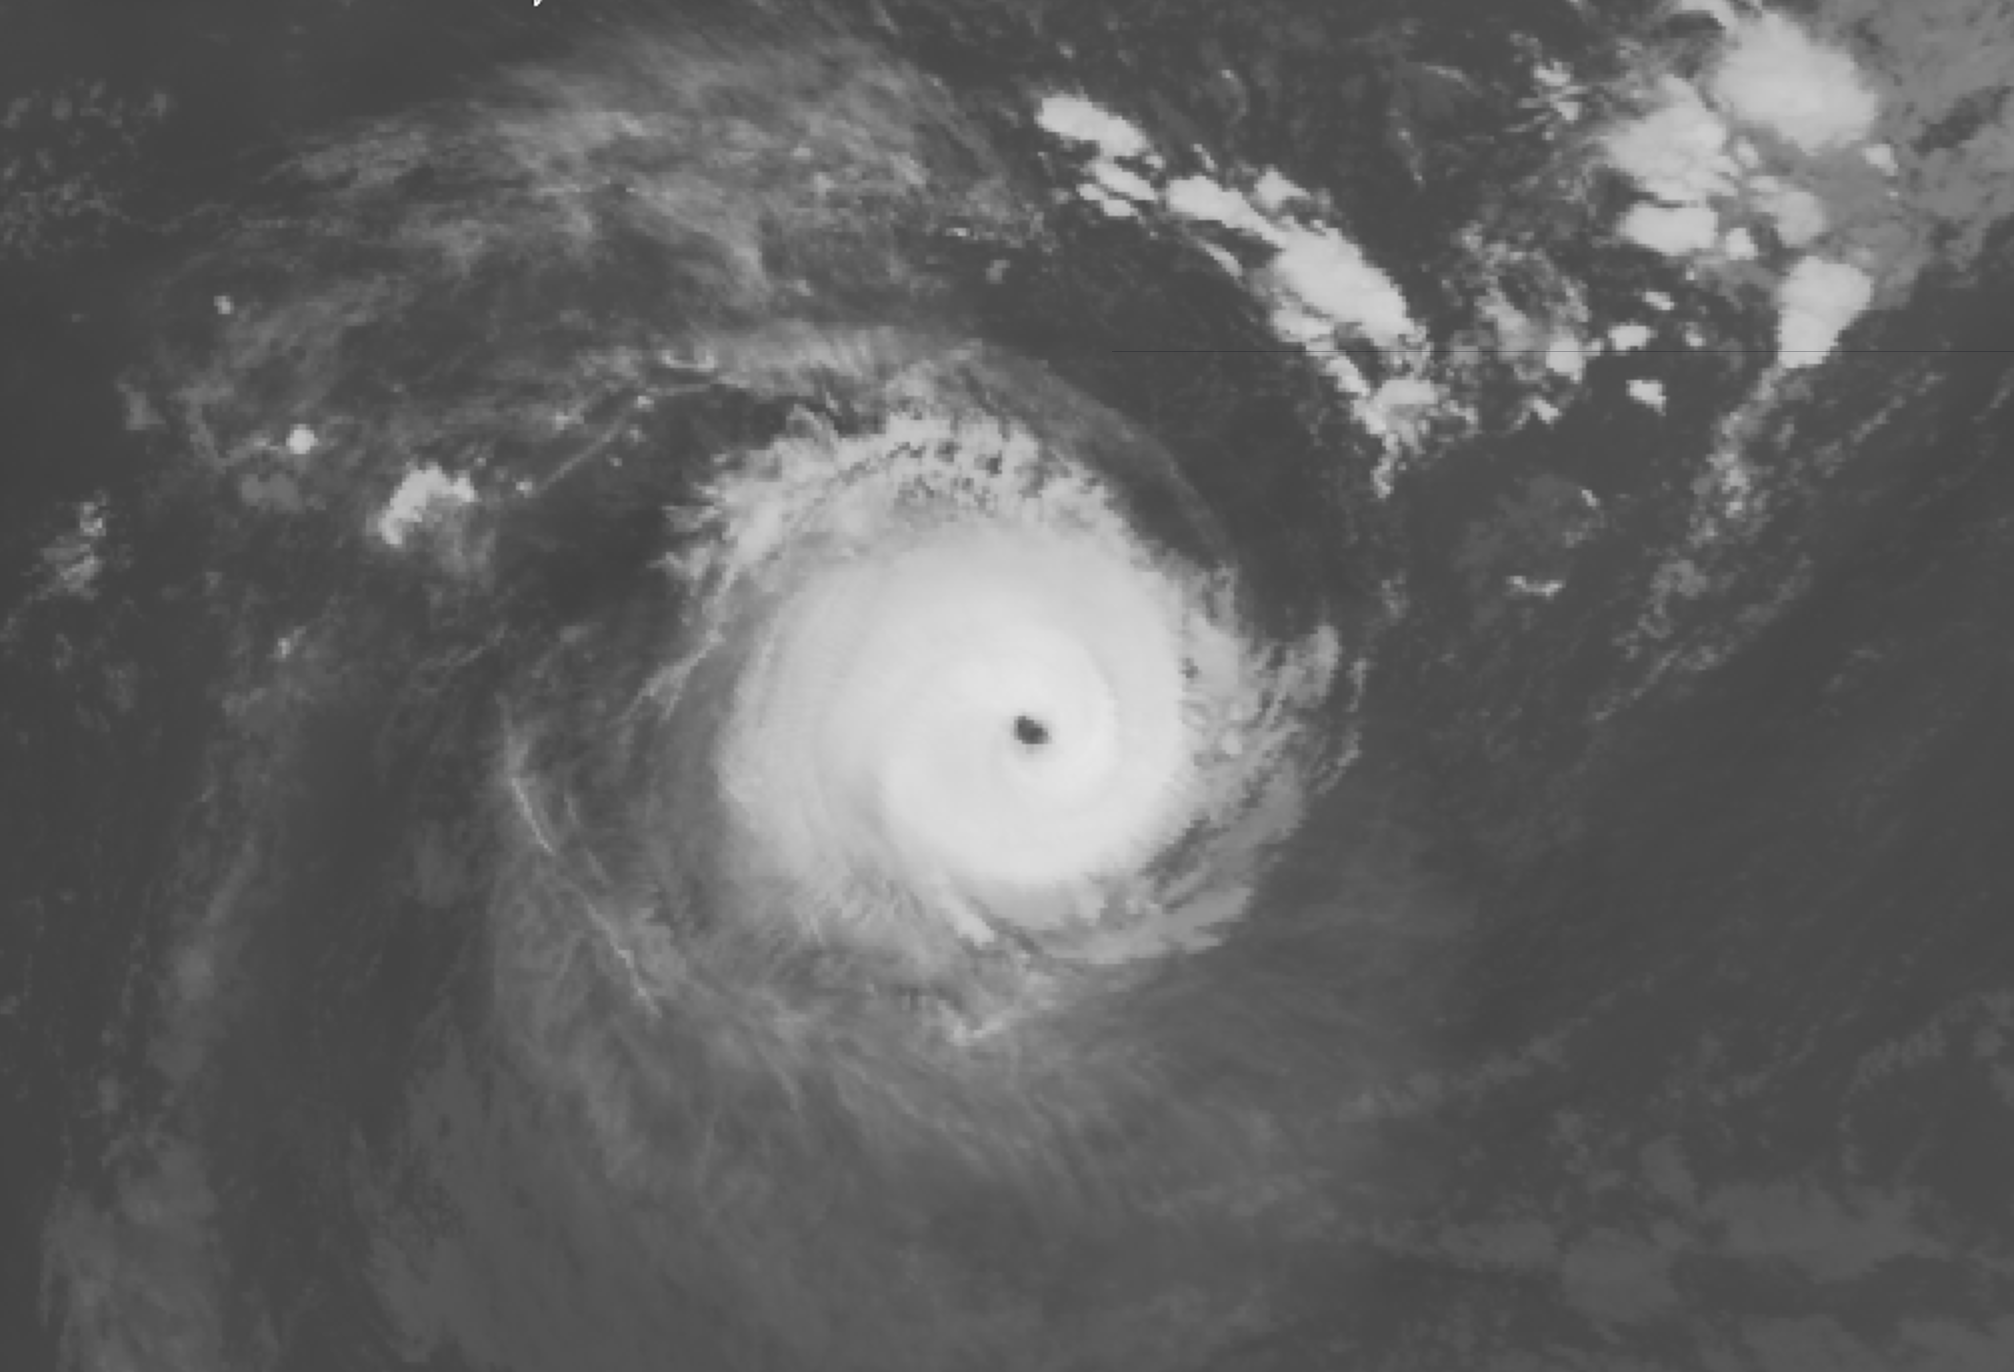
Cyclone Freddy in the Indian Ocean continues to persist and is situated along the southwest coast of Madagascar. It is currently crossing the Mozambique channel for the third time. Freddy intensified to a Category 5 storm on 2023-02-15. It is now listed... Read More
Cyclone Freddy in the Indian Ocean continues to persist and is situated along the southwest coast of Madagascar. It is currently crossing the Mozambique channel for the third time. Freddy intensified to a Category 5 storm on 2023-02-15. It is now listed as a Category 2 storm.
Cyclone Freddy’s path across the Indian Ocean from 2023-02-14 to 2023-03-07 displayed in RealEarth.
A three-week animation made in RealEarth shows Cyclone Freddy’s long life and unusual path between Madagascar and Mozambique. The animation shows infrared satellite data every half day (every twelve hours) from 2023-02-14 to 2023-03-07. The storm first travels west across the Indian Ocean, changes in intensification once it makes landfall, and eventually gains its cyclonic structure back. The Global Infrared display product in RealEarth is archived quite far back compared to other display products, making it useful for tracking storms over multiple days or weeks. You can revisit this Cyclone Freddy animation in RealEarth and other weather data products.
The CSPP Geo project released (linux-based) Gridded GLM software version 1.0 (available for download here) in December of 2022 (This previous CIMSS Blog post discussed a beta version of that software). CSPPGeo Gridded GLM software (Documentation is available here) takes Lightning Cluster Filter Algorithm (LCFA) files and converts the Flash/Event/Group data therein to gridded fields that... Read More
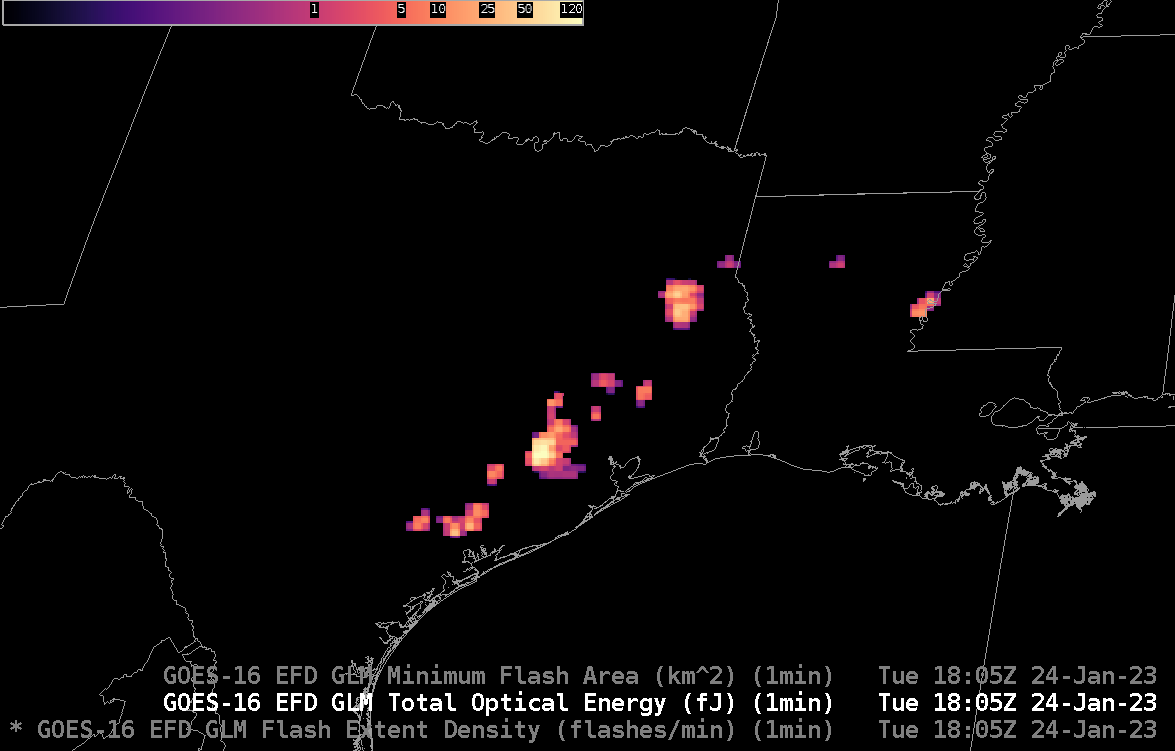
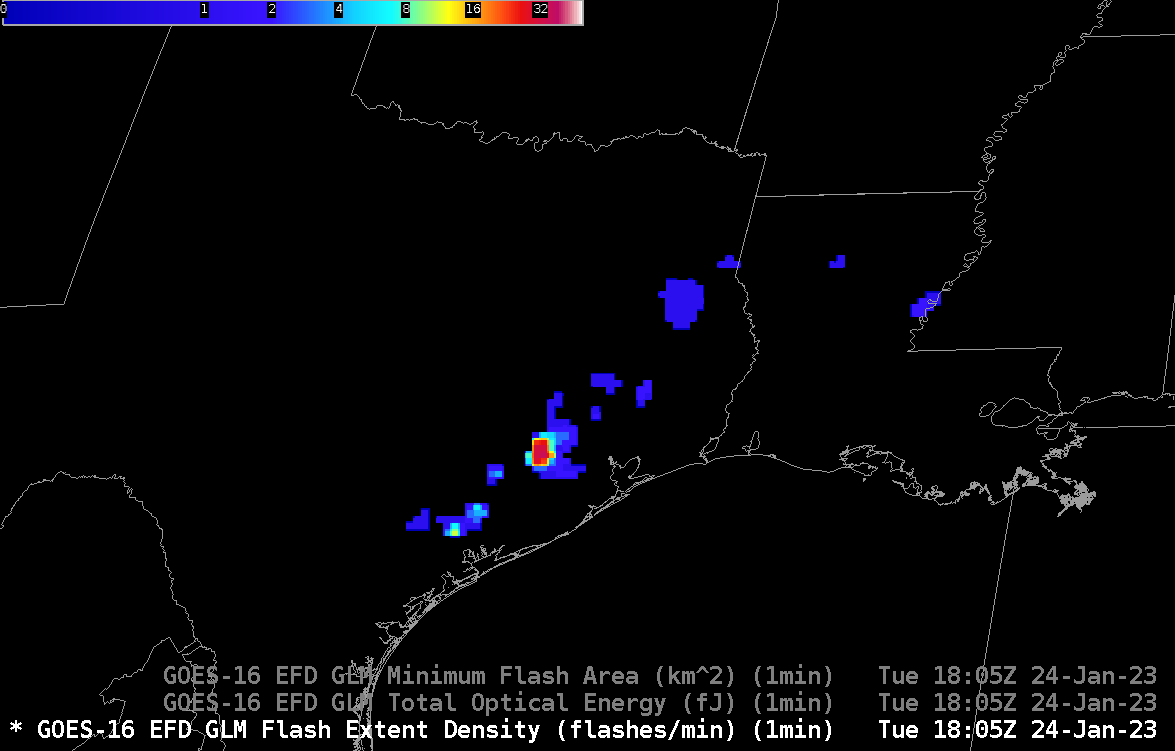
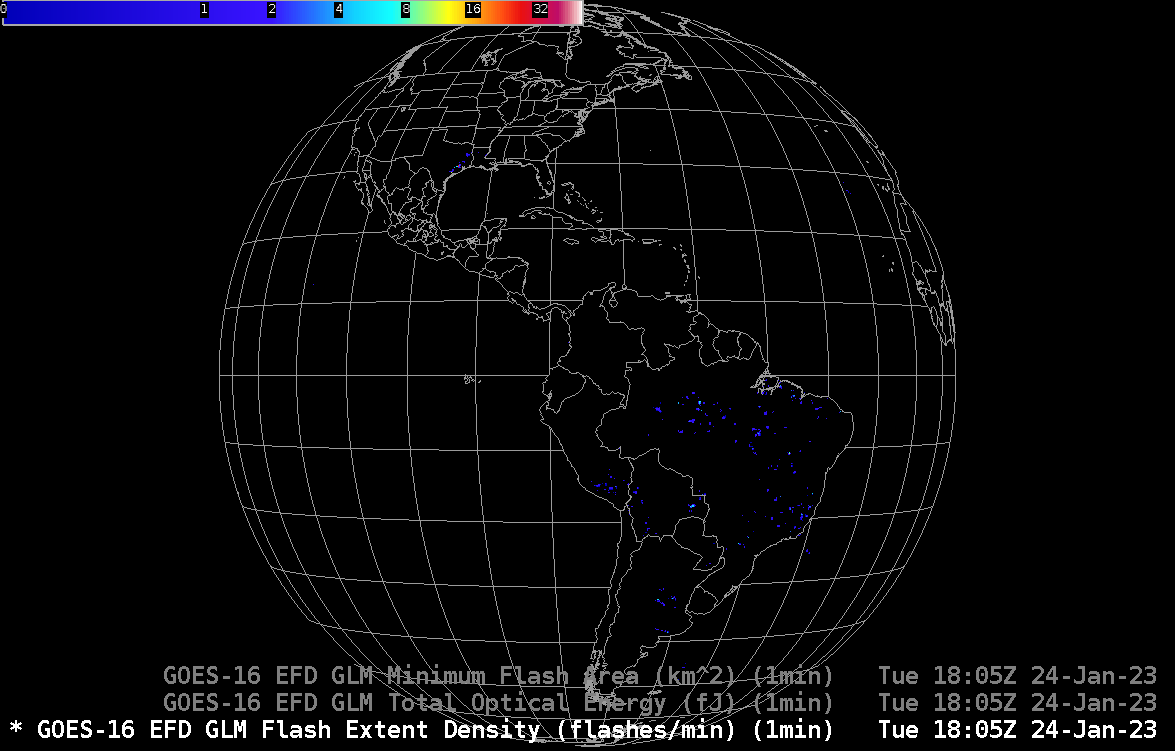
GOES-16 GLM Observations of Flash Extent Density (FED), Minimum Flash Area (MFA) and Total Optical Energy (TOE), 1804-1805 UTC on 24 January 2023 (Click to enlarge)
The CSPP Geo project released (linux-based) Gridded GLM software version 1.0 (available for download here) in December of 2022 (This previous CIMSS Blog post discussed a beta version of that software). CSPPGeo Gridded GLM software (Documentation is available here) takes Lightning Cluster Filter Algorithm (LCFA) files and converts the Flash/Event/Group data therein to gridded fields that can be displayed with AWIPS, or with geo2grid, or with other display systems. The gridding algorithms use open-source software such as glmtools developed by Eric Bruning at Texas Tech and colleagues. Output gridded fields include Flash Extent Density, Total Optical Energy, Minimum Flash Area,
Where do the GLM L2+ (i.e., LCFA) files necessary for input into gridded GLM originate? They might come from the GOES Re-Broadcast (GRB) datastream: Direct broadcast users who receive the GOES-East or GOES-West GRB stream on an antenna can run the CSPPGeo GRB software package to generate GLM L2+ and other GOES-R series products in near real-time; any user can download LCFA files from NOAA CLASS by choosing ‘GOES-R Series GLM L2+ Data Product (GRGLMPROD)’; LCFA files are also available via Amazon Web Services, via this handy portal (for example). One could generate data from multiple sources to guard against a data outage in one or more GLM L2+ data feeds!
LCFA files typically have a time cadence of three per minute. For example, the first 12 LCFA files created from GOES-18 on 7 March 2023, that is, the 66th day of year 2023, are shown below. The first file name includes a string that indicates when the data within the file starts, ends, and when it was created s20230660000000_e20230660000200_c20230660000214. Data in that files starts on day 066 of 2023 at 00:00:00 and ends at 00:00:20; that data file was created at 00:00:21.4. The next file contains data between 00:00:20.0 and 00:00:40.0, then from 00:00:40.0 to 00:01.000, and so on.
Download the (gzipped and tared) gridded GLM software from here (free registration may be required). The call to create the gridded GLM data is straightforward, for example, as shown below using GOES-16 data from 24 January 2023:
sh ./cspp-geo-gglm.sh /path/to/LCFAfiles/accessible/by/your/machine/OR_GLM-L2-LCFA_G16_s20230241804*.nc
This will create the 1-minute aggregate GLM fields valid at 1804 UTC (that is, showing data from 1804 to 1805 UTC) on 24 January 2023, Fields created include Flash Extent Density (FED), Flash Centroid Density (FCD), Average Flash Area (AFA), Total Energy (TOE), Group Extent Density (GED), Group Centroid Density (GCD), Average Group Area (AGA) and Minimum Flash Area (MFA). Gridded GLM software expects that the unix wildcarding will match 3 LCFA files, in the case above from 18:04:00 to 18:04:20, 18:04:20 to 18:04:40 and 18:04:40 to 18:05:00. If one of the three files within the minute are missing, no gridded GLM output is produced, and an error message is produced. In the successful case above, the file created has this name: CG_GLM-L2-GLMF-M3_G16_s20230241804000_e20230241805000_c20230661822210.nc ; note the creation date is 1822 UTC on 7 March, the day I prepared this blog post. By default a Full Disk file is created. However, by adding a -t flag (or using –create-tiles), AWIPS-compatible “punctured” tiles are created, along with statistics files that describe the tiles fully. Amending the command above to include tile-generation
sh ./cspp-geo-gglm.sh -t /arcdata/goes_restricted/grb/goes16/2023/2023_01_24_024/glm/L2/LCFA/OR_GLM-L2-LCFA_G16_s20230241804*
still yields the same file as the first call (although it has a different creation date, so the file name is a bit different), but additional files are created, as listed below. These tiles can then be input into AWIPS and displayed as 1-minute aggregates of various GLM gridded products. The statistics file that describes the tiles is also created. The Global view from these tiled data are shown below, and the same data but zoomed in over Texas are shown above. Note that the data are timestamped in AWIPS as 1805 UTC, the time at which the GLM data ends.
GOES-16 GLM Observations of Flash Extent Density (FED), Minimum Flash Area (MFA) and Total Optical Energy (TOE), 1804-1805 UTC on 24 January 2023 (Click to enlarge)
Version 1.0 of gridded GLM allows a user to wildcard more than 1 minute of data at a time. For example, the command “sh ./cspp-geo-gglm.sh /pathToGLMdata/2023/2023_01_24_024/glm/L2/LCFA/OR_GLM-L2-LCFA_G16_s2023024180[4,5,6,7]*” created four 1-minute GLMF netcdf files.
Coming soon: How to display the gridded GLM data using geo2grid.

