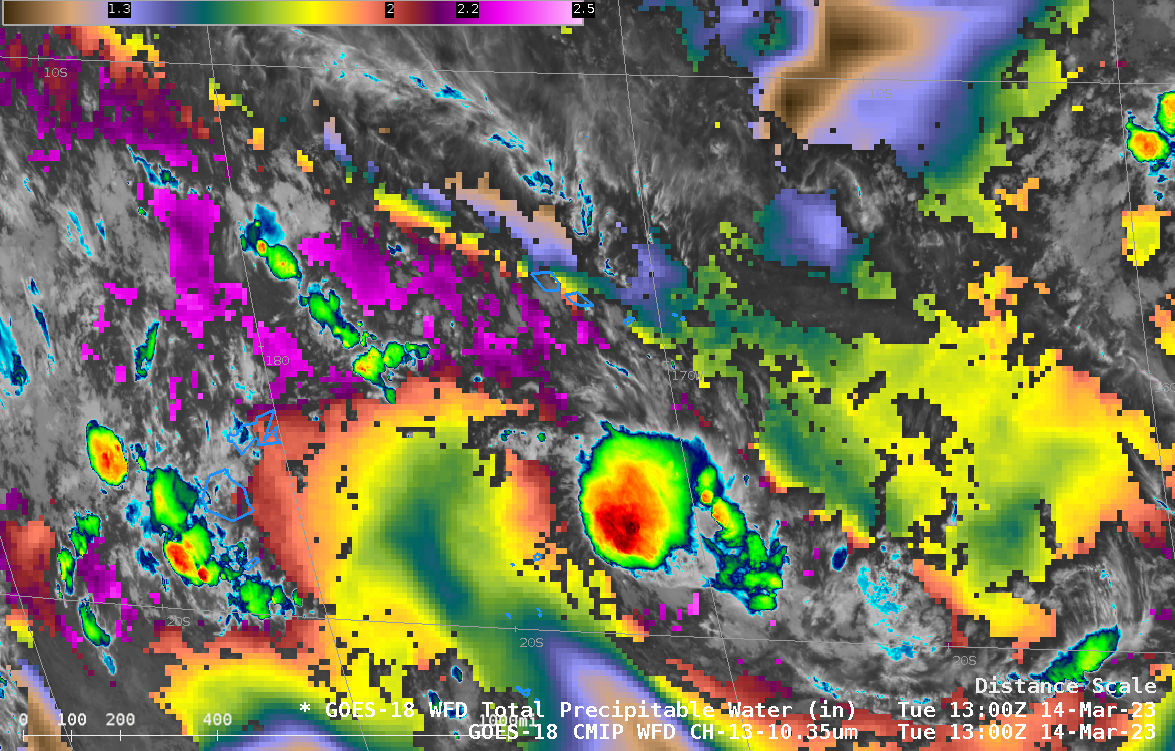
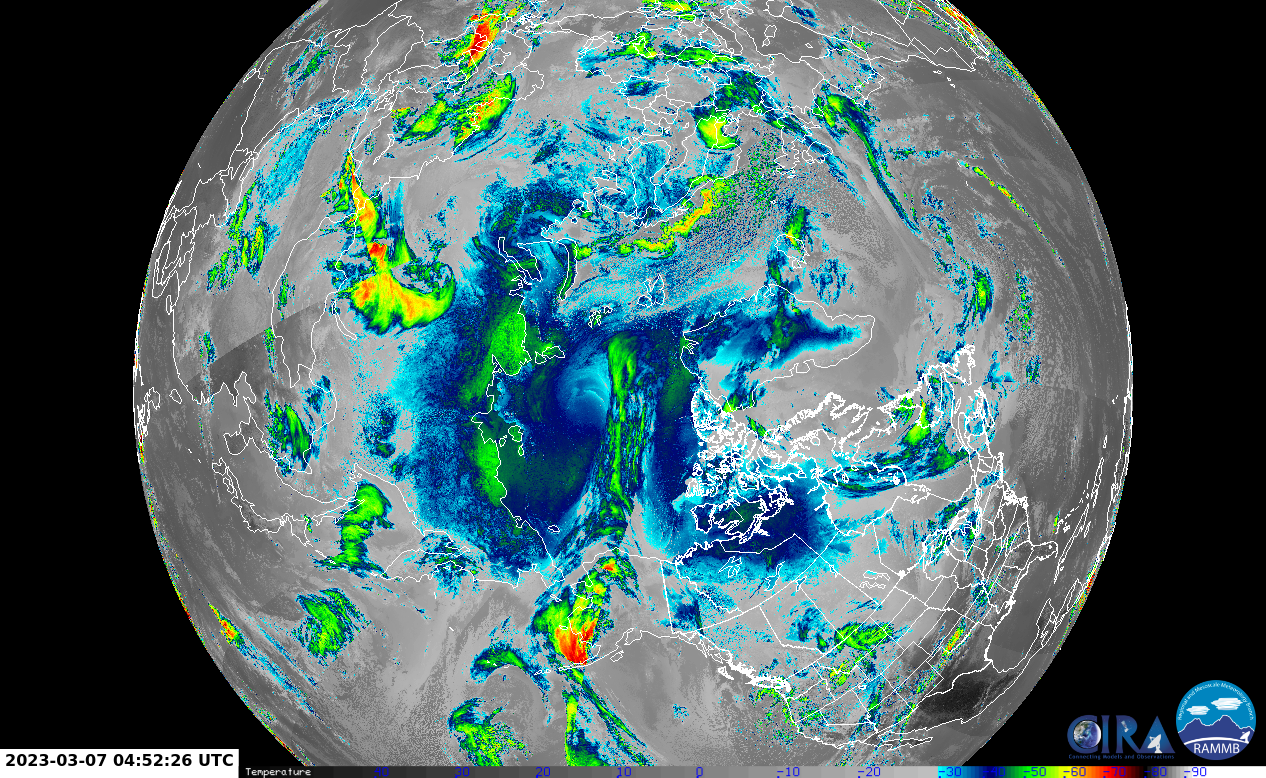
If you see something, like a blog post for example (link, this shows an airmass high in Total Precipitable Water crossing the North Pole) and you’re curious what JPSS satellite imagery might look like with that something, how can you proceed? If the data are in the recent past, one could, for example, refer to the CIRA Polar slider and download an image, like this one that is time-stamped 0452 UTC on 7 March. That image, however, will not be full-resolution, and there are limits to what can be created. This blog post steps you through ways to figure out which JPSS data to download, and how to access it via NOAA CLASS, and how to display it with Polar2Grid (version 3.0, discussed in this previous blog post).
The first step is to find the times that Suomi NPP, or NOAA-20, or (eventually) NOAA-21 overflew the region. Satellite orbits are available here. The date in question is 7 March, and there are archived images for NPP, NOAA-20 and NOAA-21. Paths over the Arctic for NPP are shown below (link, here’s the similar image for NOAA-20), and the path from 1425 through 1445 UTC from Suomi NPP looks appropriate.
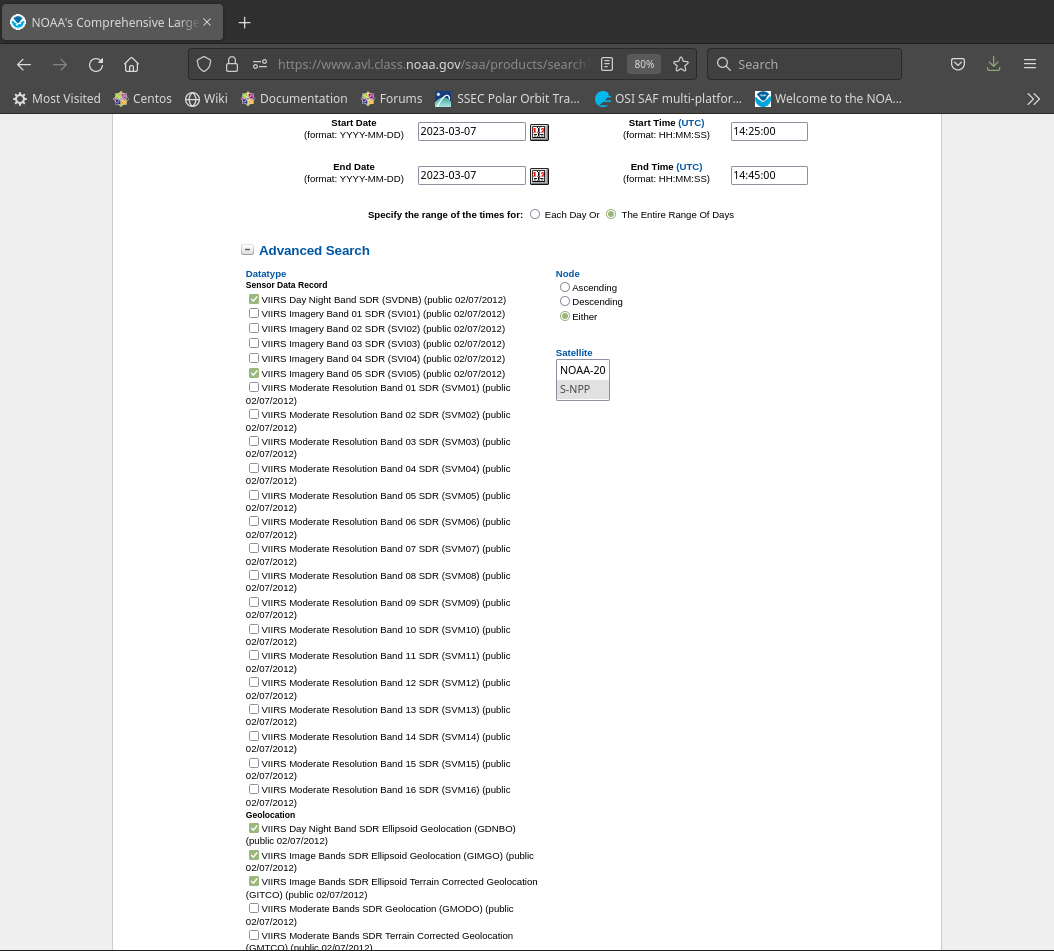
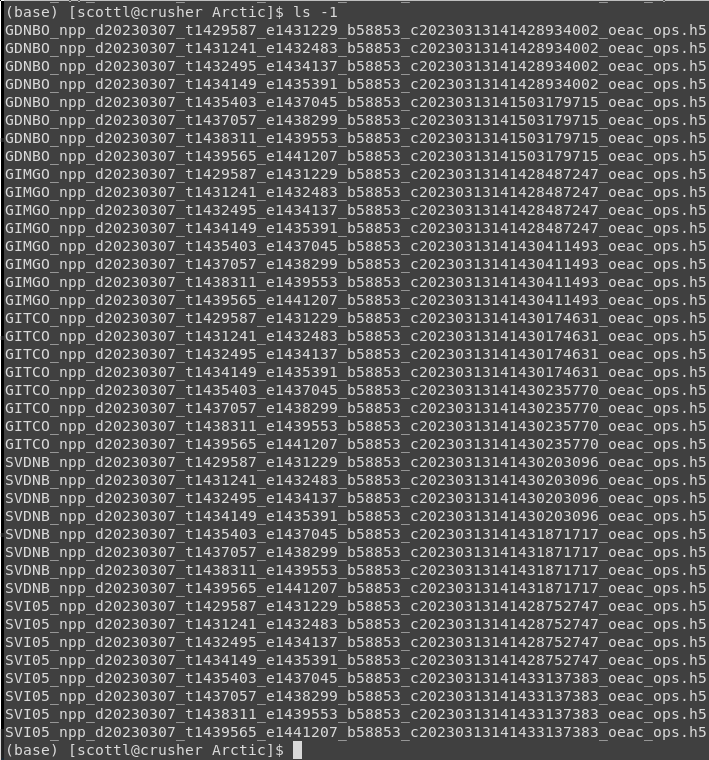
The next step is to access data at NOAA CLASS. We will request ‘JPSS VIIRS Sensor Data Record Operational (VIIRS_SDR)’ data. That takes you to a page that looks like this, where I have selected NPP data from 14:25 to 14:45 on 7 March 2023, from either ascending or descending passes. The Data I selected were Day Night Band (SVDNB) and I05 (SVI05) SDRs, as well as the navigation files that are needed: GDNBO, GIMGO and GITGO files. After some time, an email announces that the files are ready for download. Here is the listing after they’d been placed on my machine with the Polar2Grid software. There are eight files each of GDNBO, GIMGO, GITCO, SVDNB and SVI05 files, i.e., eight granules of data and navigation information within one directory. Note: As part of my NOAA CLASS preferences/profile, I have ‘No’ clicked for ‘Package Geolocation with JPSS Data Products’ and ‘Yes’ clicked for ‘De-aggregate JPSS Data Products’. Now it’s time to create imagery using Polar2Grid.
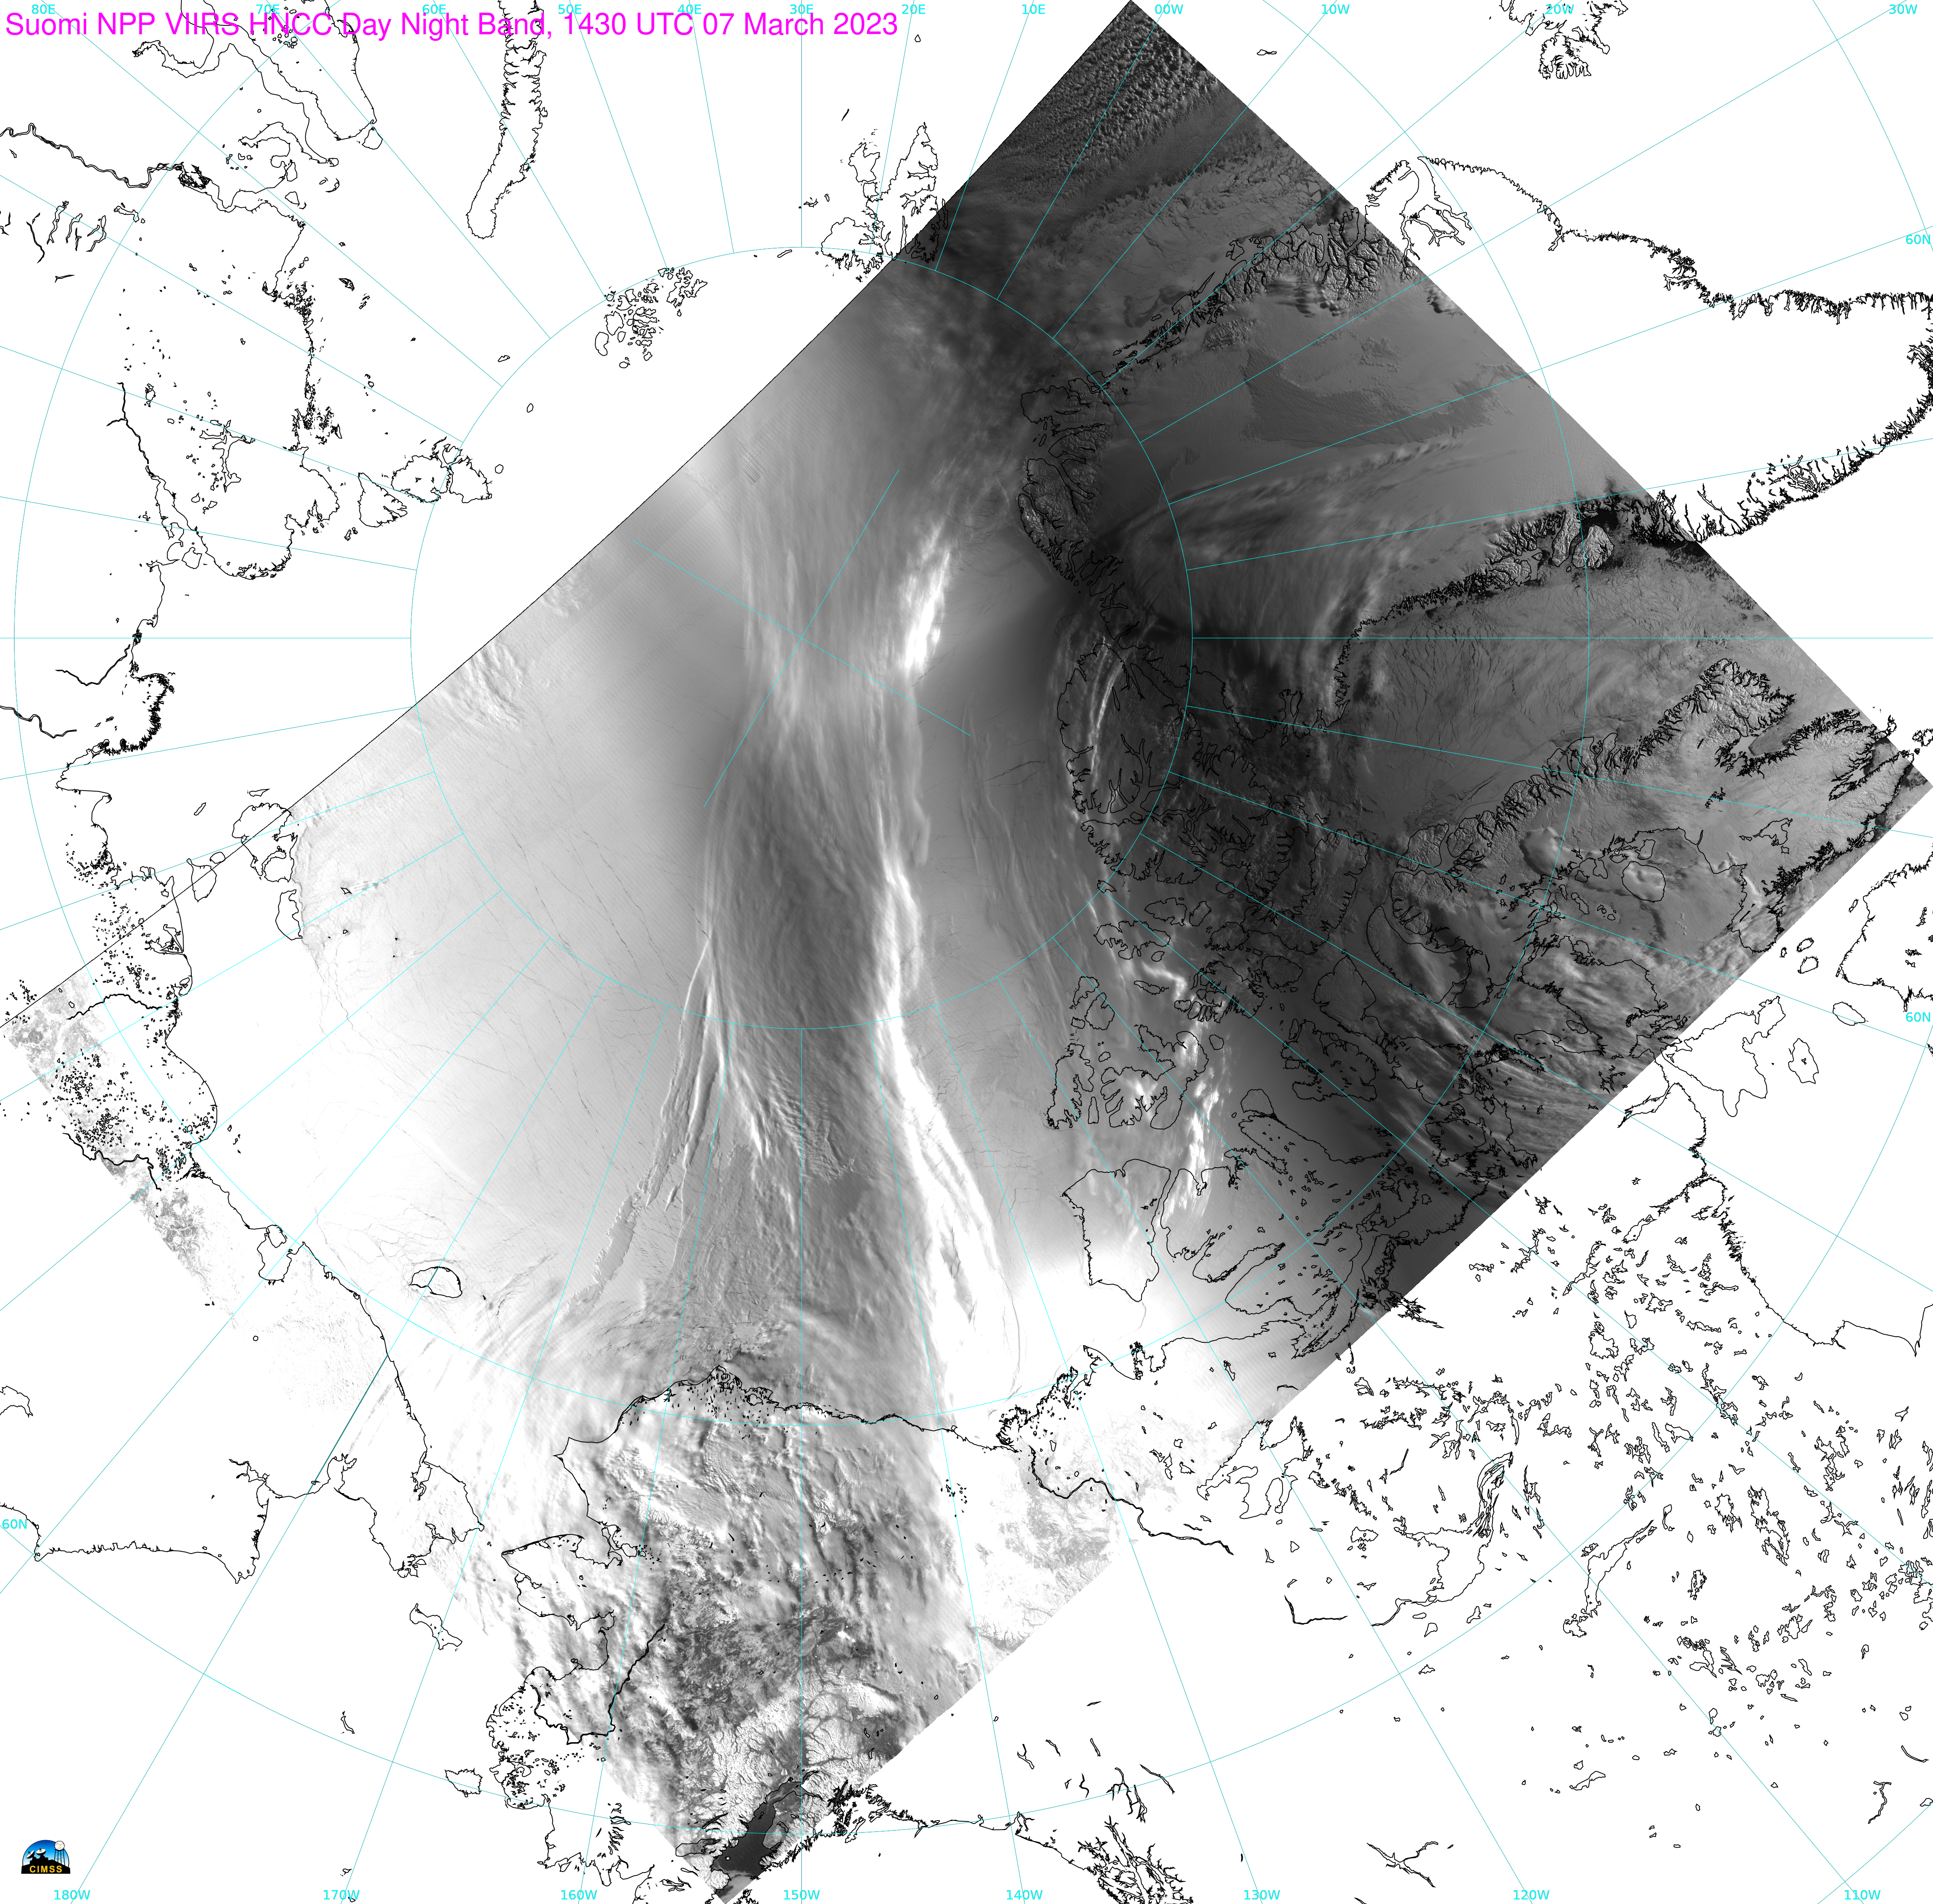
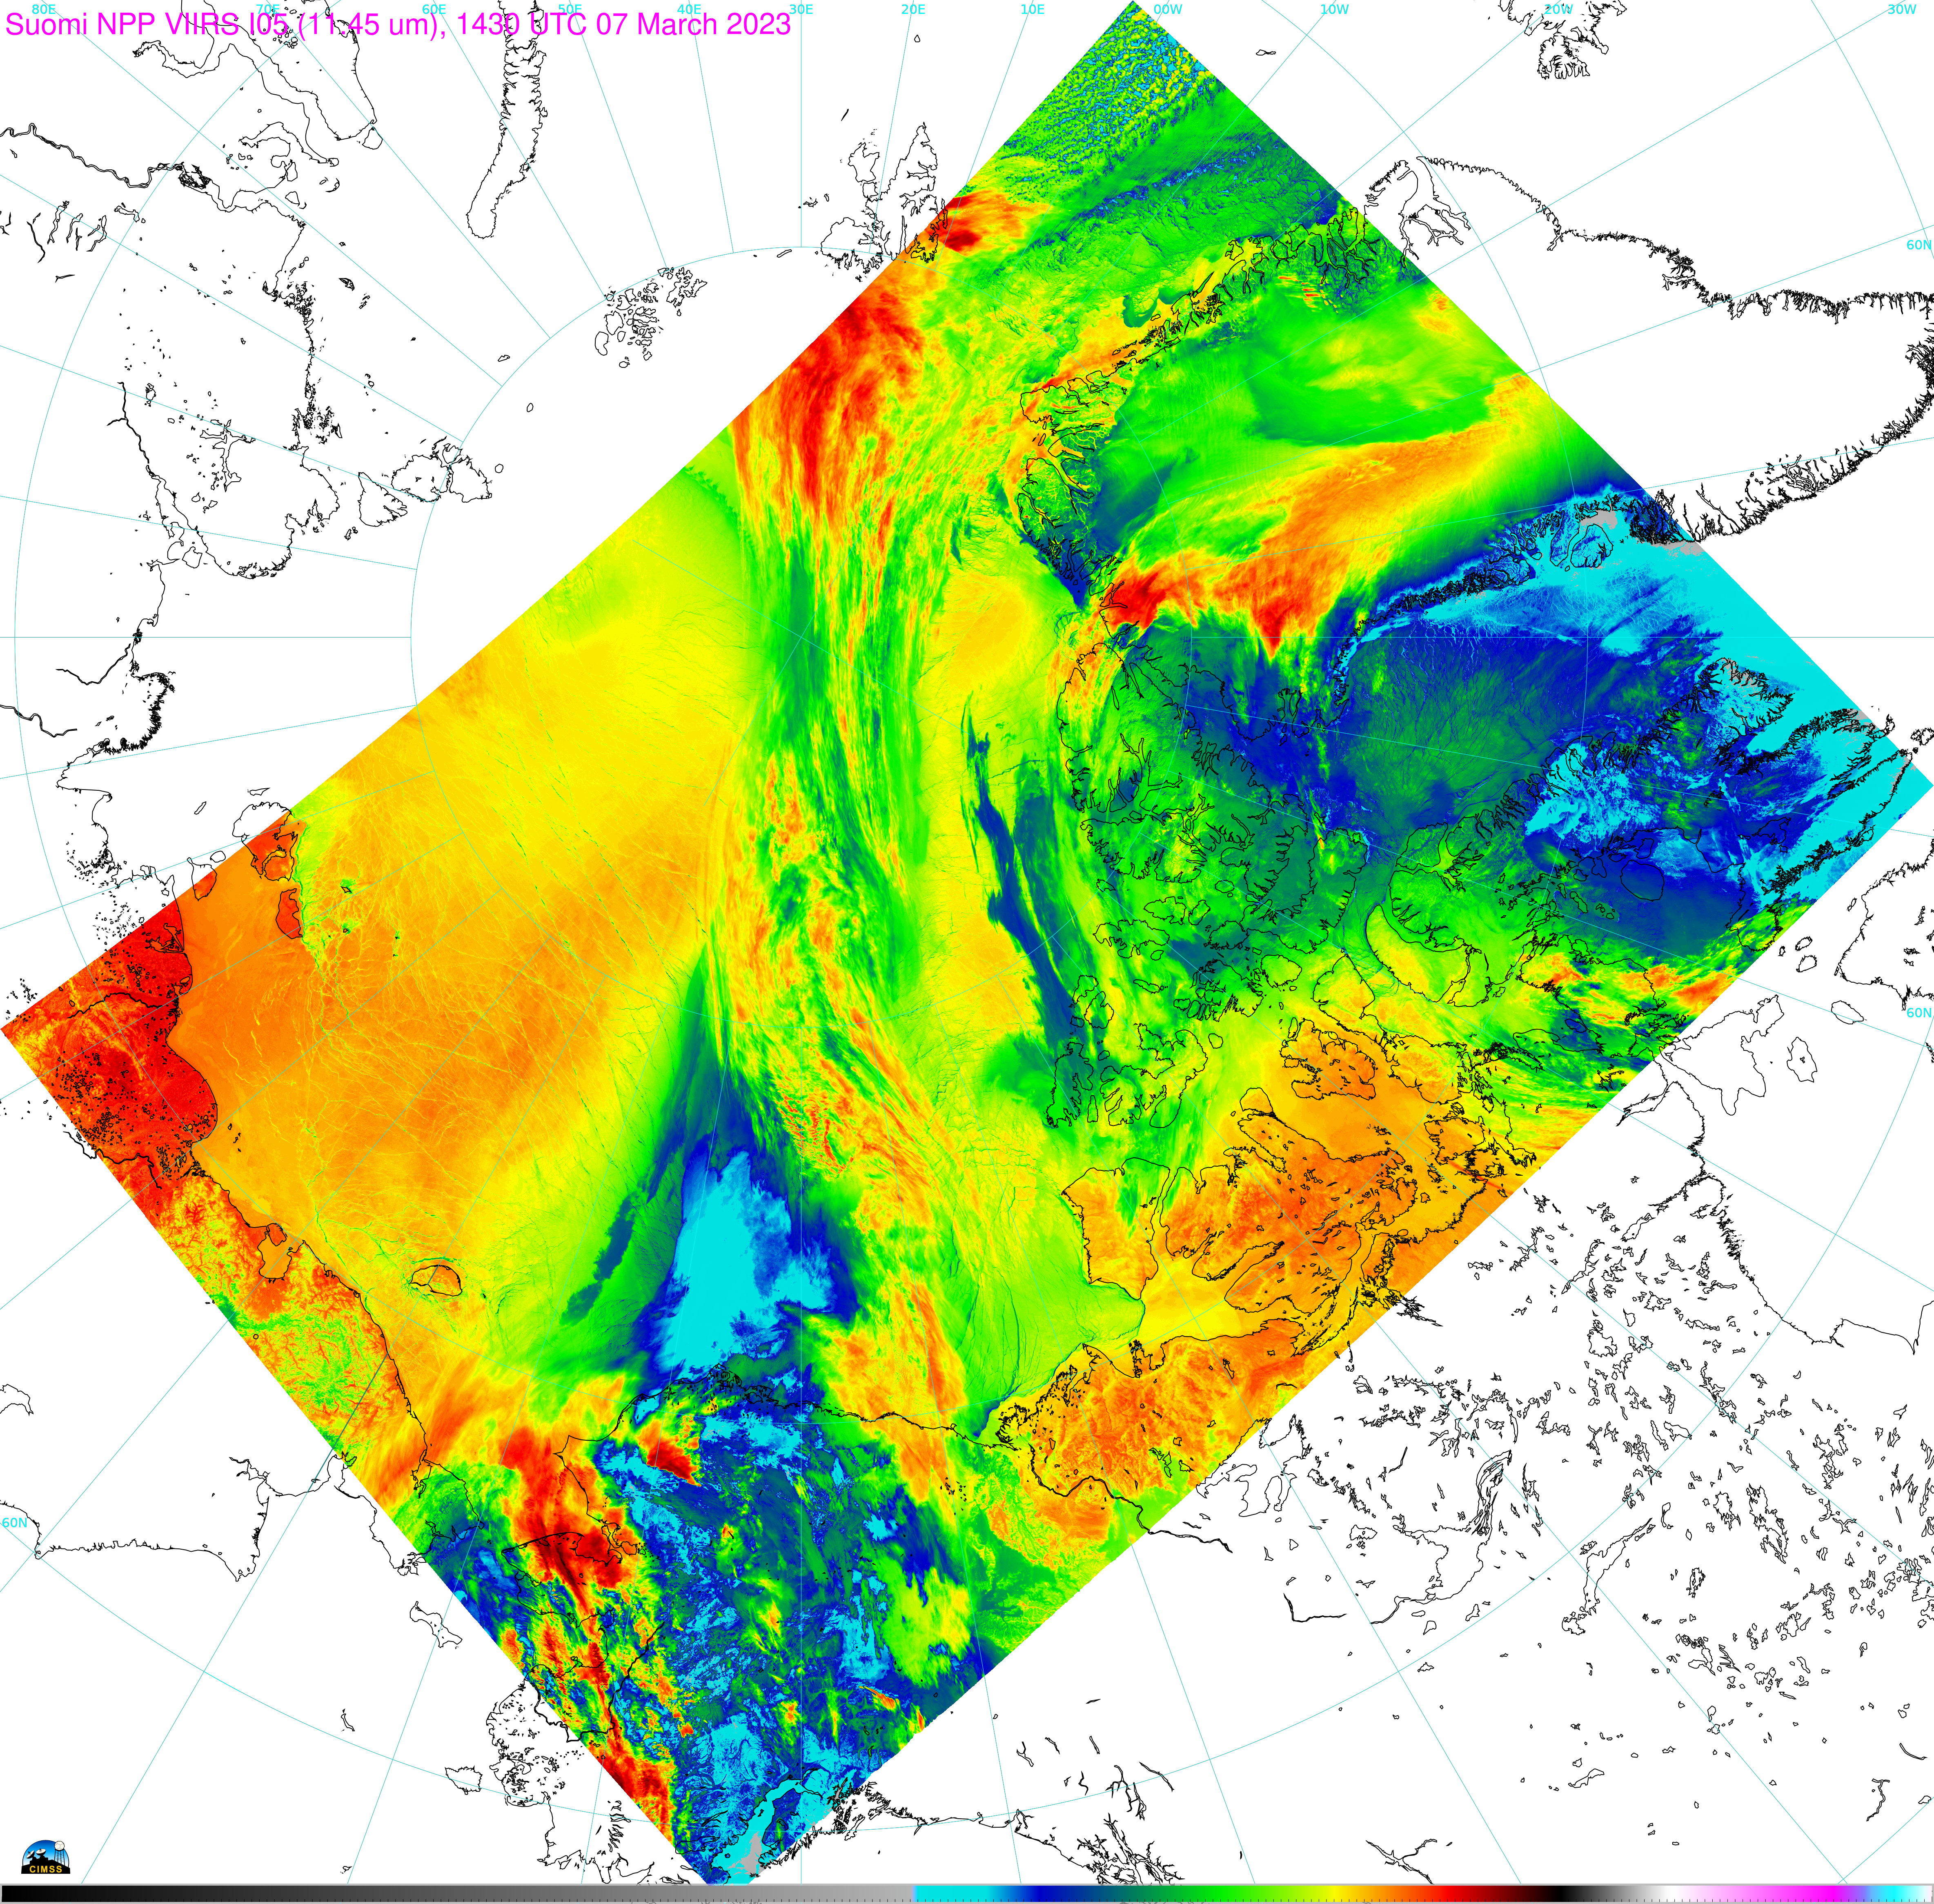
As always, I first interrogate to see what kind of imagery can be created with the data/navigation files that I have, i.e., I execute this command: ./polar2grid.sh -r viirs_sdr -w geotiff --list-products-all -f ../../data/Arctic/*.h5 and this command returns a list (under ### Standard Available Polar2Grid Products) of what I can request using the product flag (-p), including I05 and different flavors of Day Night Band imagery: adaptive_dnb, dyanmic_dnb, histogram_dnb, hncc_dnb (hncc: high and near-constant contrast). I then invoked the Polar2Grid command (1. and 2.) to create this imagery, (3.) to color-enhance the Infrared image, and then (4. and 5.) add coastlines and lat/lon lines. The flags in the add_coastlines.sh shell script are explained in the Polar2Grid online documentation under Section 7: Utility Scripts.
1:  ./polar2grid.sh -r viirs_sdr -w geotiff -p I05 -g polar_canada -f ../../data/Arctic/*.h5
2:  ./polar2grid.sh -r viirs_sdr -w geotiff -p adaptive_dnb dynamic_dnb histogram_dnb hncc_dnb -g polar_canada -f ../../data/Arctic/*.h5
3:  ./add_colormap.sh /home/scottl/CSPPGeo/enhancements/IR13_AWIPSAPPROXnew.txt npp_viirs_I05_20230307_142958_polar_canada.tif
4:  ./add_coastlines.sh --add-coastlines  --coastlines-outline black --coastlines-width 2 --add-grid --grid-D 10.0 10.0 --grid-d 10.0 10.0 --add-colorbar --colorbar-align bottom --colorbar-text-size 1 --colorbar-tick-marks 255 --colorbar-height 50 npp_viirs_I05_20230307_142958_polar_canada.tif
5:  ./add_coastlines.sh --add-coastlines  --coastlines-outline black --coastlines-width 2 --add-grid --grid-D 10.0 10.0 --grid-d 10.0 10.0 *dnb*20230307_142958_polar_canada.tif
Note in the polar2grid call above I have referenced one of the ‘built-in’ grids with -g, i.e., the ‘polar_canada’ grid. In this way I did not have to use the p2g_grid_helper.sh script to create a yaml file that holds gridding information. Imagery created are shown below. The toggle includes the ‘hncc’ Day Night Band image — on this day it had the best look — and the 11.45 µm I05 image both reprojected onto the ‘polar_canada’ map. The cloud feature that you might expect given the cross-polar motion of the relatively high Total Precipitable Water airmass is apparent.
View only this post Read Less


