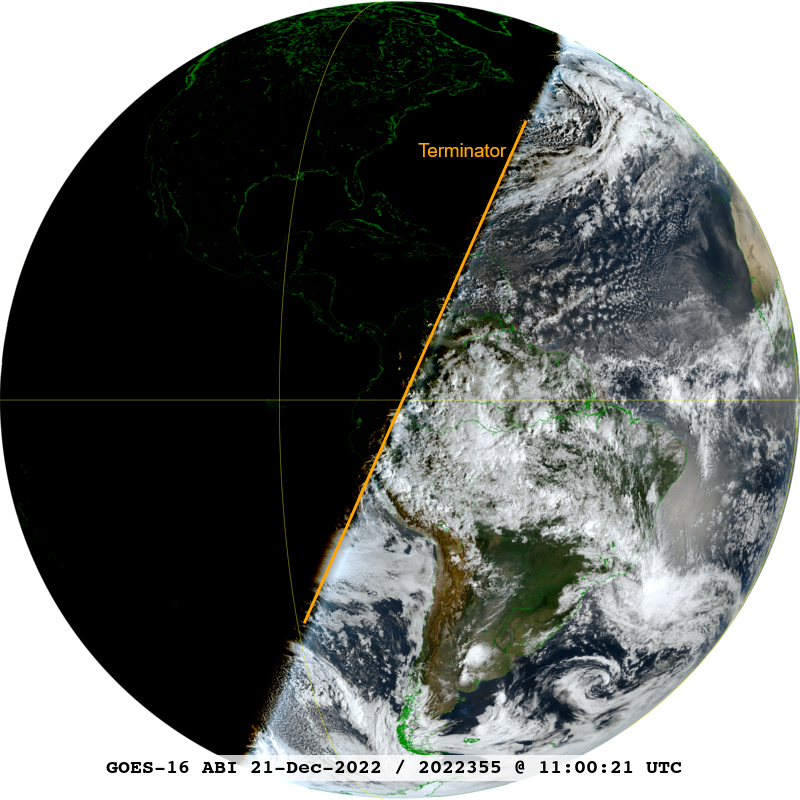
By animating daily NOAA GOES-16 ABI Full Disk true color imagery, how the Earth is illuminated over time can be seen. For example, how the terminator falls on the Earth until the Equinox. For details, see “What is a Solstice?” by SciJinks. Or this NOAA post.
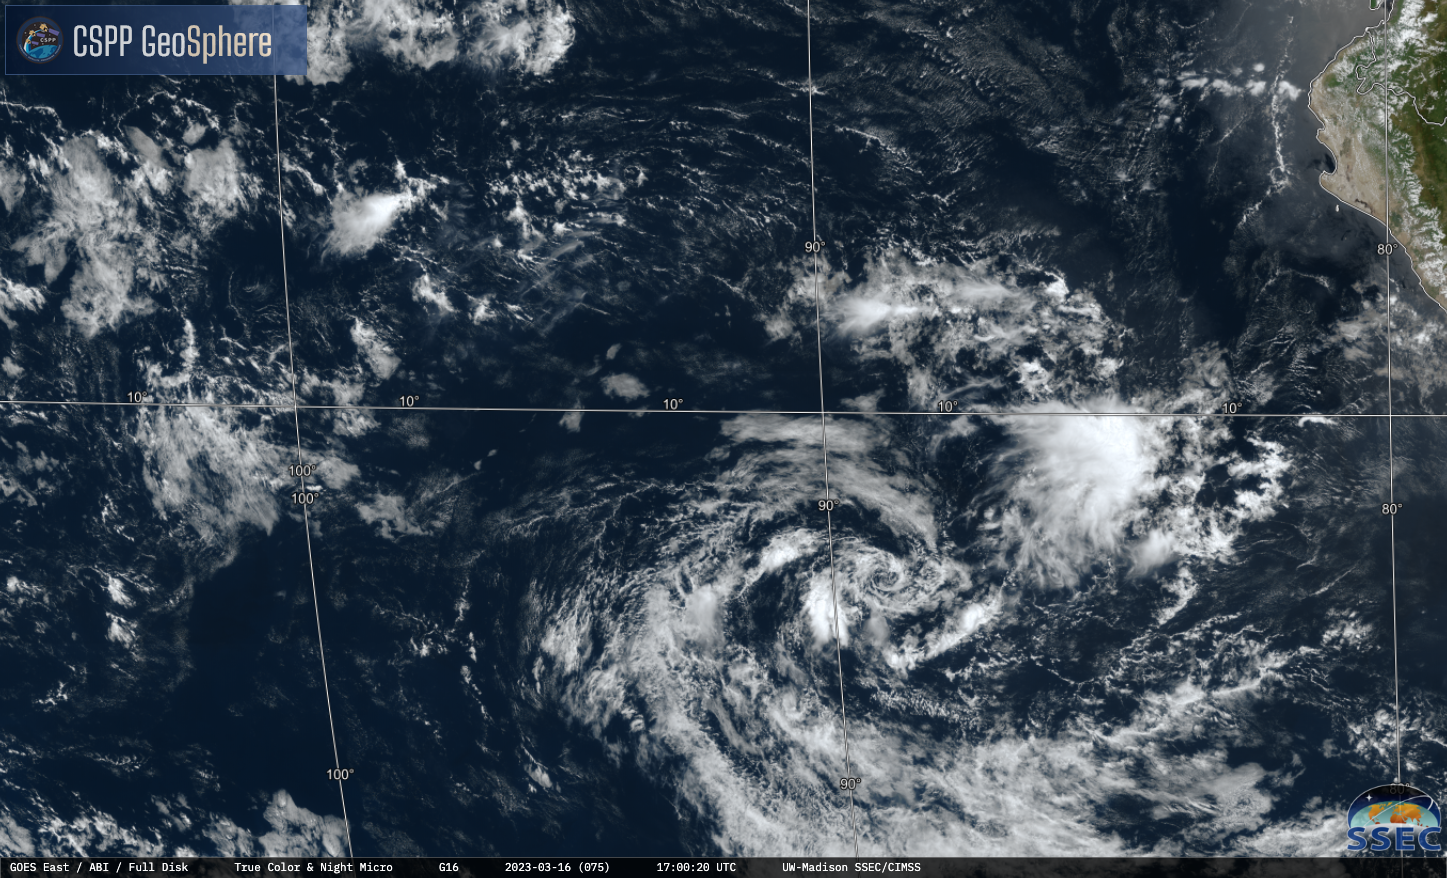
11 UTC loops from the (northern hemisphere) fall Equinox to the Spring Equinox. These posted GOES ABI Full Disk imagery are only showing a small number of the pixels, for a fuller resolution image at one time (20-March-2023).
The above loop, and a smaller size. The 16 bands of ABI from GOES-West and GOES-East from UW/CIMSS.
Interactive web page

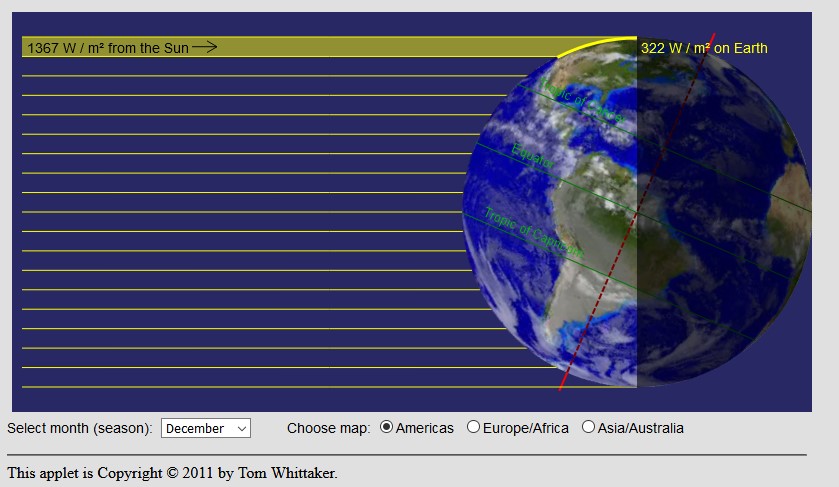
An interactive web page with half a years worth of GOES ABI Full Disk visible images at 11 UTC. The beginning date is the (northern hemisphere) fall equinox in 2022 and the end date is the spring equinox in 2023. A user can play the animation, as well as annotate the images. For example, draw lines along the terminator for different times of the year. One example might be to compare a solstice to an equinox. Can you estimate the day of the summery equinox? H/T Tom Whittaker, SSEC, for the webapp, as well as those below.
Webapps about the Seasons
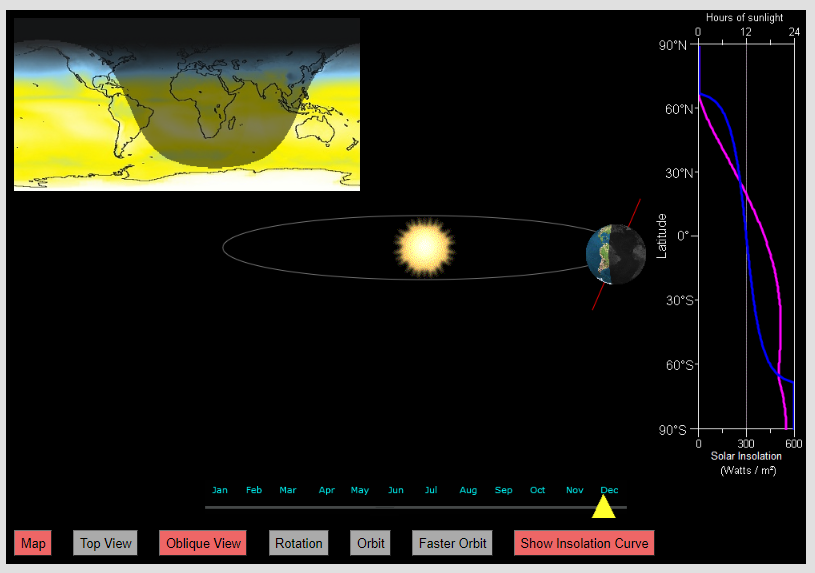
H/T
These images were made using NOAA data with geo2grid software, from UW-Madison, SSEC. T. Whittaker is thanked for the webapps.
View only this post Read Less

