Reflection of sunlight from the Topaz Solar Farm in southern California

GOES-17 “Red” Visible (0.64 µm) images [click to play animation | MP4]
Visible images displayed using McIDAS (below) are in the native GOES-17 satellite projection — removing the re-mapping inherent in the AWIPS images shown above — so the vertical striping artifacts are correctly oriented with respect to how the ABI swaths are scanned.
![GOES-17 "Red" Visible (0.64 µm) images [click to play animation | MP4]](https://cimss.ssec.wisc.edu/satellite-blog/wp-content/uploads/sites/5/2019/06/190612_goes17_visible_mcidas_CA_solar_farm_anim.gif)
GOES-17 “Red” Visible (0.64 µm) images [click to play animation | MP4]
![Multi-panel images of all 16 ABI bands of GOES-17 [click to play animation | MP4]](https://cimss.ssec.wisc.edu/satellite-blog/wp-content/uploads/sites/5/2019/06/190612_goes17_16panel_CA_solar_farm_anim.gif)
Multi-panel images of all 16 ABI bands of GOES-17 on 12 June [click to play animation | MP4]
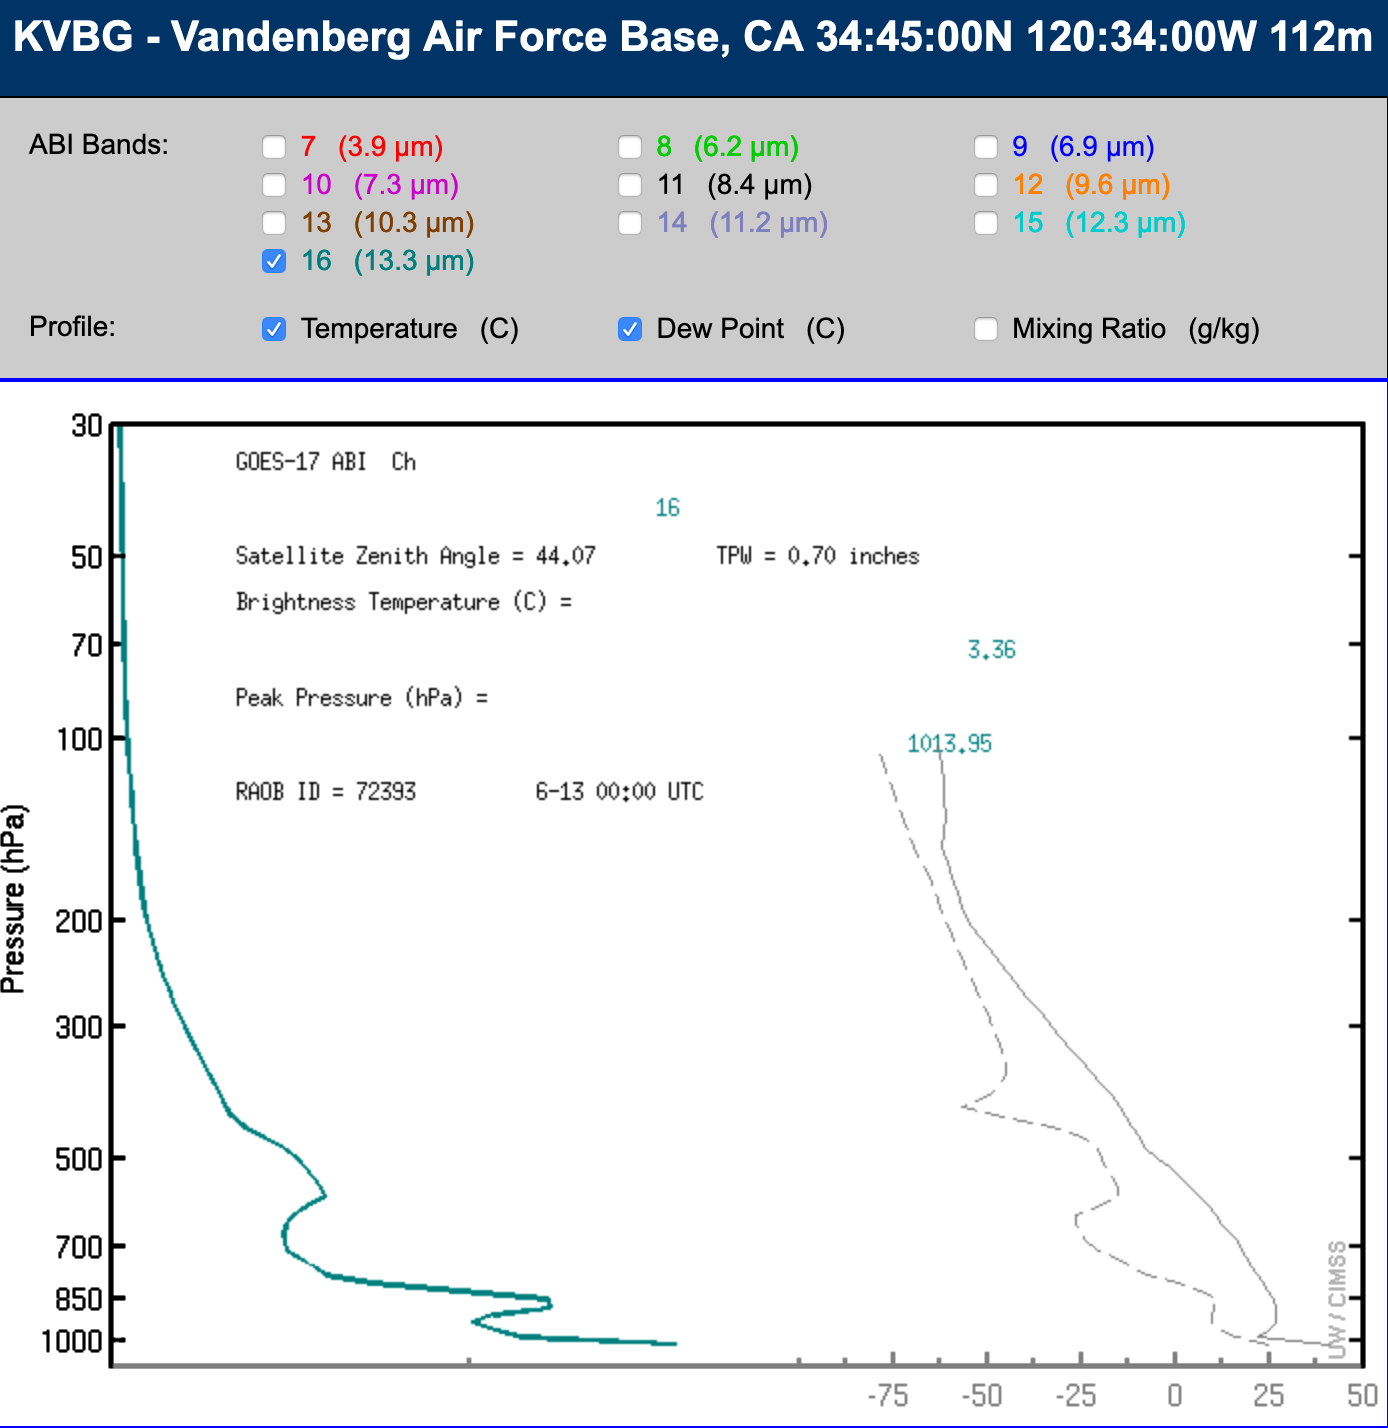
![Infrared and Water Vapor weighting functions calculated using rawinsonde data from Vandenberg CA at 00 T on 13 June [click to enlarge]](https://cimss.ssec.wisc.edu/satellite-blog/wp-content/uploads/sites/5/2019/06/190613_00utc_kvbg_infrared_waterVapor_weightingFunctions_anim.gif)
Infrared and Water Vapor weighting functions calculated using rawinsonde data from Vandenberg Air Force Base CA at 00 UTC on 13 June [click to enlarge]
![Multi-panel images of all 16 ABI bands of GOES-17 [click to play animation | MP4]](https://cimss.ssec.wisc.edu/satellite-blog/wp-content/uploads/sites/5/2019/06/190607_goes17_16panel_CA_solar_farm_anim.gif)
Multi-panel images of all 16 ABI bands of GOES-17 on 07 June [click to play animation | MP4]
Infrared and Water Vapor weighting functions calculated using rawinsonde data from Vandenberg Air Force Base CA at 00 UTC on 08 June [click to enlarge]