Historic Winter Storm Along the US East Coast
![MIMIC Total Precipitable Water, 1500 UTC 19 January -- 1400 UTC 22 January [click to enlarge]](https://cimss.ssec.wisc.edu/satellite-blog/wp-content/uploads/sites/5/2016/01/MIMICTPW_72HoursEnding14z_22January2016.png)
MIMIC Total Precipitable Water, 1500 UTC 19 January — 1400 UTC 22 January [click to enlarge]
*As the GOES-13 Sounder continues to be off-line due to an anomaly (Link), the principle driver of this product over the eastern US is now GPS data.
![NESDIS Blended Total Precipitable Water, 1400 UTC on 21 and 22 January 2016 [Click to enlarge]](https://cimss.ssec.wisc.edu/satellite-blog/wp-content/uploads/sites/5/2016/01/BlendedTPW_14UTC_21_22Jan2016toggle.gif)
NESDIS Blended Total Precipitable Water, 1400 UTC on 21 and 22 January 2016 [click to enlarge]
![MODIS-based Land Surface Temperature, 0722 UTC and the 0900 UTC WPC Surface Analysis, 22 January 2016 [Click to enlarge]](https://cimss.ssec.wisc.edu/satellite-blog/wp-content/uploads/sites/5/2016/01/MODIS_LST_SurfaceAnal_0900UTC.png)
MODIS-based Land Surface Temperature, 0722 UTC and the 0900 UTC WPC Surface Analysis, 22 January 2016 [click to enlarge]
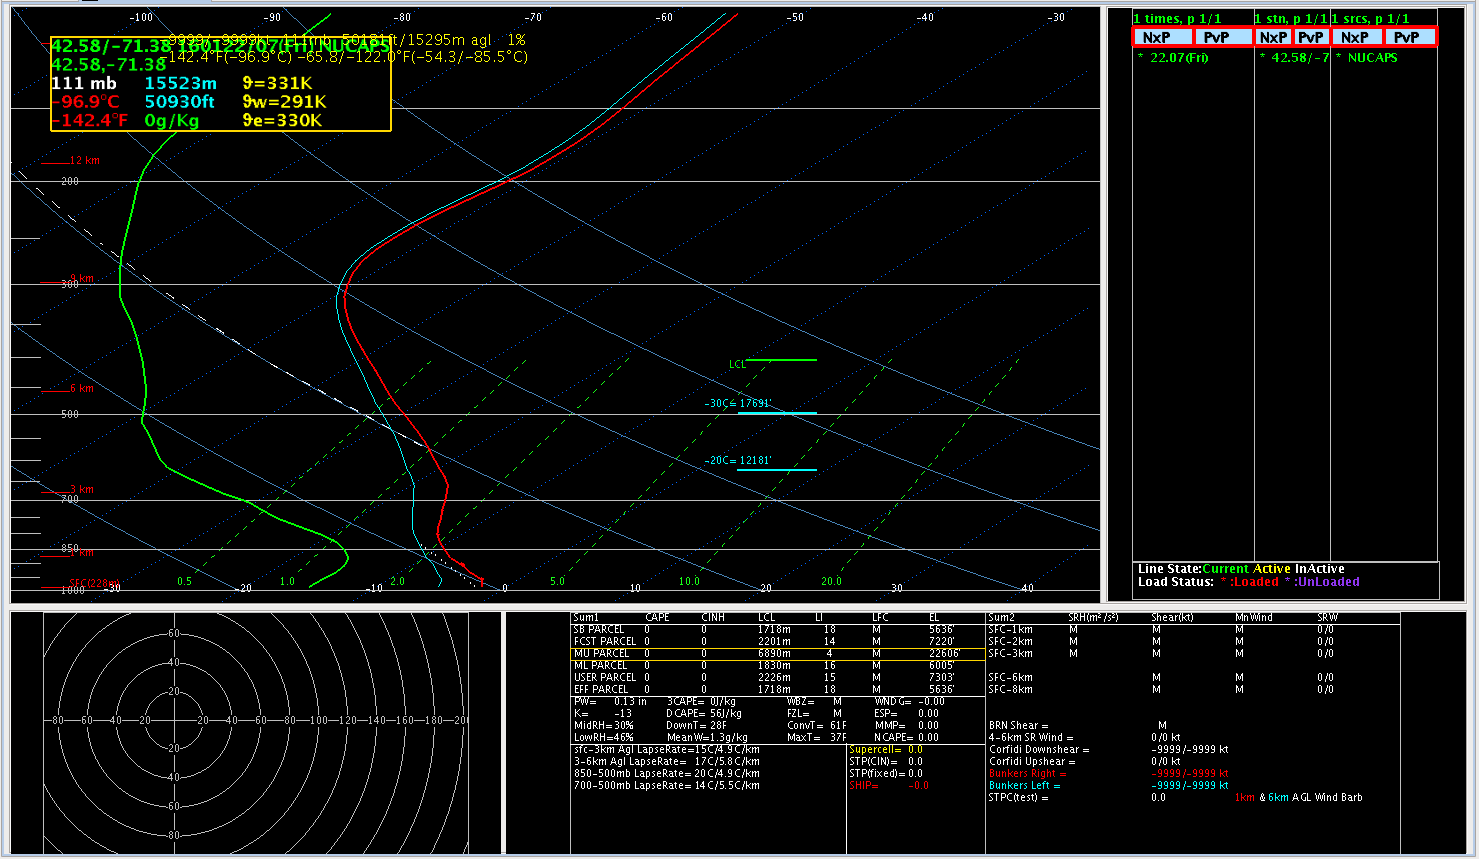
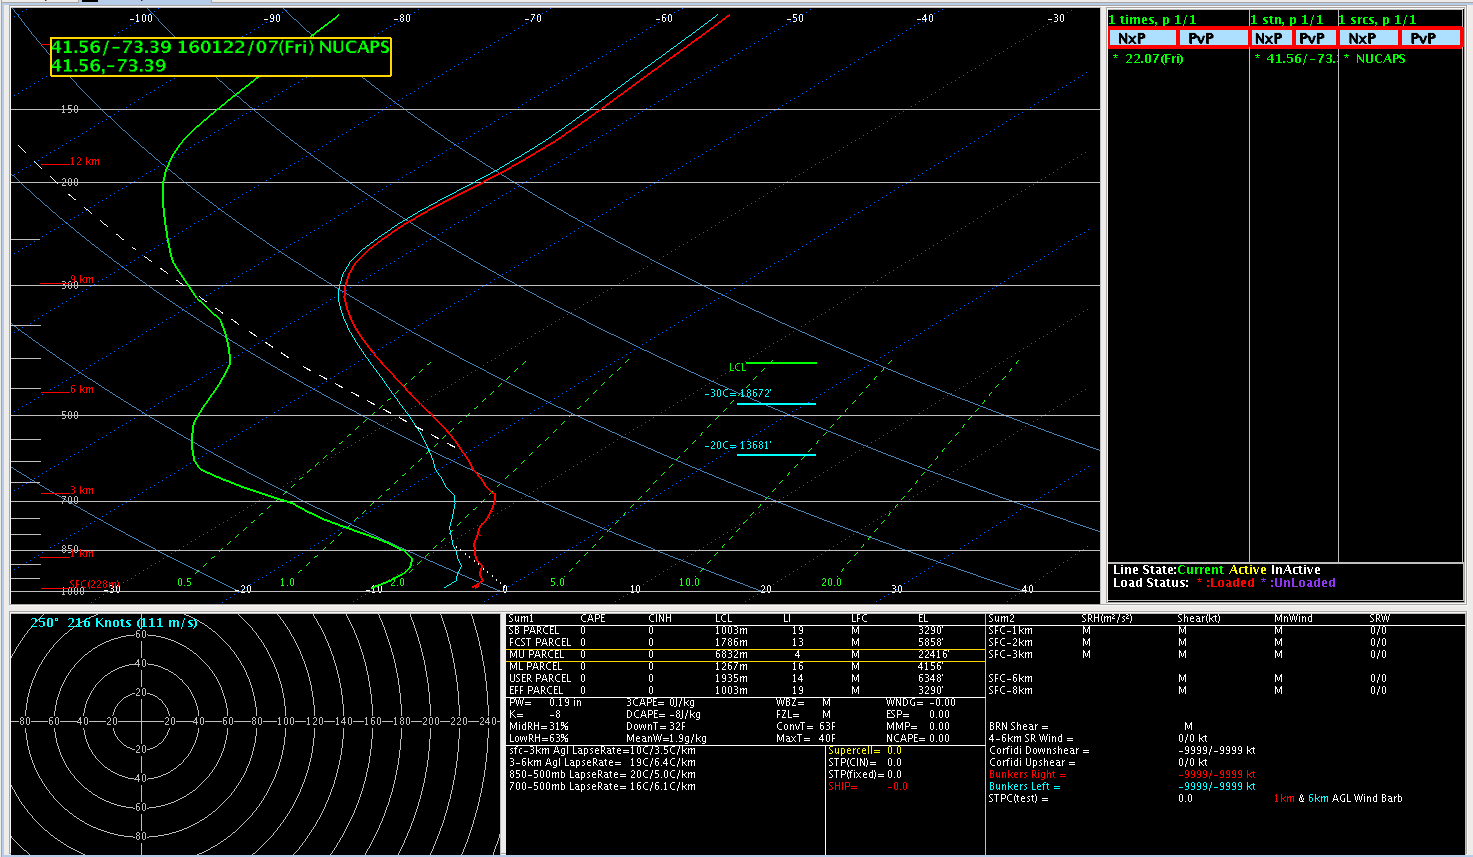
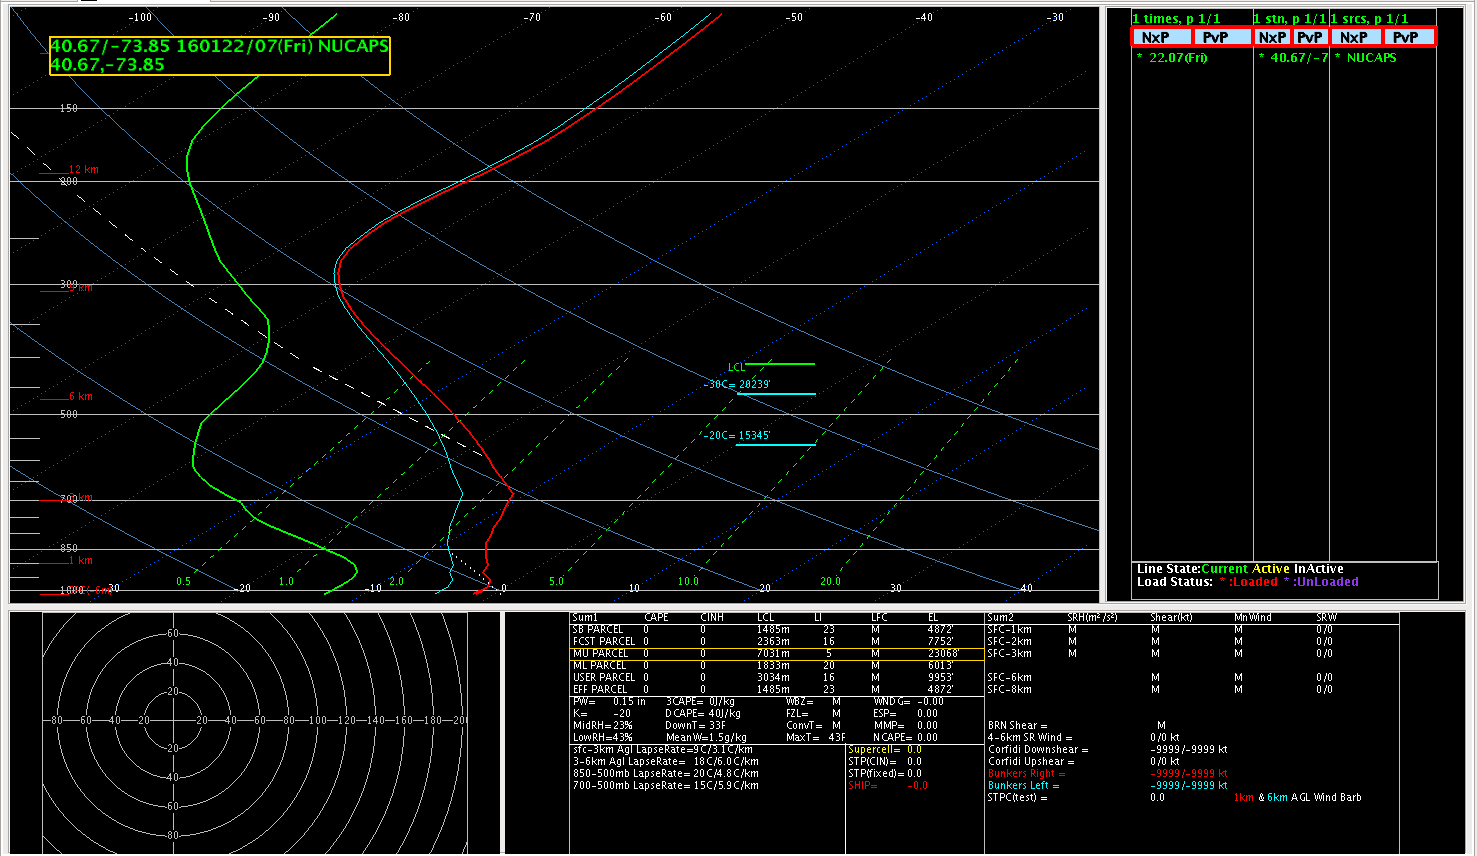
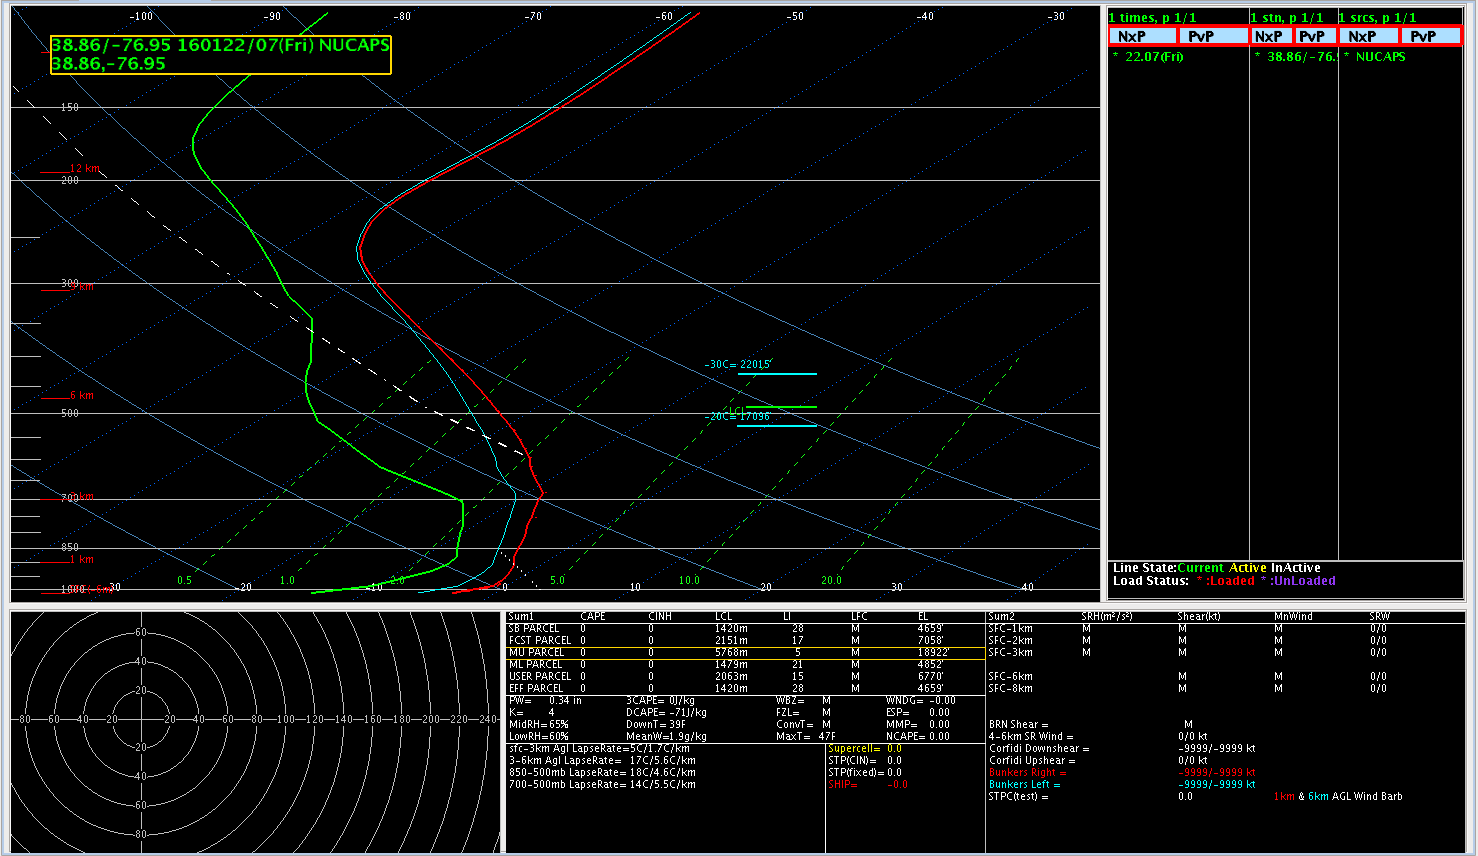
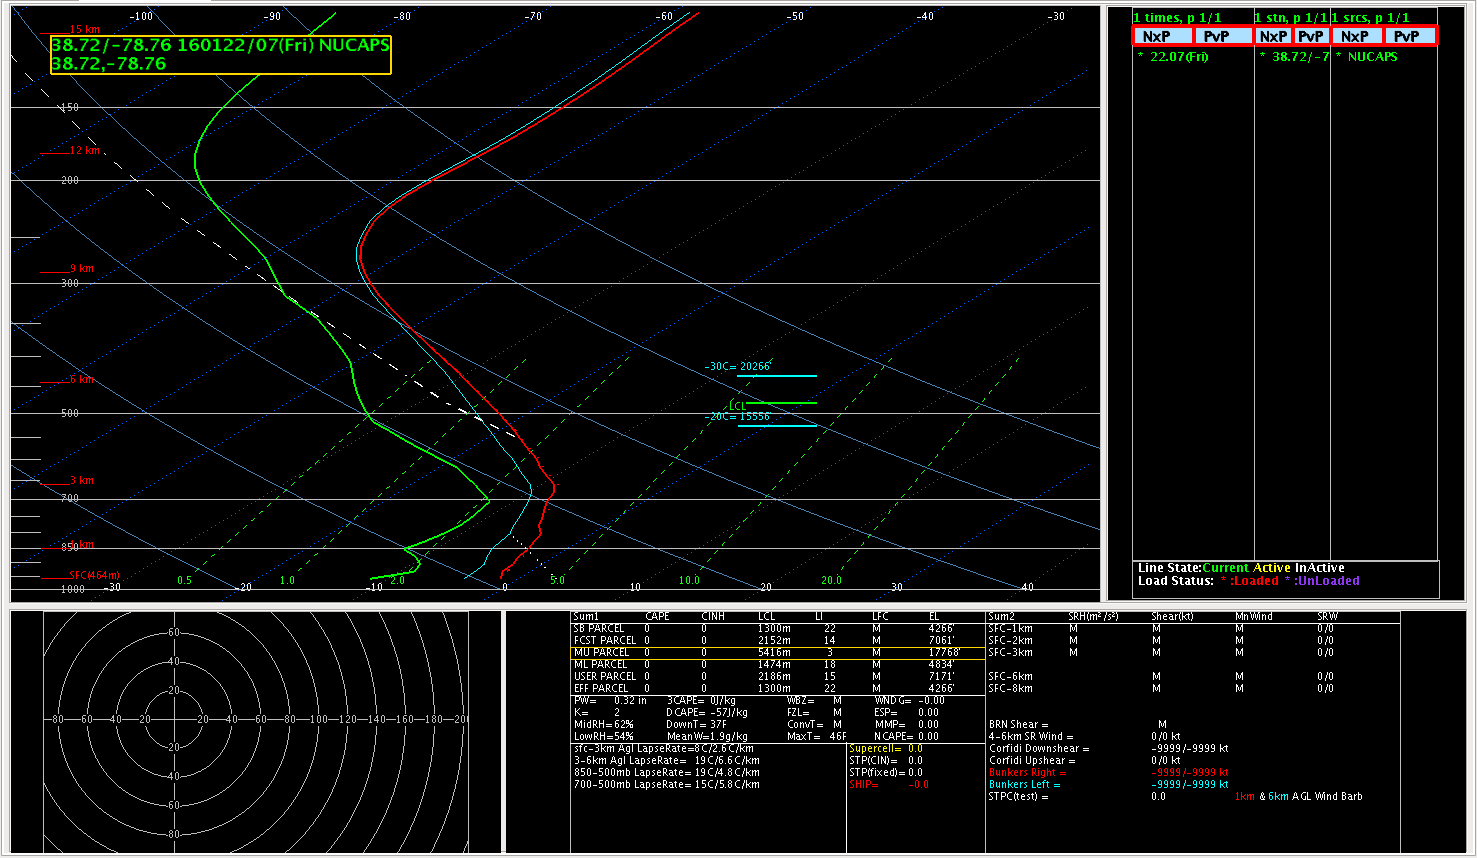
![MODIS-based Land Surface Temperature, 0722 UTC and 0700 UTC NUCAPS Sounding Sites (in green) and the 0900 UTC WPC Surface Analysis, 22 January 2016 [Click to enlarge]](https://cimss.ssec.wisc.edu/satellite-blog/wp-content/uploads/sites/5/2016/01/MODIS_LST_SurfaceAnal_0900UTC_NUCAPSSites_HighLighted.png)
MODIS-based Land Surface Temperature, 0722 UTC and 0700 UTC NUCAPS Sounding Sites (in green) and the 0900 UTC WPC Surface Analysis, 22 January 2016 [click to enlarge]
![Rawinsonde from KIAD (Dulles International Airport) at 0600, 1200 and 1800 UTC on 22 January 2016 [Click to enlarge]](https://cimss.ssec.wisc.edu/satellite-blog/wp-content/uploads/sites/5/2016/01/IAD_Sounding_0600UTC_1200UTC_1800UTC_22Januarytoggle.gif)
Rawinsonde from KIAD (Dulles International Airport) at 0600, 1200 and 1800 UTC on 22 January 2016 [click to enlarge]
The toggle between the Visible (0.65 µm) and the ‘Snow Ice’ Channel in MODIS (1.63 µm), below, highlights regions of ice clouds. Ice particles absorb radiation with wavelength of 1.63 µm but water droplets scatter such radiation. Thus, regions in visible imagery that are white that include mostly ice crystals (or snow on the ground), for example the cirrus shield on the East Coast, will appear dark in the 1.63 µm imagery but bright in visible because clouds are highly reflective to visible light. Water-based clouds (over Mississippi, for example, or southeastern West Virginia; in fact, low clouds are apparent just to the west of the cirrus shield associated with the developing baroclinic leaf, from West Virginia southward to Savannah Georgia!) will appear bright in both channels.
![MODIS Visible (0.65 µm) and near Infrared (1.63 µm) Imagery at 1836 UTC [Click to enlarge]](https://cimss.ssec.wisc.edu/satellite-blog/wp-content/uploads/sites/5/2016/01/MODIS_SnowIceVIS_toggle_1836UTC_22January2016.gif)
MODIS Visible (0.65 µm) and near Infrared (1.63 µm) Imagery at 1836 UTC [click to enlarge]
![MODIS Visible (0.65 µm), Cirrus Channel (1.38 µm) and Window Channel Infrared (11.02 µm) Imagery at 1836 UTC [Click to enlarge]](https://cimss.ssec.wisc.edu/satellite-blog/wp-content/uploads/sites/5/2016/01/MODIS_VIS_CIRRUS_IR_1836UTC_22January2016toggle.gif)
MODIS Visible (0.65 µm), Cirrus Channel (1.38 µm) and Window Channel Infrared (11.02 µm) Imagery at 1836 UTC [click to enlarge]
![MODIS Infrared Water Vapor (6.8 µm) Imagery at 1836 UTC along with Pilot Reports of Turbulence (PIREPS) [Click to enlarge]](https://cimss.ssec.wisc.edu/satellite-blog/wp-content/uploads/sites/5/2016/01/MODIS_WV_BAND27_1836UTC_22January2016Turbtoggle.gif)
MODIS Infrared Water Vapor (6.8 µm) Imagery at 1836 UTC along with Pilot Reports of Turbulence (PIREPS) [click to enlarge]
![GOES-13 Visible (0.63 µm) images [click to play animation]](https://cimss.ssec.wisc.edu/satellite-blog/wp-content/uploads/sites/5/2016/01/160122_goes13_rso_visible_Eastern_US_storm_anim.gif)
GOES-13 Visible (0.63 µm) images [click to play animation]
![GOES-13 Water Vapor (6.5 µm) images [click to play animation]](https://cimss.ssec.wisc.edu/satellite-blog/wp-content/uploads/sites/5/2016/01/160122_goes13_rso_water_vapor_Eastern_US_storm_anim.gif)
GOES-13 Water Vapor (6.5 µm) images [click to play animation]
![GOES-13 Infrared window (10.7 µm) images [click to play animation]](https://cimss.ssec.wisc.edu/satellite-blog/wp-content/uploads/sites/5/2016/01/160122_goes13_rso_infrared_Eastern_US_storm_anim.gif)
GOES-13 Infrared window (10.7 µm) images [click to play animation]
![AVHRR (10.8 µm), MODIS (11.0 µm), and VIIRS (11.45 µm) Infrared window channel images [click to enlarge]](https://cimss.ssec.wisc.edu/satellite-blog/wp-content/uploads/sites/5/2016/01/160122_avhrr_modis_viirs_IR_Eastern_US_Storm_anim.gif)
AVHRR (10.8 µm), MODIS (11.0 µm), and VIIRS (11.45 µm) Infrared window channel images [click to enlarge]
![MODIS Water Vapor (6.7 µm) images [click to enlarge]](https://cimss.ssec.wisc.edu/satellite-blog/wp-content/uploads/sites/5/2016/01/160121-22_modis_water_vapor_Eastern_US_Storm_anim.gif)
MODIS Water Vapor (6.7 µm) images [click to enlarge]
![GOES-13 Visible (0.63 µm) images [click to play animation]](https://cimss.ssec.wisc.edu/satellite-blog/wp-content/uploads/sites/5/2016/01/160122_goes13_visible_Tehuano_gap_winds_anim.gif)
GOES-13 Visible (0.63 µm) images [click to play animation]
![Suomi NPP VIIRS true-color RGB image [click to enlarge]](https://cimss.ssec.wisc.edu/satellite-blog/wp-content/uploads/sites/5/2016/01/160122_suomi_npp_viirs_truecolor_Tehuano_Wind.jpg)
Suomi NPP VIIRS true-color RGB image [click to enlarge]
![GOES and ASCAT satellite winds [click to play animation]](https://cimss.ssec.wisc.edu/satellite-blog/wp-content/uploads/sites/5/2016/01/160122_goes13_winds_ascat_ship_reports_anim.gif)
GOES and ASCAT satellite winds [click to play animation]
===== 23 January Update =====
As the surface low deepened to a minimum central pressure of 983 hPa and moved northeastward just off the US East Coast (surface analyses), GOES-13 Visible (0.63 µm) images, below, showed the moisture — with some embedded convective elements, judging from the texture and shadowing of the cloud tops — moving inland from the Atlantic Ocean north of the storm. Thundersnow was in fact reported at a number of locations. A similar animation of GOES-13 Visible images covering the daylight portions of the 22-23 January period is available here, with the entire 48-hour Infrared window channel (10.7 µm) animation here.
![GOES-13 Visible (0.63 µm) images with surface weather symbols [click to play animation]](https://cimss.ssec.wisc.edu/satellite-blog/wp-content/uploads/sites/5/2016/01/160123_goes13_rso_visible_precip_type_Eastern_US_Storm_anim.gif)
GOES-13 Visible (0.63 µm) images with surface weather symbols [click to play animation]
![Suomi NPP VIIRS true-color RGB images at 1652 and 1828 UTC [click to enlarge]](https://cimss.ssec.wisc.edu/satellite-blog/wp-content/uploads/sites/5/2016/01/160123_suomi_npp_viirs_truecolor_zoom_anim.gif)
Suomi NPP VIIRS true-color RGB images at 1652 and 1828 UTC [click to enlarge]
===== 24 January Update =====
![MIMIC Total Precipitable Water product [click to enlarge]](https://cimss.ssec.wisc.edu/satellite-blog/wp-content/uploads/sites/5/2016/01/160121-23_mimic_tpw_anim.gif)
MIMIC Total Precipitable Water product [click to enlarge]
Shown above is a 72-hour animation of the MIMIC TPW product (from 00 UTC on 21 January to 00 UTC on 24 January), which — as mentioned at the beginning of this blog post — revealed the large amount of moisture-rich air that was drawn northward and subsequently wrapped into the storm. South of Mexico, a narrow tongue of dry air (a signature of the aforementioned Tehuano wind event) was also clearly seen, moving southwestward over the Pacific Ocean.
![GOES-13 Water Vapor (6.5 µm) images, with surface weather symbols [click to play MP4 animation]](https://cimss.ssec.wisc.edu/satellite-blog/wp-content/uploads/sites/5/2016/01/960x1280_AGOES13_B3_GOES13_WV_EASTERN_US_STORM_ZOOM_WXS_2016023_173700_0001PANEL.GIF)
GOES-13 Water Vapor (6.5 µm) images, with surface weather symbols [click to play MP4 animation]
The illumination of a Full Moon helped to provide a vivid “visible image at night” using the Suomi NPP VIIRS 0.7 µm Day/Night Band (below), highlighting the clouds associated with the departing storm along and just off the US East Coast, as well as the vast areas inland that were snow-covered. In the toggle between the corresponding Infrared window (11.45 µm) image, cloud streets due to cold air streaming southward and southeastward across the Gulf of Mexico toward Cuba were also seen.
![Suomi NPP VIIRS Day/Night Band (0.7 µm) and Infrared window channel (11.45 µm) images [click to enlarge]](https://cimss.ssec.wisc.edu/satellite-blog/wp-content/uploads/sites/5/2016/01/160124_0647utc_suomi_npp_viirs_DNB_IR_Eastern_US_Storm_anim.gif)
Suomi NPP VIIRS Day/Night Band (0.7 µm) and Infrared window channel (11.45 µm) images [click to enlarge]
![GOES-13 Visible (0.63 µm) images [click to play animation]](https://cimss.ssec.wisc.edu/satellite-blog/wp-content/uploads/sites/5/2016/01/160124_goes13_visible_Eastern_US_snow_cover_anim.gif)
GOES-13 Visible (0.63 µm) images [click to play animation]
![Terra MODIS Visible (0.65 µm) and False-color RGB images [click to enlarge]](https://cimss.ssec.wisc.edu/satellite-blog/wp-content/uploads/sites/5/2016/01/160124_1507utc_1644utc_modis_visible_falsecolor_rgb_Eastern_US_snow_cover_anim.gif)
Terra MODIS Visible (0.65 µm) and False-color RGB images [click to enlarge]
![Terra MODIS true-color RGB iimage [click to enlarge]](https://cimss.ssec.wisc.edu/satellite-blog/wp-content/uploads/sites/5/2016/01/160124_1507utc_modis_truecolor_Eastern_US_snow_cover_anim.gif)
Terra MODIS true-color RGB iimage [click to enlarge]
![Terra MODIS true-color RGB image [click to enlarge]](https://cimss.ssec.wisc.edu/satellite-blog/wp-content/uploads/sites/5/2016/01/160124_1644utc_modis_truecolor_Eastern_US_snow_cover_anim.gif)
Terra MODIS true-color RGB image [click to enlarge]
![Suomi NPP VIIRS true-color and false-color images [click to enlarge]](https://cimss.ssec.wisc.edu/satellite-blog/wp-content/uploads/sites/5/2016/01/160124_1809utc_suomi_npp_viirs_truecolor_falsecolor_Eastern_US_snow_cover_anim.gif)
Suomi NPP VIIRS true-color and false-color images [click to enlarge]
![Landsat-8 false-color image of the Washington DC area [click to enlarge]](https://cimss.ssec.wisc.edu/satellite-blog/wp-content/uploads/sites/5/2016/01/160124_1547utc_landsat8_falsecolor_WashingtonDC_anim.gif)
Landsat-8 false-color image of the Washington DC area [click to enlarge]
![Landsat-8 false-color image [click to enlarge]](https://cimss.ssec.wisc.edu/satellite-blog/wp-content/uploads/sites/5/2016/01/160124_1547utc_landsat8_falsecolor_Baltimore_anim.gif)
Landsat-8 false-color image [click to enlarge]
![Table of Maximum Wind Gusts [click to enlarge]](https://cimss.ssec.wisc.edu/satellite-blog/wp-content/uploads/sites/5/2016/01/BlizzardWindGustMaxima.PNG)
Table of Maximum Wind Gusts [click to enlarge]
![Hourly GOES-13 Infrared Water Vapor (6.5 µm) and surface reports of Wind Gusts (knots) [click to play animation]](https://cimss.ssec.wisc.edu/satellite-blog/wp-content/uploads/sites/5/2016/01/GOES13WV_GUSTS_22JAN_1800_24JAN_0800anim.gif)
Hourly GOES-13 Infrared Water Vapor (6.5 µm) and surface reports of Wind Gusts (knots) [click to play animation]
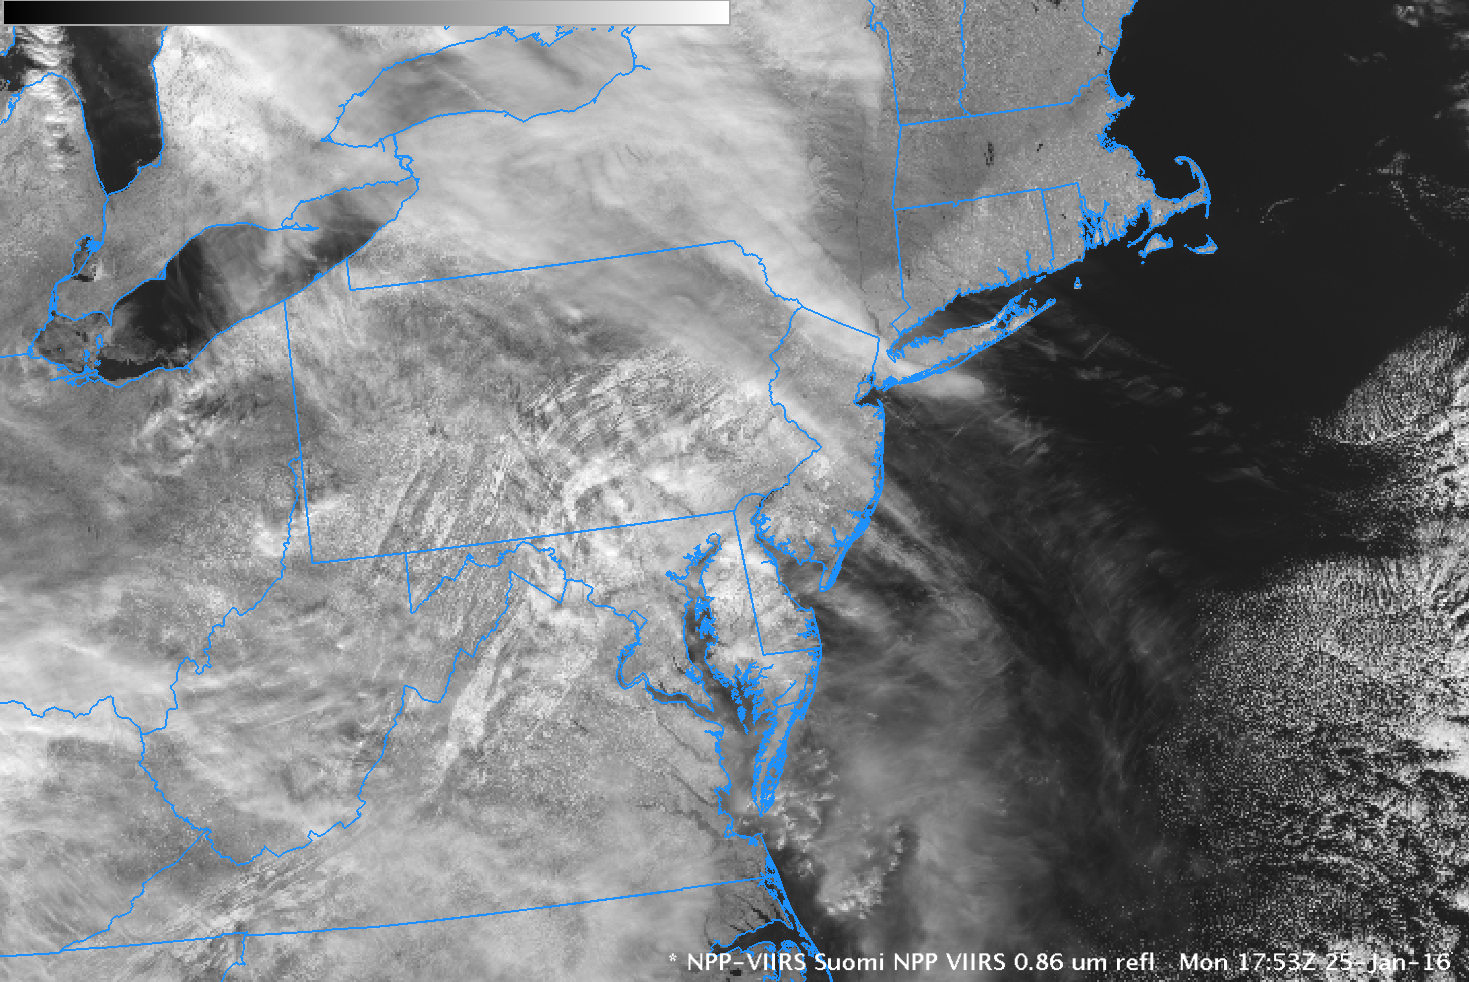
![Suomi NPP VIIRS Visible (0.64 µm) and Near-Infrared (0.86 µm and 1.61 µm) imagery, 1753 UTC on 25 January 2016 [click to enlarge]](https://cimss.ssec.wisc.edu/satellite-blog/wp-content/uploads/sites/5/2016/01/SNPP_VIS_nearIR_25JAN2016_1753step.gif)
Suomi NPP VIIRS Visible (0.64 µm) and Near-Infrared (0.86 µm and 1.61 µm) imagery, 1753 UTC on 25 January 2016 [click to enlarge]
![Suomi NPP VIIRS RGB Imagery showing snow/ice features (red), water droplet cloud features (white) and bare ground (cyan), 1753 UTC on 25 January 2016 [click to enlarge]](https://cimss.ssec.wisc.edu/satellite-blog/wp-content/uploads/sites/5/2016/01/SNPP_SNOWRGB_25JAN2016_1753.png)
Suomi NPP VIIRS RGB Imagery showing snow/ice features (red), water droplet cloud features (white) and bare ground (cyan), 1753 UTC on 25 January 2016 [click to enlarge]
===== Added 28 January =====Rich Grumm, the SOO from the WFO in State College, discussed this storm as part of VISIT’s Satellite Chat series.