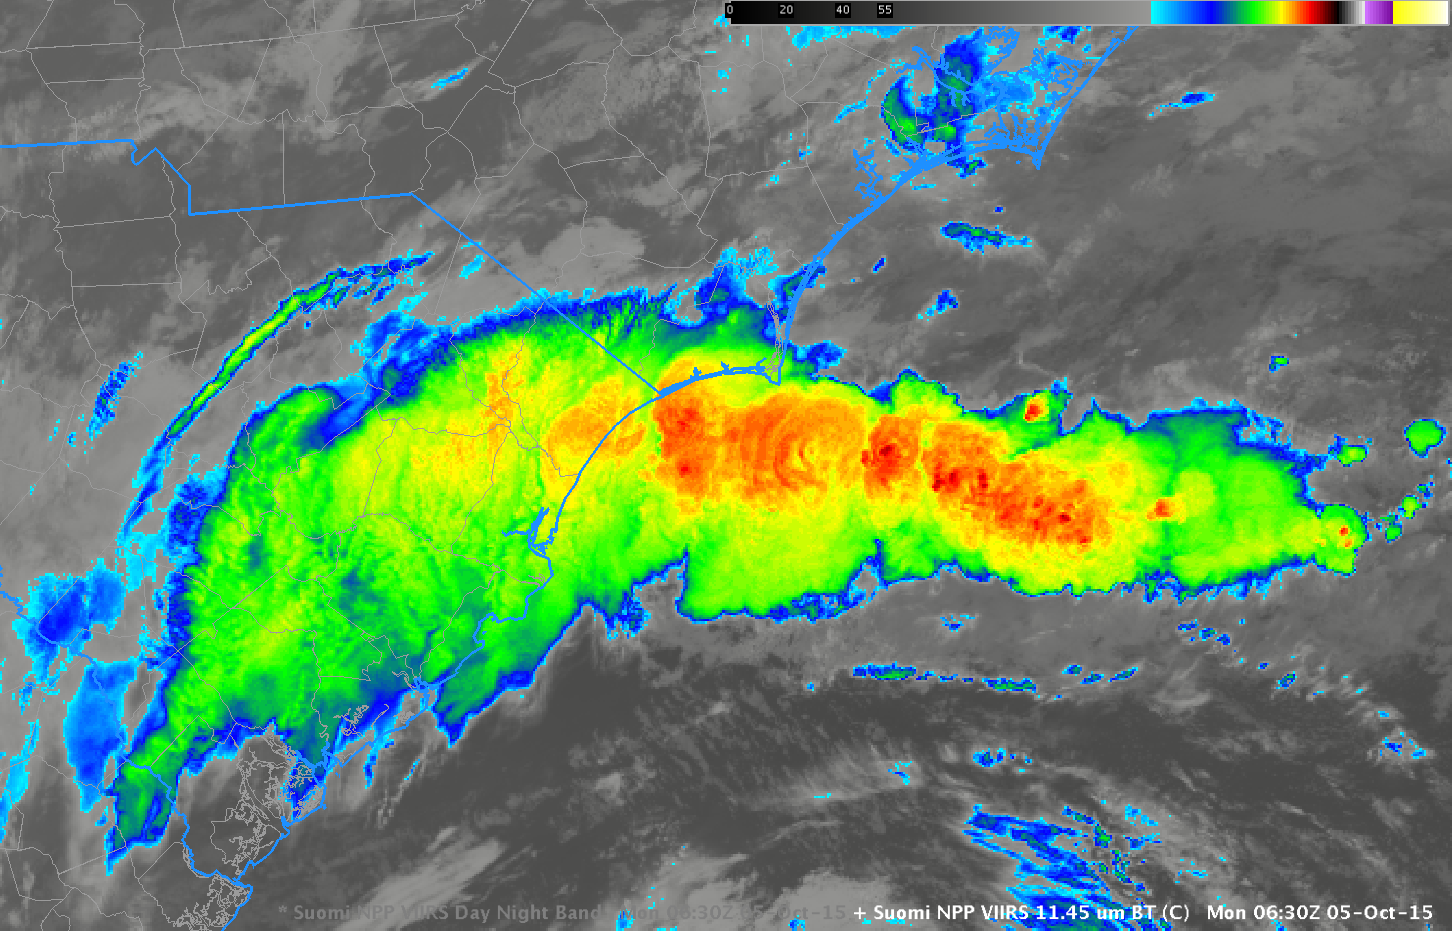
![Suomi NPP VIIRS Infrared (11.45 µm) and Day/Night Band Visible (0.70 µm) imagery overlain with 24-hour precipitation for the period ending 1200 UTC on 5 October [click to enlarge]](https://cimss.ssec.wisc.edu/satellite-blog/wp-content/uploads/sites/5/2015/09/SNPP_DNB_IR_1145_0630_5Oct2015_preciptoggle.gif)
Suomi NPP VIIRS Infrared (11.45 µm) and Day/Night Band Visible (0.70 µm) imagery overlain with 24-hour precipitation for the period ending 1200 UTC on 5 October [click to enlarge]
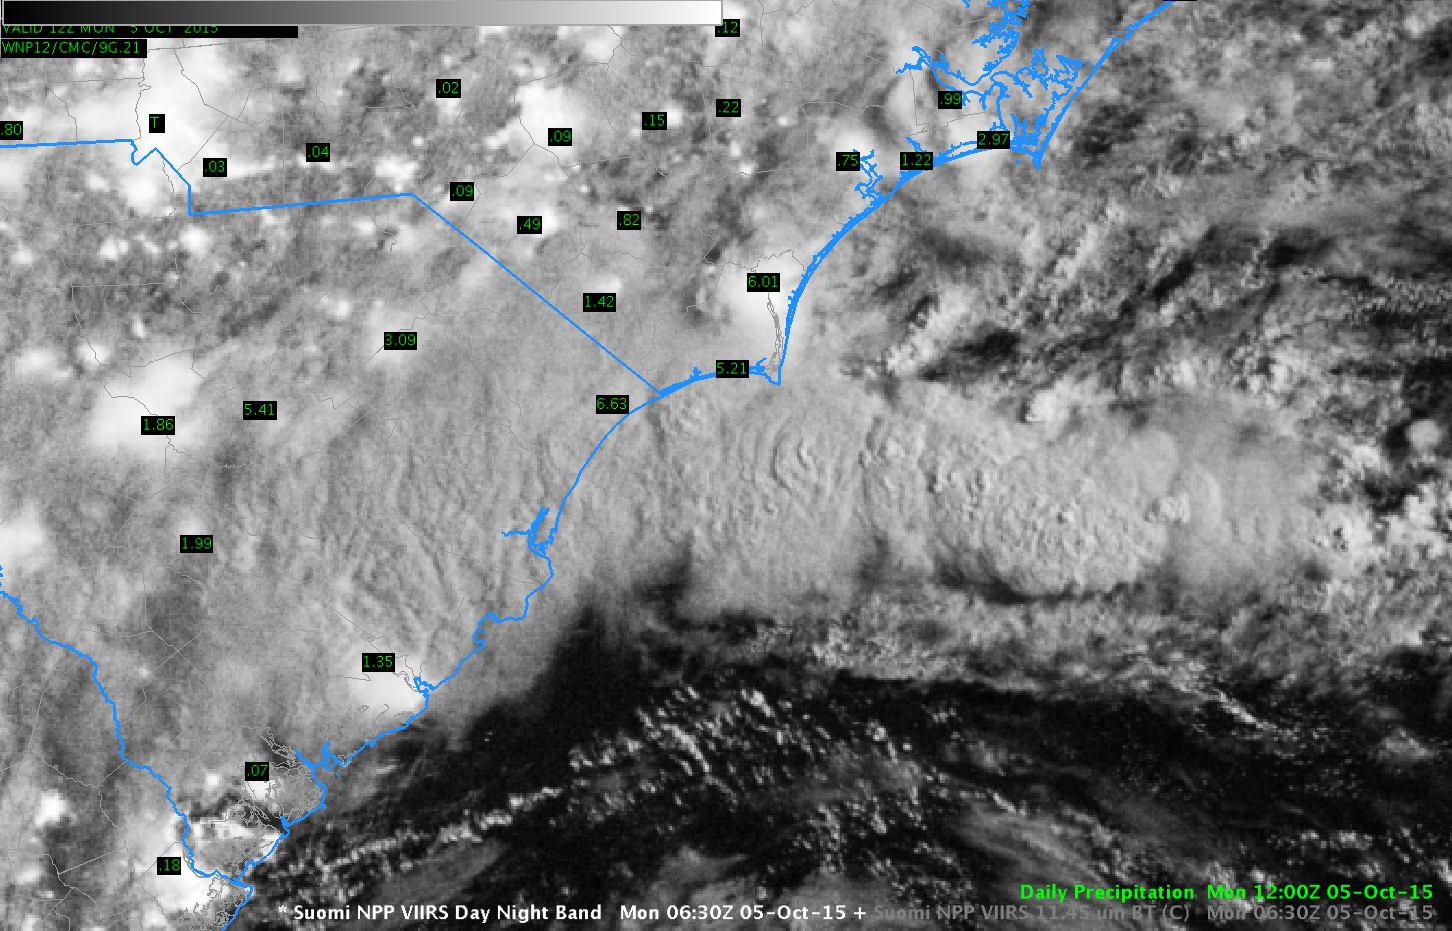
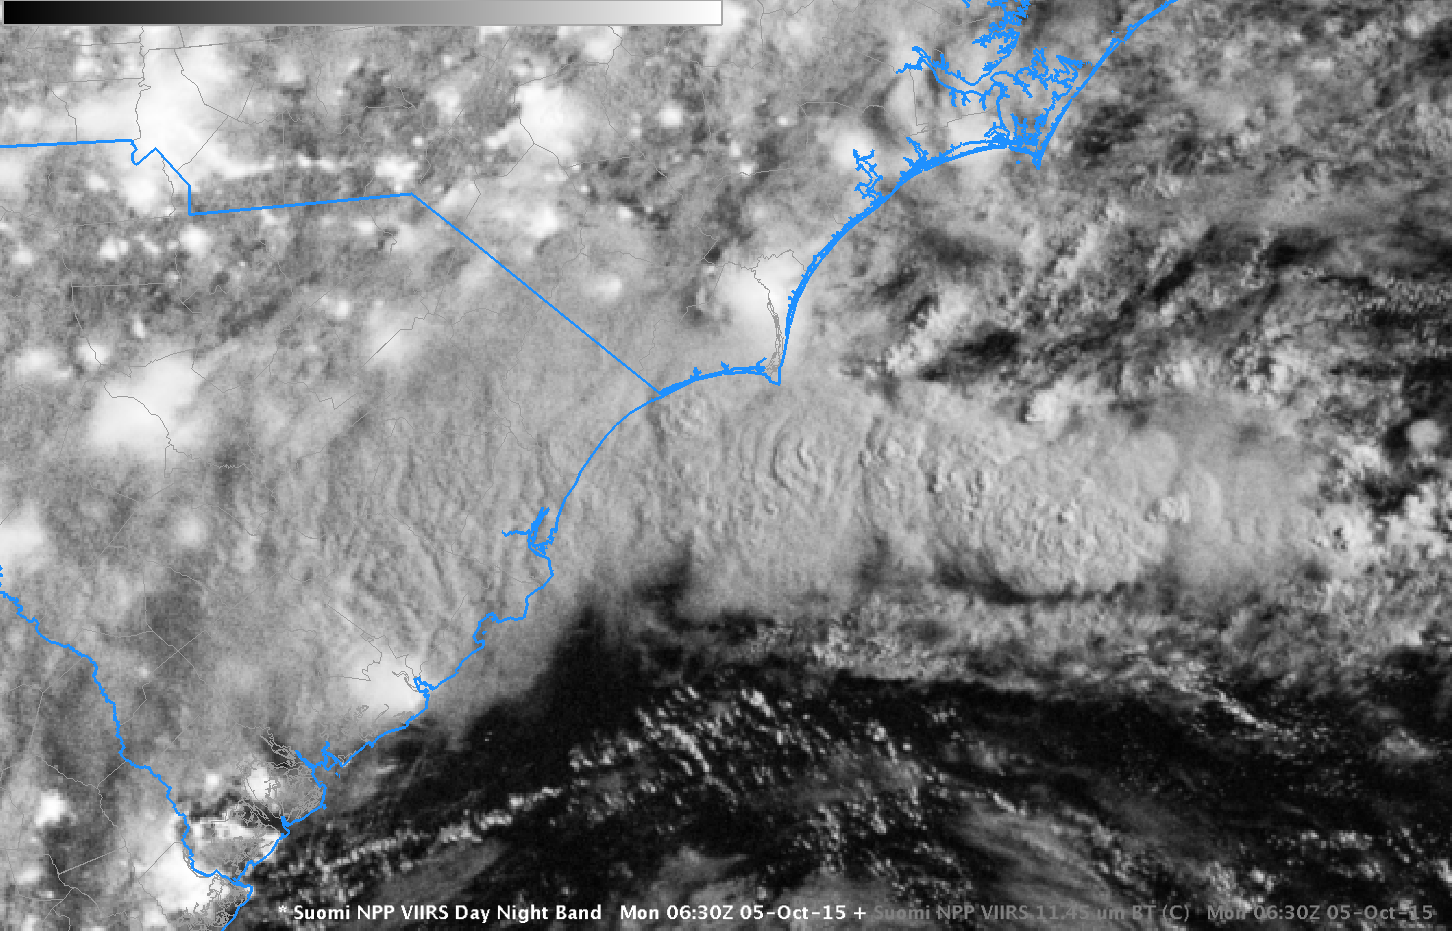
Historic rainfalls associated with tropical moisture and a surface low pressure system inundated portions of South and North Carolina over the weekend. During the first four days of October, Charleston SC had 17+” of rain, Downtown Charleston had more than 16″, Columbia had 11″, Myrtle Beach had 14″. In fact, new records were set for greatest 1-day, 2-day, 3-day and 4-day rainfall at Charleston and Columbia (and storm-total rainfall amounts were as high as 26.88 inches in Charleston county; click here for a YouTube video showing radar reflectivity from 1-6 October). The toggle above shows the Suomi NPP VIIRS Day/Night Band (with and without 24-hour precipitation totals ending 5 October, after the heaviest rain had moved north of Charleston) and Suomi NPP VIIRS 11.45 µm infrared imagery at 0630 UTC (2:30 am local time) — overshooting tops are evident within a band of strong convection offshore that was moving westward (inland) around the upper-level low pressure system located east of Jacksonville FL (as seen in the larger-scale version of the Day/Night Band image below).
![Suomi NPP VIIRS Day/Night Band Visible (0.70 µm) Imagery, 0630 UTC 5 October 2015 with surface analysis [click to enlarge]](https://cimss.ssec.wisc.edu/satellite-blog/wp-content/uploads/sites/5/2015/09/LargeScale_DNB_0630_5Oct2015_precip.png)
Suomi NPP VIIRS Day/Night Band Visible (0.70 µm) Imagery, 0630 UTC 5 October 2015 with surface analysis [click to enlarge]
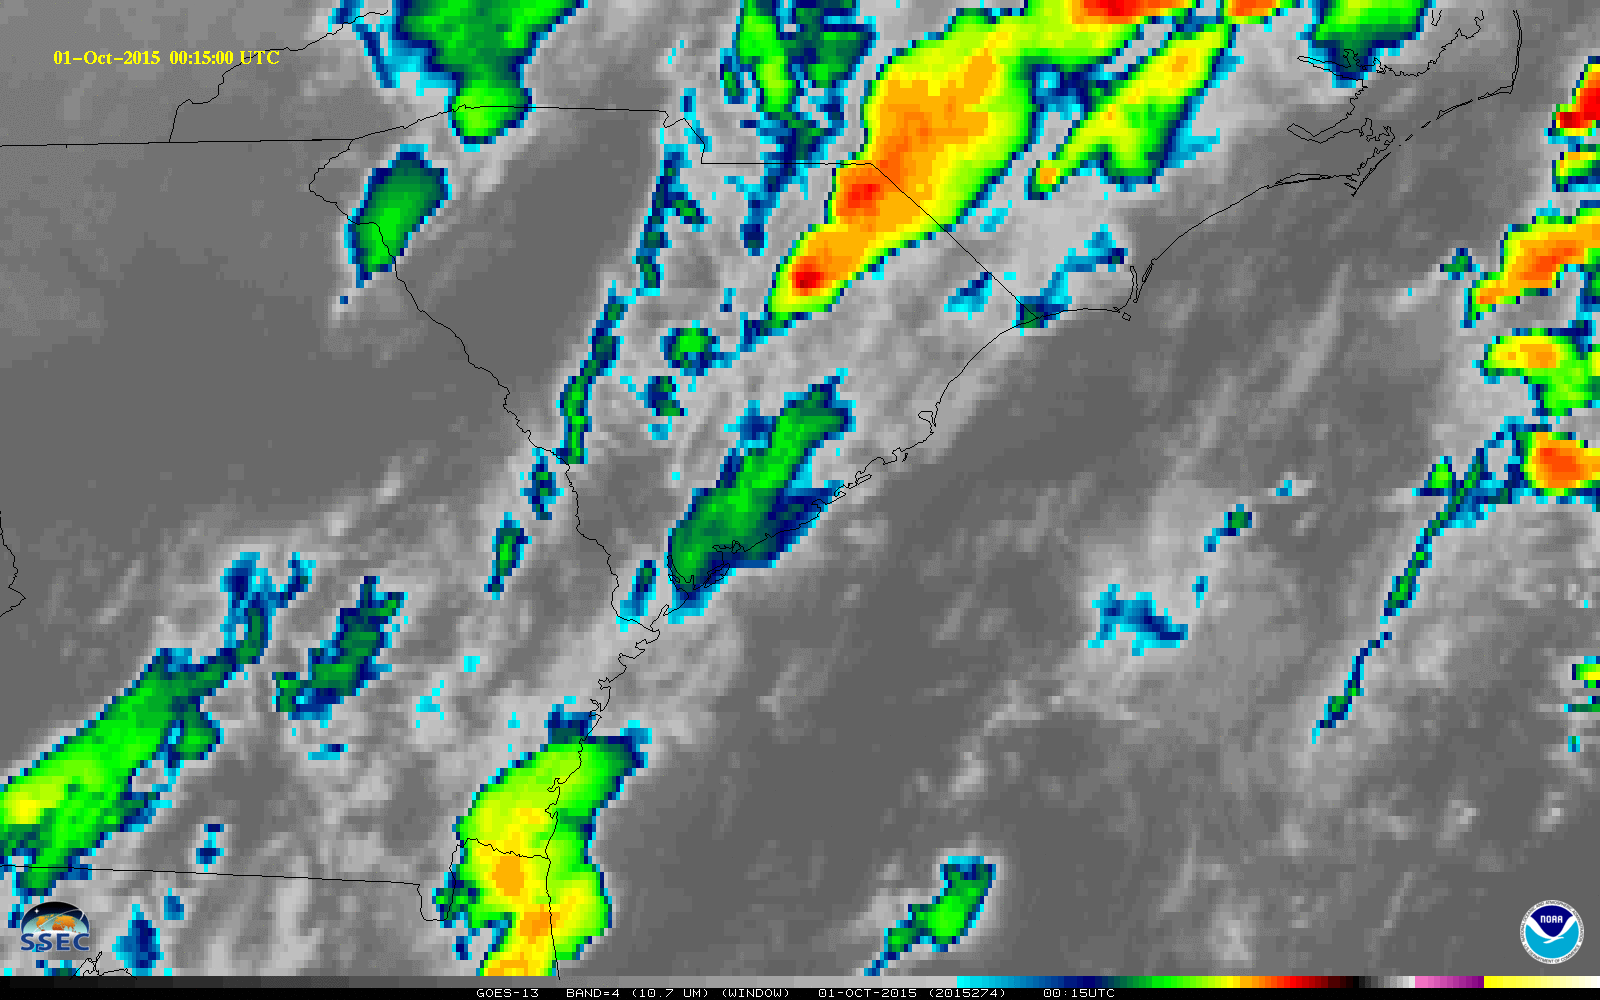
The animation of GOES-13 10.7 µm Infrared imagery, below (click to view mp4 loop; very large animated gif file available here; a YouTube video of all GOES-13 RSO Infrared magery from 1-4 October is here), shows the evolution of the atmospheric flow pattern, from thunderstorms moving southwest-to-northeast along the coast on 1 October to thunderstorms moving directly inland, first from southeast-to-northwest late on 3 October and then to east/northeast-to-west/southwest along the coast at the end of the animation as an upper-level low developed east of Jacksonville. Multiple rounds of heavy rains occurred as the orientation of the rain bands pivoted, always overlapping South Carolina.
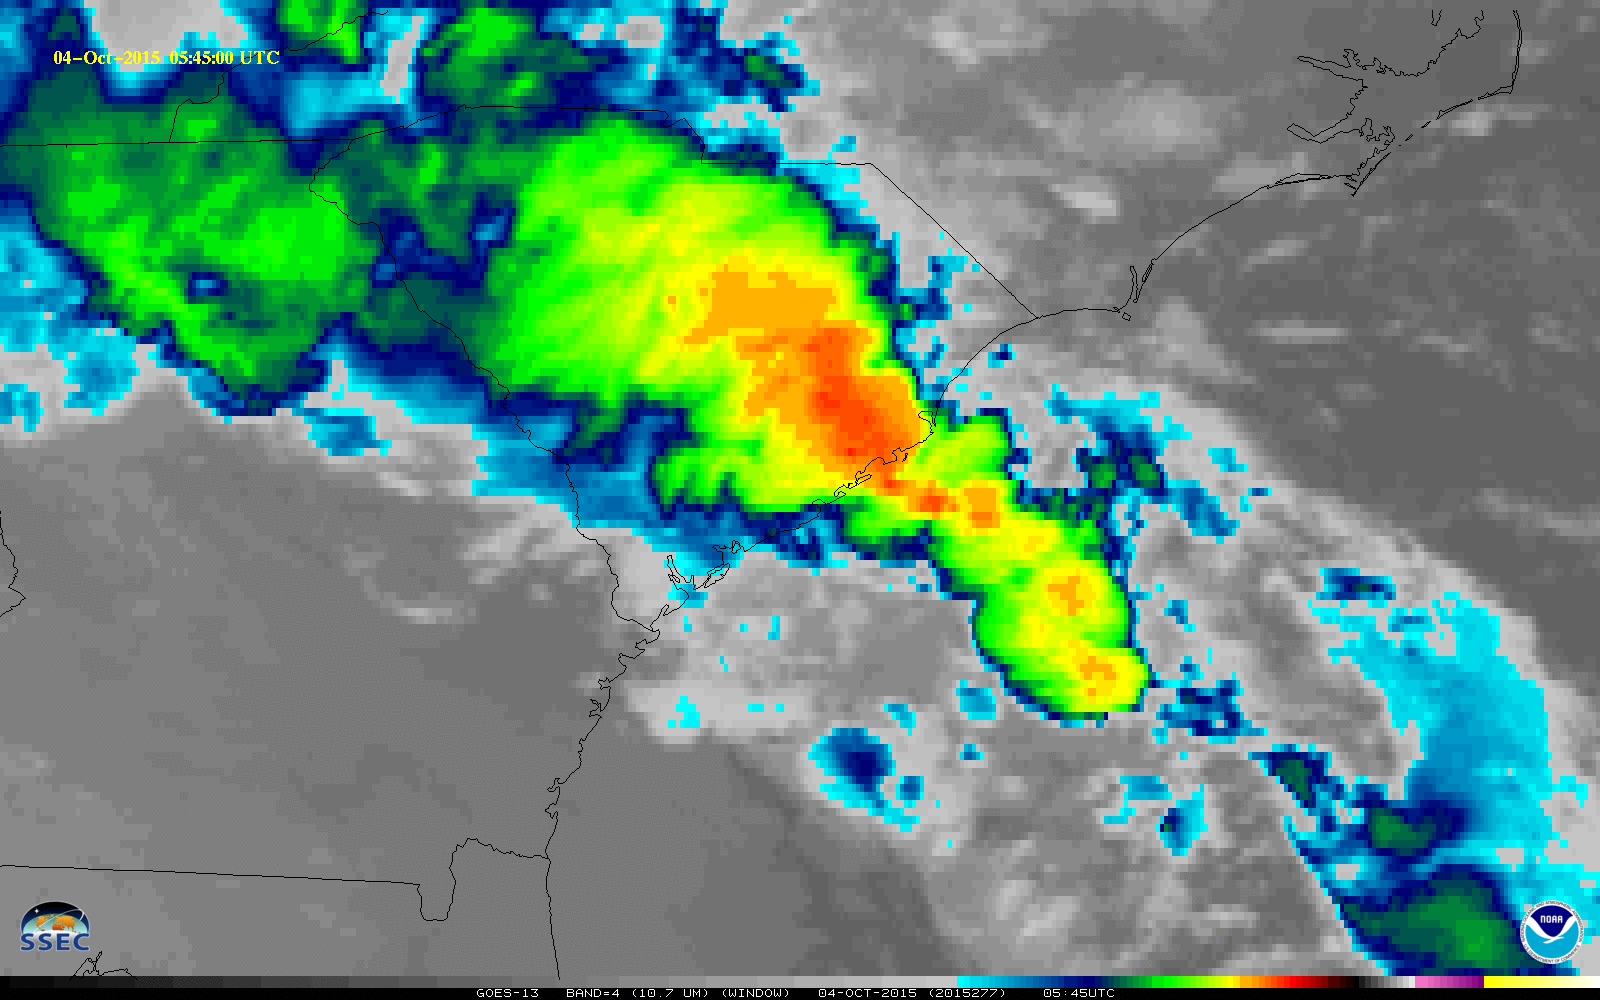
![GOES-13 Infrared (10.7 µm) Imagery, 0015 UTC 1 October through 1145 UTC 5 October 2015 [click to animate]](https://cimss.ssec.wisc.edu/satellite-blog/wp-content/uploads/sites/5/2015/09/1000x1600_AGOES13_B4_SC_FLOODING_2015277_054500.GIF)
GOES-13 Infrared (10.7 µm) Imagery, 0015 UTC 1 October through 1145 UTC 5 October 2015 [click to animate]
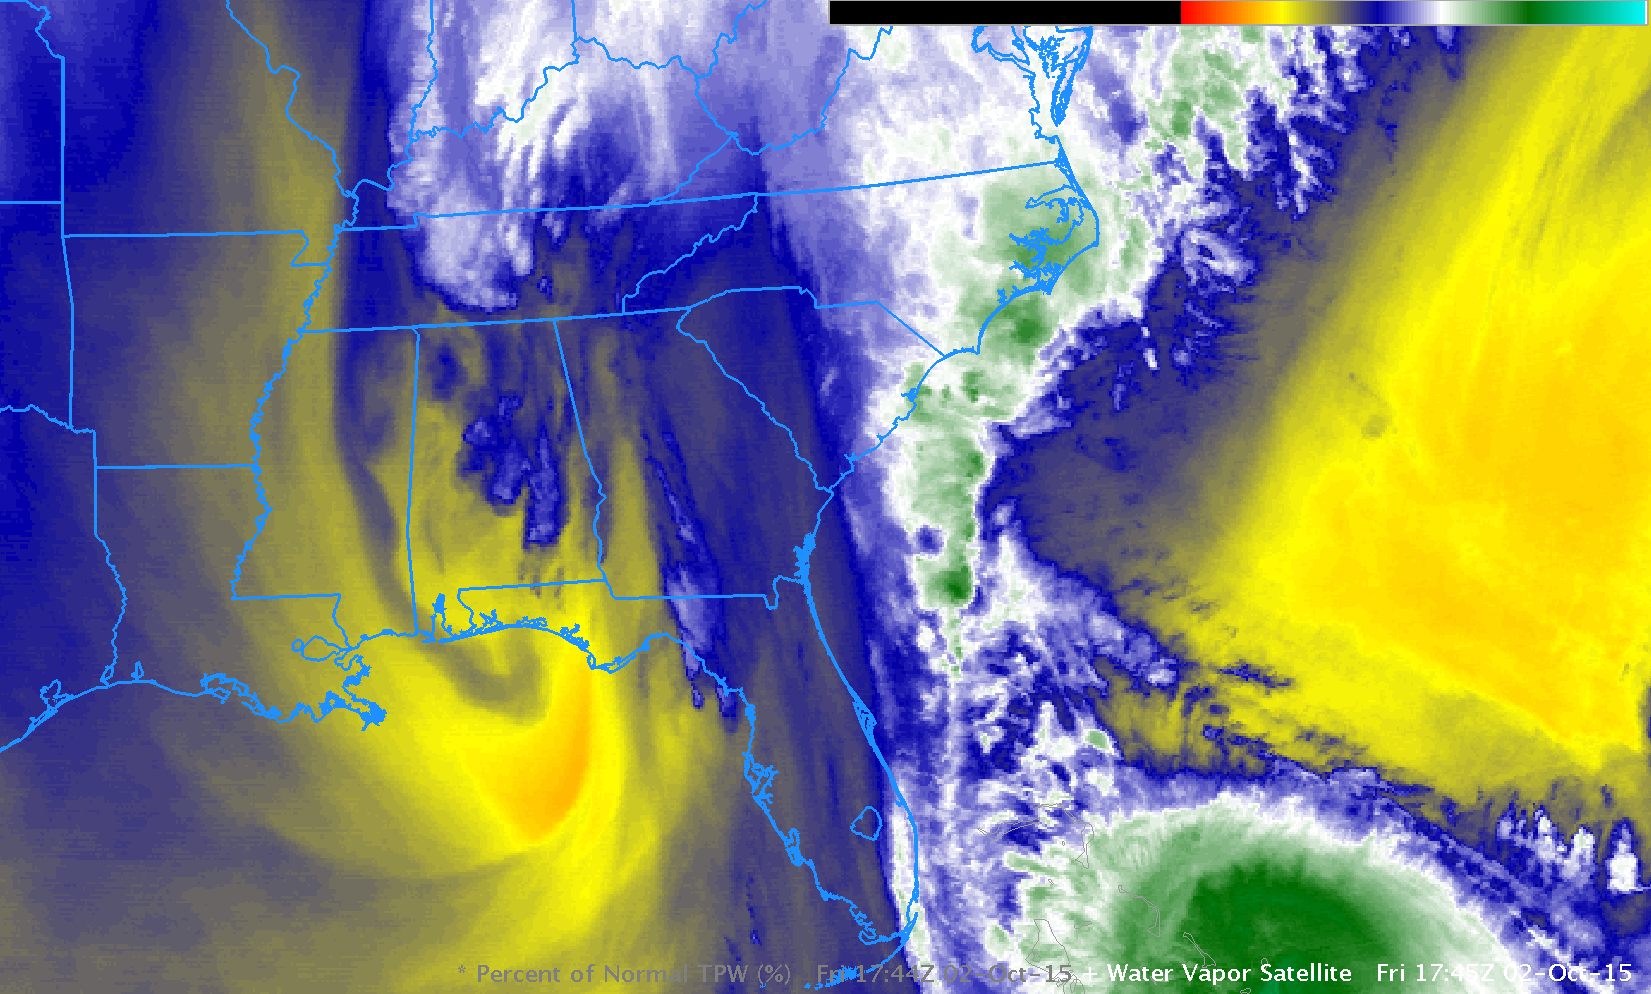
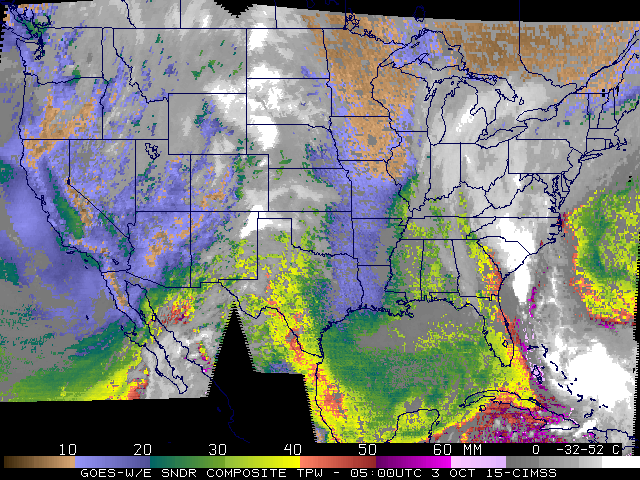
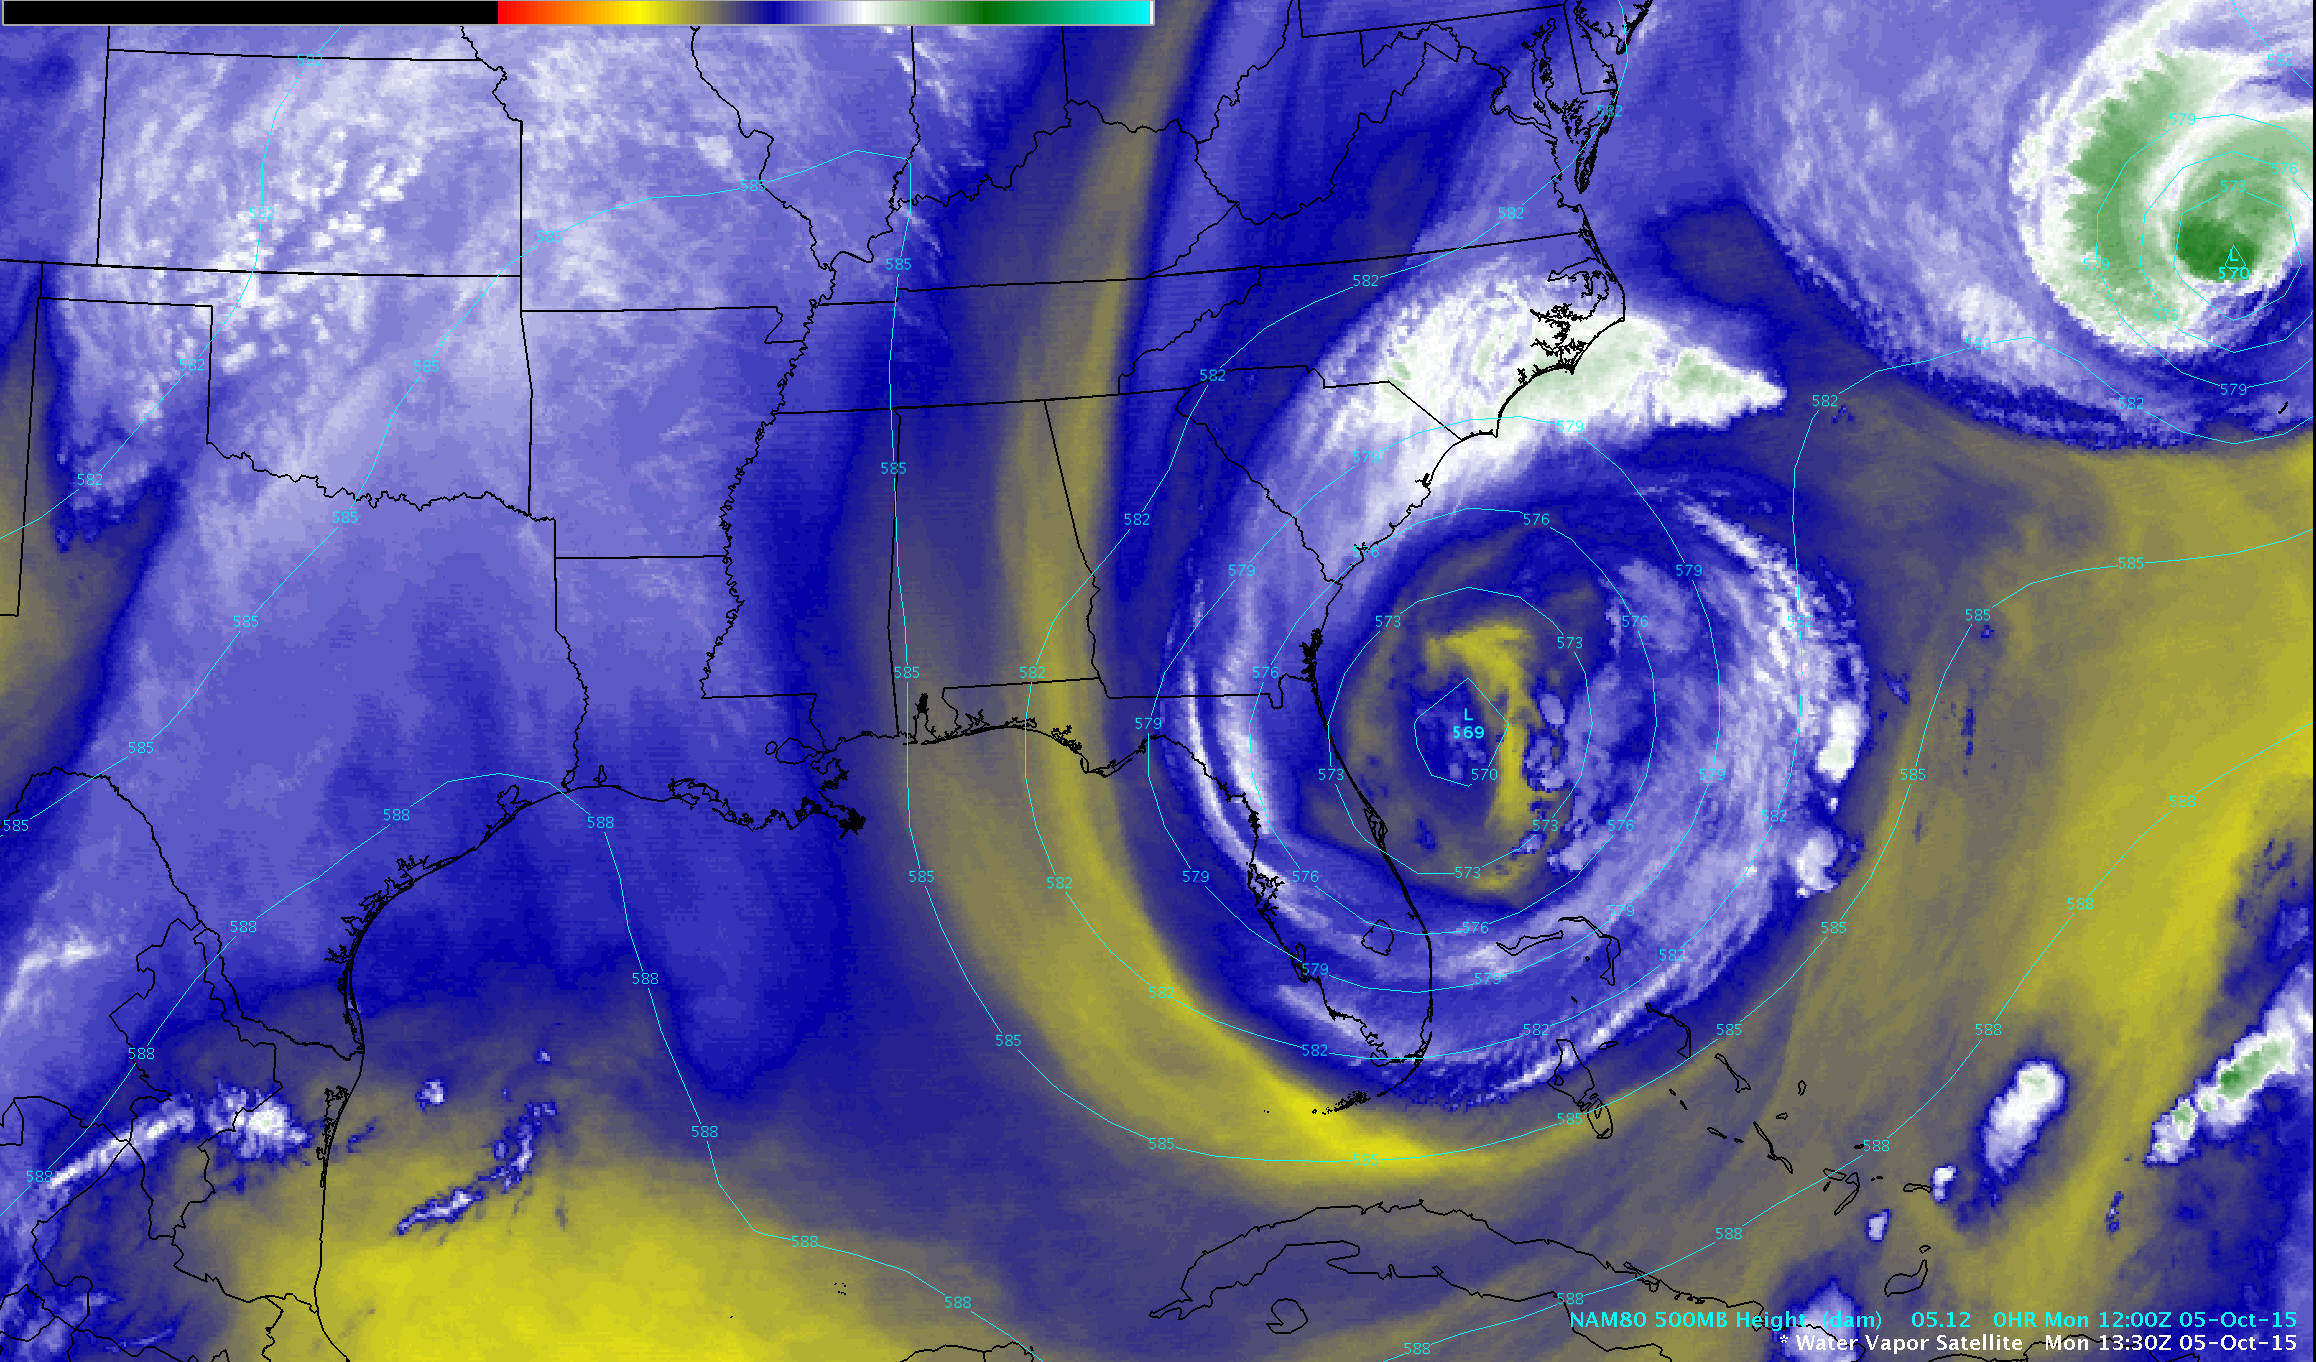
Much of the rain over Charleston fell between 0300 UTC on 3 October and 0700 UTC on 4 October, in two distinct events, as shown in the hourly GOES-13 Infrared image animation below. During the first bout of heavy rain that occurred late on the 2nd/early on the 3rd of October, cells moved over Charleston from the south; during the second bout of heavy rain, from the 3rd into the 4th, cells moved over Charleston from the southeast (this toggle of Total Precipitable Water from the GOES Sounder shows the convection offshore in regions of abundant moisture). The change in direction of cell motion was driven by the development of an upper-level low pressure system, as shown in the Water Vapor Imagery animation farther below. Both the thunderstorms over South Carolina and the thunderstorms supporting the evolution of Hurricane Joaquin benefited from the very moist tropical air mass that was over the Atlantic Ocean off southeast coast of the US.
![GOES-13 Infrared (10.7 µm) Imagery, 0245 UTC 3 October through 0745 UTC 4 October 2015 [click to animate]](https://cimss.ssec.wisc.edu/satellite-blog/wp-content/uploads/sites/5/2015/09/1000x1600_AGOES13_B4_SC_FLOODING_2015276_0245_2015277_074500anim.gif)
GOES-13 Infrared (10.7 µm) Imagery, 0245 UTC 3 October through 0745 UTC 4 October 2015 [click to animate]
![GOES-13 Infrared Water Vapor (6.5 µm) Imagery, 0015 UTC 1 October through 1445 UTC 5 October 2015 [click to animate]](https://cimss.ssec.wisc.edu/satellite-blog/wp-content/uploads/sites/5/2015/09/1000x1600_AGOES13_B3_SC_FLOODINGWV_animated_2015274_004500_180_2015278_144500_180_WVCOLOR35.gif)
GOES-13 Infrared Water Vapor (6.5 µm) Imagery, 0015 UTC 1 October through 1445 UTC 5 October 2015 [click to animate]
A composite of the MIMIC Total Precipitable Water product and WSR-88D radar reflectivity visualized using SSEC RealEarth, below, showed how the offshore plume of high TPW became very narrow and focused on South Carolina during the 44-hour period from 18 UTC on 02 October to 14 UTC on 04 October.
![MIMIC Total Precipitable Water product and Radar reflectivity [click to animate]](https://cimss.ssec.wisc.edu/satellite-blog/wp-content/uploads/sites/5/2015/10/151002-04_mimic_tpw_radar_reflectivity_SC_flooding_anim.gif)
MIMIC Total Precipitable Water product and Radar reflectivity [click to animate]
View only this post Read Less
![METOP ASCAT Scatterometer Winds, 1356 UTC 2 October and GOES-13 Visible (0.63 µm) imagery [click to enlarge]](https://cimss.ssec.wisc.edu/satellite-blog/wp-content/uploads/sites/5/2015/09/ASCAT_Joaquin_1356_02Oct2015.png)
![MIMIC Total Precipitable Water for the 72 hours ending 1900 UTC on 2 October [click to enlarge]](https://cimss.ssec.wisc.edu/satellite-blog/wp-content/uploads/sites/5/2015/09/MIMICTPW_ending1900UTC_2October2015.gif)
![GOES-13 Water Vapor Infrared Imagery (6.5 µm) and NESDIS Percent-of-Normal Blended Total Precipitable Water Product, 1745 UTC 2 October 2015 [click to enlarge]](https://cimss.ssec.wisc.edu/satellite-blog/wp-content/uploads/sites/5/2015/09/GOES_WV_BlendedTPW_1800UTC_02Otc2015toggle.gif)
![DMSP-18 SSMIS Microwave (85 GHz) and GOES-13 Infrared (10.7 µm) images [click to enlarge]](https://cimss.ssec.wisc.edu/satellite-blog/wp-content/uploads/sites/5/2015/09/150930_1245utc_goes13_ir_1259utc_ssmis_mw_Juaquin_anim.gif)
![GOES-13 Visible (0.63 µm) images [click to play animation]](https://cimss.ssec.wisc.edu/satellite-blog/wp-content/uploads/sites/5/2015/09/150930_goes13_visible_Hurricane_Joaquin_anim.gif)
![GOES-13 Infrared (10.7 µm) images [click to play animation]](https://cimss.ssec.wisc.edu/satellite-blog/wp-content/uploads/sites/5/2015/09/150930_goes13_ir_Hurricane_Joaquin_anim.gif)
![GOES-13 Infrared (10.7 µm) images and METOP-A ASCAT Scatterometer winds, 0230 UTC on 1 October; the NHC Forecast track for Joaquin is indicated [click to enlarge]](https://cimss.ssec.wisc.edu/satellite-blog/wp-content/uploads/sites/5/2015/09/ASCAT_Joaquin_0230_01Oct2015.png)
![GOES-13 Infrared (10.7 µm) images [click to play animation]](https://cimss.ssec.wisc.edu/satellite-blog/wp-content/uploads/sites/5/2015/10/151001_goes13_ir_Hurricane_Joaquin_anim.gif)
![GOES-13 Visible (0.63 µm) images [click to play animation]](https://cimss.ssec.wisc.edu/satellite-blog/wp-content/uploads/sites/5/2015/10/151001_goes13_visible_Hurricane_Joaquin_anim.gif)
