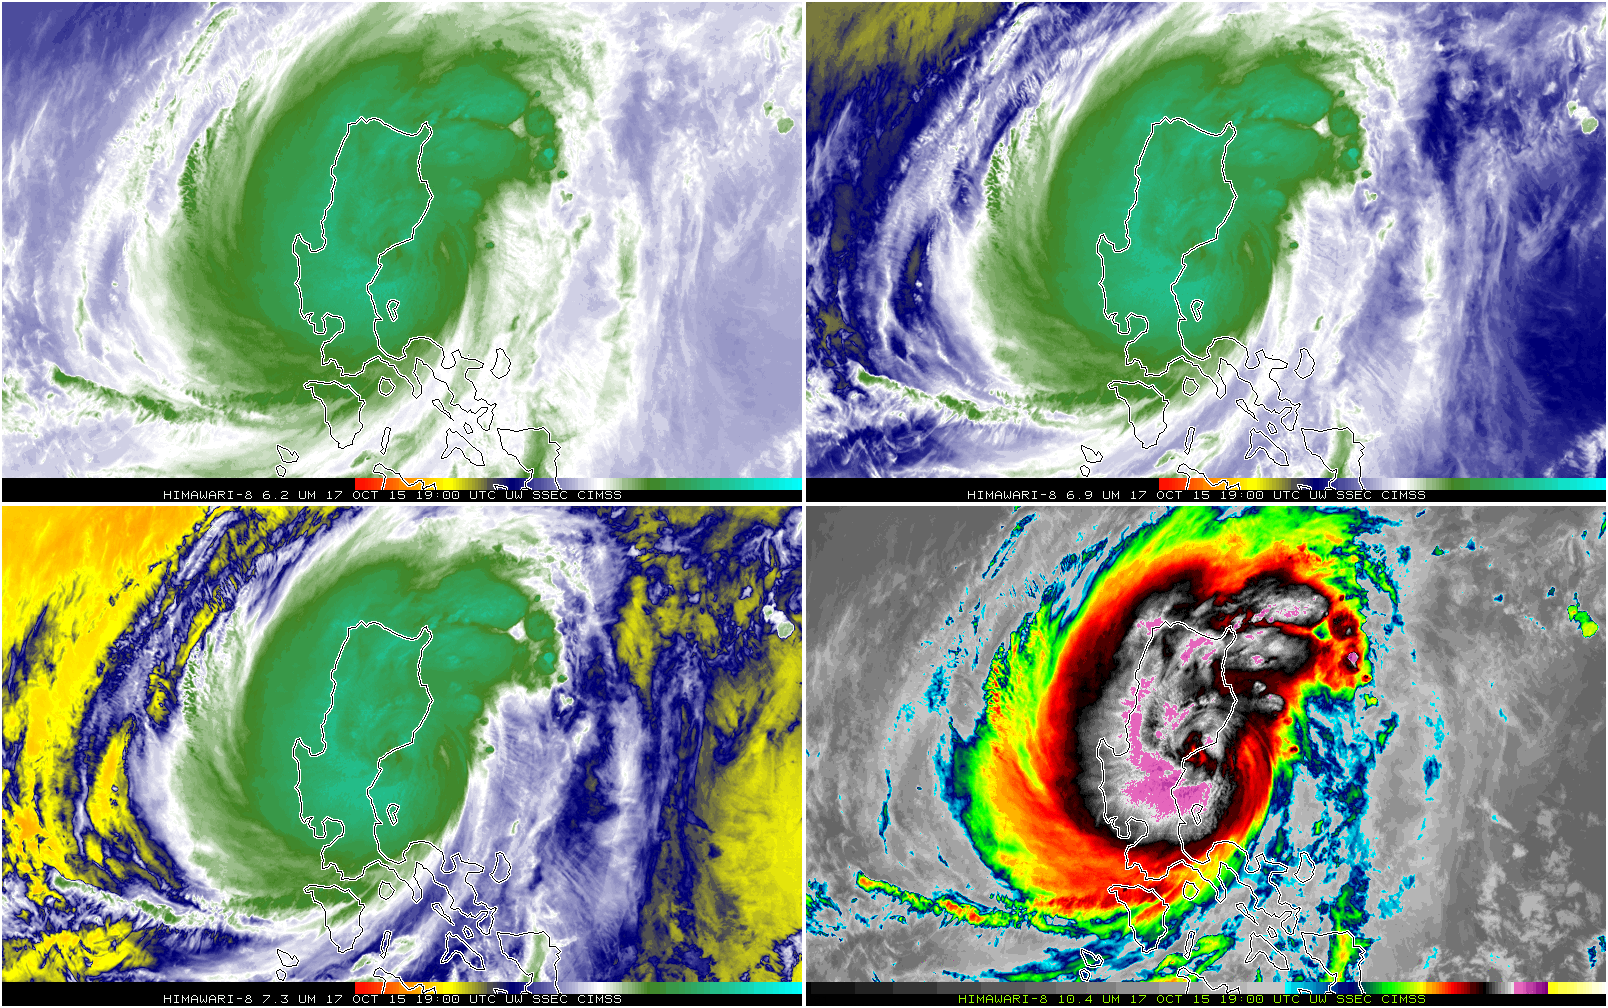
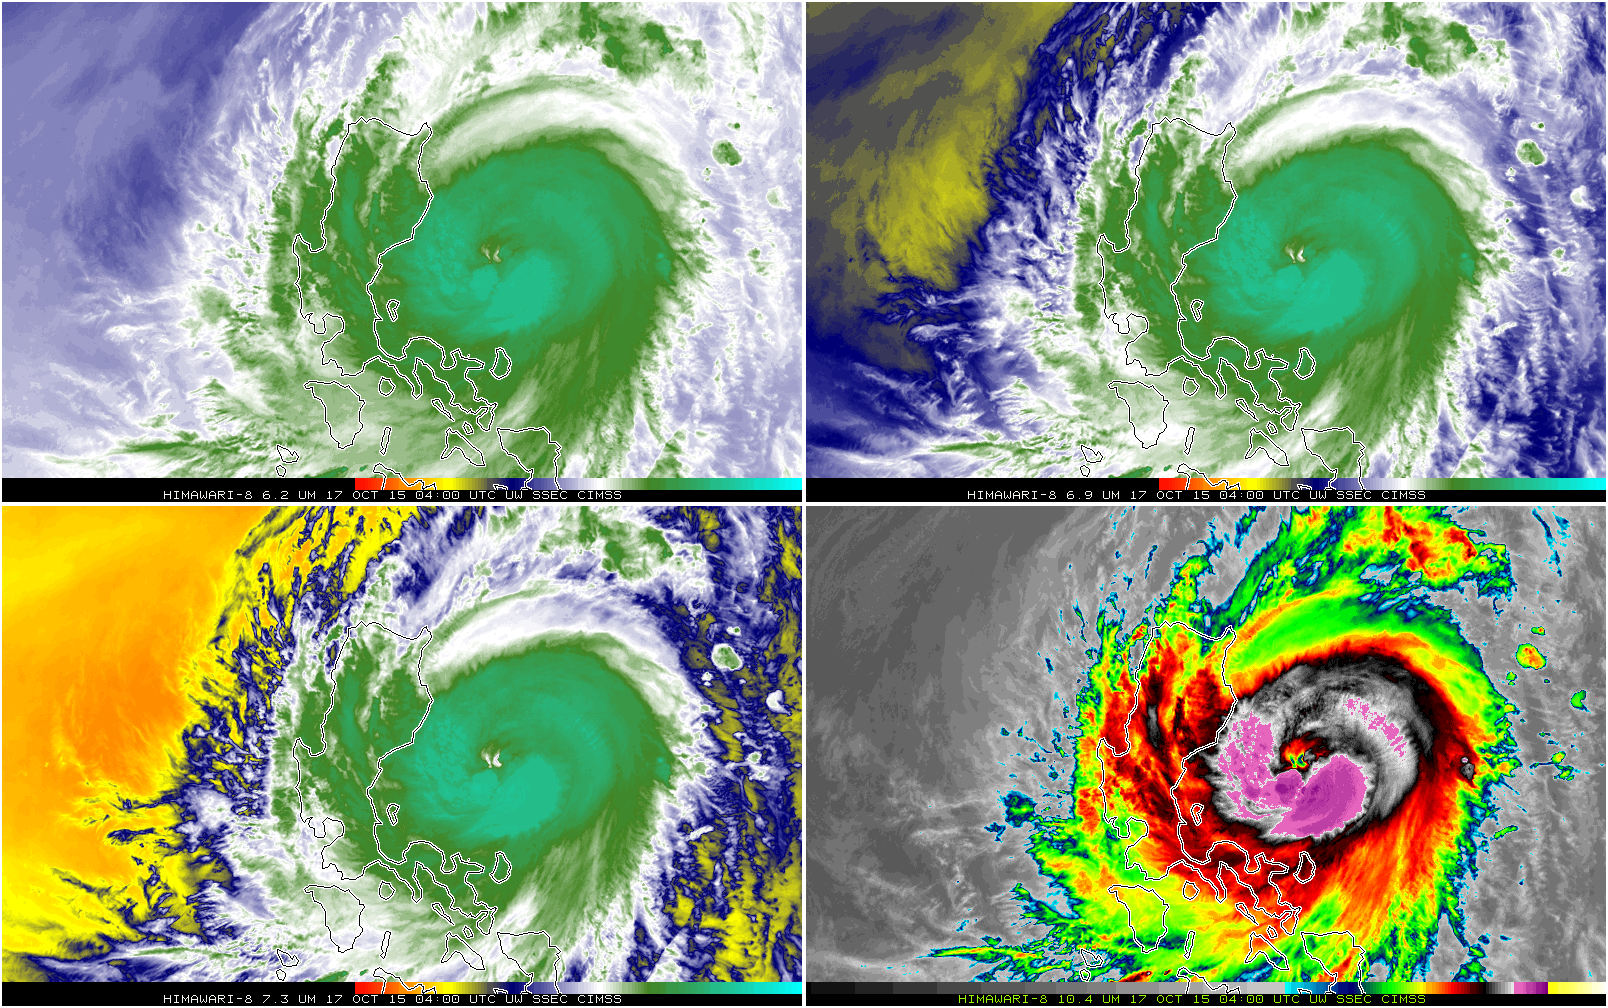
Typhoon Koppu hit the northern Philippines island of Luzon on Saturday 18 October. The 4-panel mp4 animation above (Click here for an animated gif) shows the 3 water vapor infrared channels (6.2 µm, 6.9 µm and 7.3 µm) and the window infrared channel (10.35 µm) from the Himawari-8 satellite. There... Read More
![Himawari-8 Infrared Imagery, 0400-2030 UTC 17 October 2015 [click for mp4 animation]](https://cimss.ssec.wisc.edu/satellite-blog/wp-content/uploads/sites/5/2015/10/H8_4Panel_17Oct2015_1800.GIF)
Himawari-8 Infrared Imagery, 0400-2030 UTC 17 October 2015; 6.2 µm (Upper Left), 6.9 µm (Upper Right), 7.3 µm (Lower Left), 10.35 µm (Lower Right) [click for mp4 animation]
Typhoon Koppu hit the northern Philippines island of Luzon on Saturday 18 October. The 4-panel mp4 animation above (Click
here for an animated gif) shows the 3 water vapor infrared channels (6.2 µm, 6.9 µm and 7.3 µm) and the window infrared channel (10.35 µm) from the Himawari-8 satellite. There is value in three water vapor channels because the shorter wavelength (6.2 µm) better captures high-level moisture whereas the longer wavelength better captures mid-level moisture. Cirrus is readily apparent in the 6.2 µm channel; tropical cumulus is more readily apparent underneath cirrus in the 7.3 µm channel. Compare the two channels in
this animation, for example, or in
this one. The three water vapor channels on Himawari-8 (similar to the 3 that will fly on the
GOES-R ABI instrument) give a three-dimensional view of atmospheric moisture. All four channels above show the approach of Koppu towards Luzon, with the ragged eye filling rapidly at landfall.
![Morphed Microwave Imagery showing Koppu's Eyewall [click to enlarge]](https://cimss.ssec.wisc.edu/satellite-blog/wp-content/uploads/sites/5/2015/10/Koppu_Microwave_gifsBy12hr_17Oct2015.gif)
Morphed Microwave Imagery showing Koppu’s Eyewall [click to enlarge]
The structure of Koppu’s eyewall is depicted above in a 24-hour morphed animation of microwave data (
Source, as referred to from
here). The nearly complete eyewall rapidly loses its integrity as the storm moves onshore. Total Precipitable Water (below, taken from the MIMIC Total Precipitable Water Site) shows Koppu on the northern edge of the rich moisture source that is the Intertropical Convergence Zone (Typhoon Champi is to Koppu’s east). Notably, the storm stalled over Luzon after making landfall; flooding rainfalls occurred.
![MIMIC Total Precipitable Water over the Western North Pacific Basin [click to enlarge]](https://cimss.ssec.wisc.edu/satellite-blog/wp-content/uploads/sites/5/2015/10/MIMIC_TPW_72hEnding1200_19Oct2015.gif)
MIMIC Total Precipitable Water over the Western North Pacific Basin [click to enlarge]
Himawari-8 also captured the evolution of the storm in visible imagery. The full-resolution animation from 0100-0930 UTC on 17 October is shown below (a slower animation is available
here). Periodic bursts of deep convection are apparent in the curved bands near the storm center. These convective bursts are better resolved with the 10-minute imagery from Himawari-8 than from 15-minute data from MTSAT-2 (or COMS-1).
![Himawari-8 Visible Imagery (0.63) from 0100 through 0930 UTC on 17 October [click to animate]](https://cimss.ssec.wisc.edu/satellite-blog/wp-content/uploads/sites/5/2015/10/H8VIS_17Oct_0830.GIF)
Himawari-8 Visible Imagery (0.63) from 0100 through 0930 UTC on 17 October [click to animate]
View only this post
Read Less
![MIMIC Total Precipitable Water over the Western North Pacific Basin [click to enlarge]](https://cimss.ssec.wisc.edu/satellite-blog/content/uploads/2015/10/MIMIC_TPW_72hEnding1200_19Oct2015.gif)
![Himawari-8 Visible Imagery (0.63) from 0100 through 0930 UTC on 17 October [click to animate]](https://cimss.ssec.wisc.edu/satellite-blog/wp-content/uploads/sites/5/2015/10/H8VISKoppu_17Oct_0100_0930anim.gif)
![GOES-1 Visible Imagery, 17 January 1983 [click to animate]](https://cimss.ssec.wisc.edu/satellite-blog/wp-content/uploads/sites/5/2015/10/800x1000_AGOES01_B1_GOES01_PACIFIC_1983017_191500_1PANEL.GIF)
![Terra MODIS true-color image [click to enlarge]](https://cimss.ssec.wisc.edu/satellite-blog/wp-content/uploads/sites/5/2015/10/151011_1657utc_terra_modis_truecolor_MN_WI_MI.jpg)
![Terra MODIS true-color and false-color images [click to enlarge]](https://cimss.ssec.wisc.edu/satellite-blog/wp-content/uploads/sites/5/2015/10/151011_1657utc_terra_modis_truecolor_falsecolor_MN_WI_MI_anim.gif)
![Terra MODIS true-color image [click to enlarge]](https://cimss.ssec.wisc.edu/satellite-blog/wp-content/uploads/sites/5/2015/10/151012_1603utc_terra_modis_truecolor_NY_VT_NH_MA.jpg)
![Terra MODIS true-color image [click to enlarge]](https://cimss.ssec.wisc.edu/satellite-blog/wp-content/uploads/sites/5/2015/10/151012_1603utc_terra_modis_truecolor_NY_PA.jpg)
![Terra MODIS true-color image [click to enlarge]](https://cimss.ssec.wisc.edu/satellite-blog/wp-content/uploads/sites/5/2015/10/151012_1604utc_terra_modis_truecolor_WV_MD_VA.jpg)
![Suomi NPP VIIRS true-color image [click to enlarge]](https://cimss.ssec.wisc.edu/satellite-blog/wp-content/uploads/sites/5/2015/10/151012_1723utc_suomi_npp_viirs_truecolor_Northeast_US_anim.gif)
![GOES-15 Infrared Water Vapor (6.5 µm) Imagery, 0000 UTC 5 October through 0900 UTC 9 October 2015 [click to animate]](https://cimss.ssec.wisc.edu/satellite-blog/wp-content/uploads/sites/5/2015/09/GOES15_WV_OHO_05-08October2015rockanim.gif)
![MIMIC Total Precipitable Water for 72 hours ending 0700 UTC 09 October 2015 [click to enlarge]](https://cimss.ssec.wisc.edu/satellite-blog/wp-content/uploads/sites/5/2015/09/MIMCTPW_OHO72hrsEnding06009October2015.gif)
![GOES-15 Water Vapor Imagery and ASCAT Scatterometer Winds, 0630 UTC on 9 October 2015 [click to enlarge]](https://cimss.ssec.wisc.edu/satellite-blog/wp-content/uploads/sites/5/2015/09/ASCATWINDS_WV_0630_09Oct2015.png)
