![GOES-13 Infrared Water Vapor (6.5 µm) images [click to play animation]](https://cimss.ssec.wisc.edu/satellite-blog/wp-content/uploads/sites/5/2015/09/1000x1600_AGOES13_B3_WVSE_UPPERLOW_animated_2015265_001500_180_2015268_131500_180_WVCOLOR35.gif)
GOES-13 Infrared Water Vapor (6.5 µm) Imagery [click to play animation]
A slowly-moving storm was migrating northeastward along the East Coast of the United States on 25 September 2015. The GOES-13 water vapor animation, above, shows the evolution of this system between 22 and 25 September 2015. The center of circulation in the water vapor imagery has wobbled around the state of Georgia for the past three days as a strong jet along the United States-Canada border has has maintained a series of surface High Pressure systems northeast of the storm, effectively blocking the Low Pressure’s exit from the southeast US.
Moisture available to this storm is depicted in the animation of MIMIC Total Precipitable Water, below. Moisture that moves southwestward towards the southeast US along the Gulf Stream is being joined by moisture moving northward from the tropical Atlantic Ocean.
![MIMIC Total Precipitable Water for the 72 hours ending 1400 UTC 25 September [click to enlarge]](https://cimss.ssec.wisc.edu/satellite-blog/wp-content/uploads/sites/5/2015/09/MIMIC_TPW_72h_Ending1500UTC25September2015.gif)
MIMIC Total Precipitable Water for the 72 hours ending 1400 UTC 25 September [click to enlarge]
This system has generated flooding rains over South Carolina. The GOES-13 Visible animation from 24 September 2015, below, shows persistent inflow off the Atlantic Ocean. Click here for a media report; Columbia SC reported 2.84″ of rain on 24 September, a record for the date.
![GOES-13 Visible (0.63 µm) images [click to play animation]](https://cimss.ssec.wisc.edu/satellite-blog/wp-content/uploads/sites/5/2015/09/150924_goes13_visible_Southeast_US_anim.gif)
GOES-13 Visible (0.63 µm) Imagery [click to play animation]
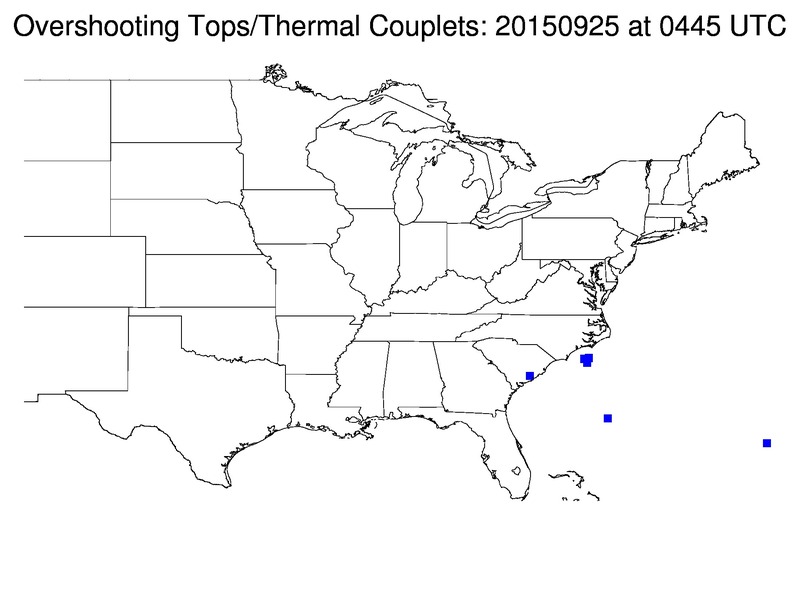
![Autodetected Overshooting Top from GOES-13 Infrared (10.7 µm) imagery, 0315-0545 UTC [click to enlarge]](https://cimss.ssec.wisc.edu/satellite-blog/wp-content/uploads/sites/5/2015/09/overtop_east_20150925_0315-0545anim.gif)
Autodetected Overshooting Top from GOES-13 Infrared (10.7 µm) imagery, 0315-0545 UTC [click to enlarge]
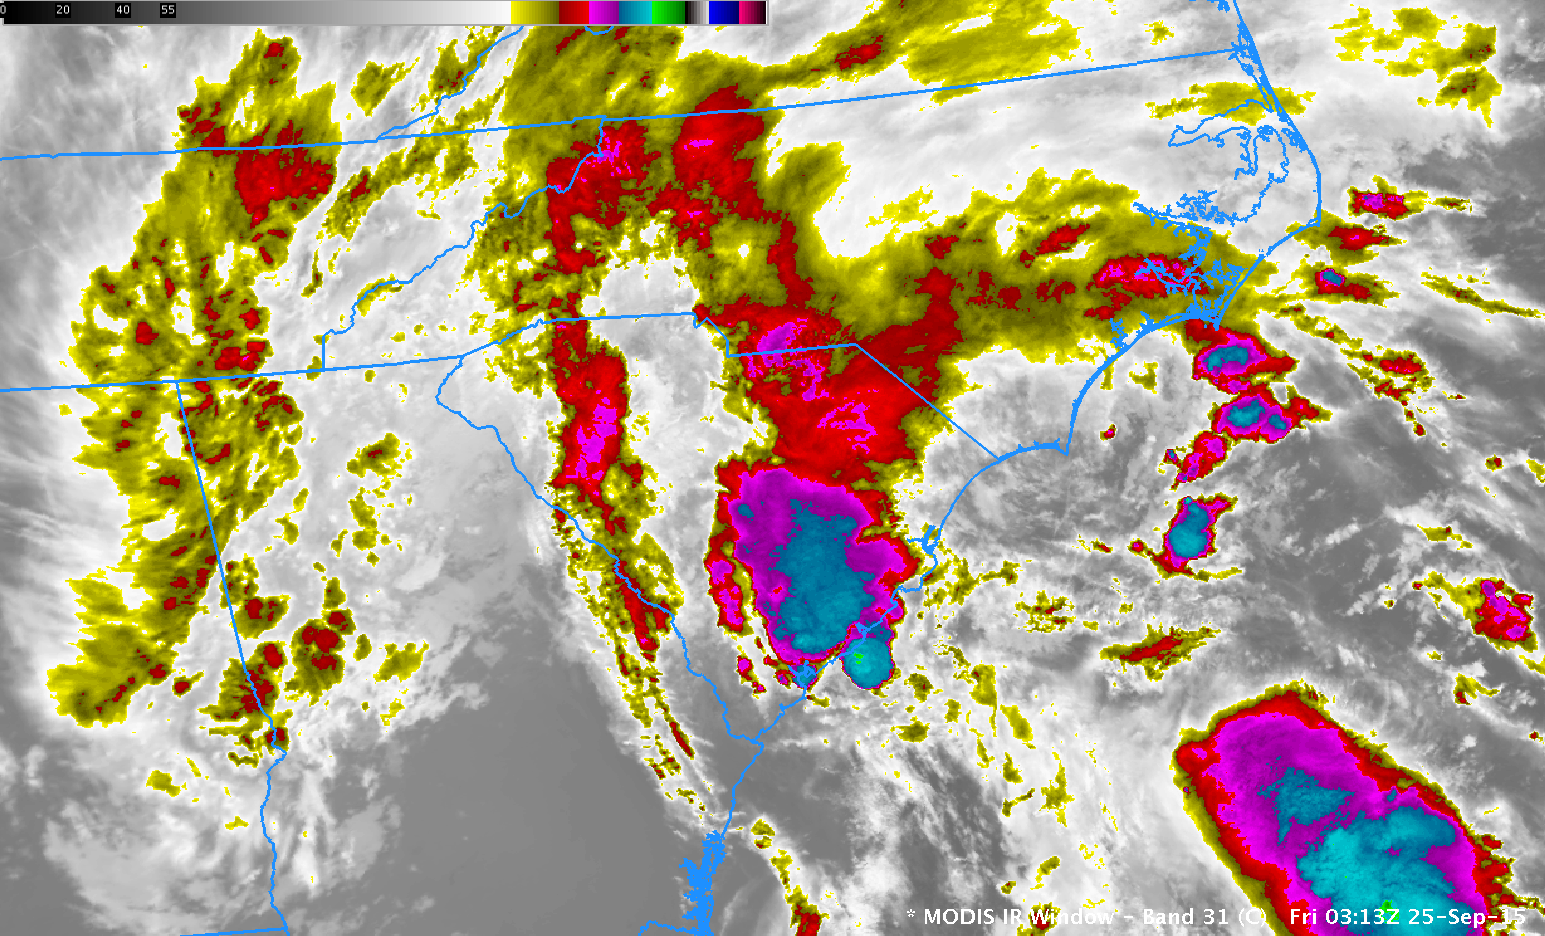
![Terra MODIS 11.0 µm and Suomi/NPP VIIRS 11.45 µm infrared imagery [click to enlarge]](https://cimss.ssec.wisc.edu/satellite-blog/wp-content/uploads/sites/5/2015/09/150925_0313utc_0618utc_modis_viirs_ir_Johns_Island_SC_tornado_anim.gif)
Terra MODIS 11.0 µm and Suomi/NPP VIIRS 11.45 µm infrared imagery [click to enlarge]
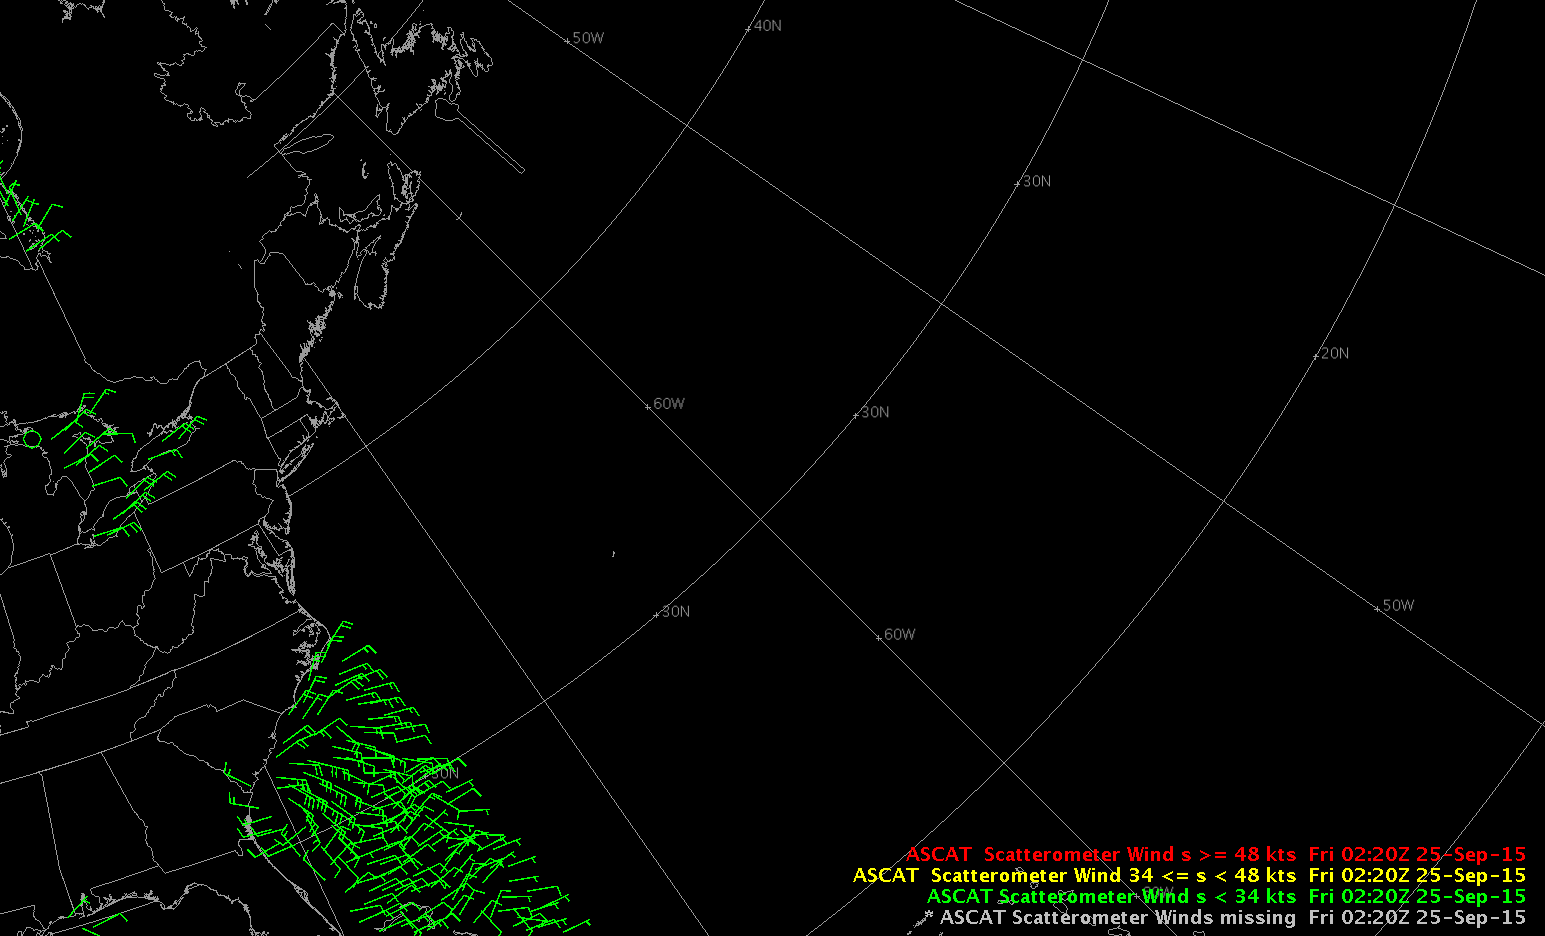
![METOP-B ASCAT Scatterometer Winds, 0000-1500 UTC over the western Atlantic [click to enlarge]](https://cimss.ssec.wisc.edu/satellite-blog/wp-content/uploads/sites/5/2015/09/ASCATWinds_0051_to_1535UTC_25September2015anim.gif)
METOP-B ASCAT Scatterometer Winds, 0000-1500 UTC over the western Atlantic [click to enlarge]
View only this post Read Less
![GOES-13 Visible (0.63 µm) imagery and surface observations of visibility; Richland County is outlined [click to play animation]](https://cimss.ssec.wisc.edu/satellite-blog/wp-content/uploads/sites/5/2015/09/GOES13_VIS_1330_1430_25SEP2015anim.gif)
![Suomi NPP VIIRS "fog/stratus product" IR brightness temperature difference images [click to enlarge]](https://cimss.ssec.wisc.edu/satellite-blog/wp-content/uploads/sites/5/2015/09/150925_0756utc_0937utc_suomi_npp_viirs_ND_fog_product_btd_anim.gif)
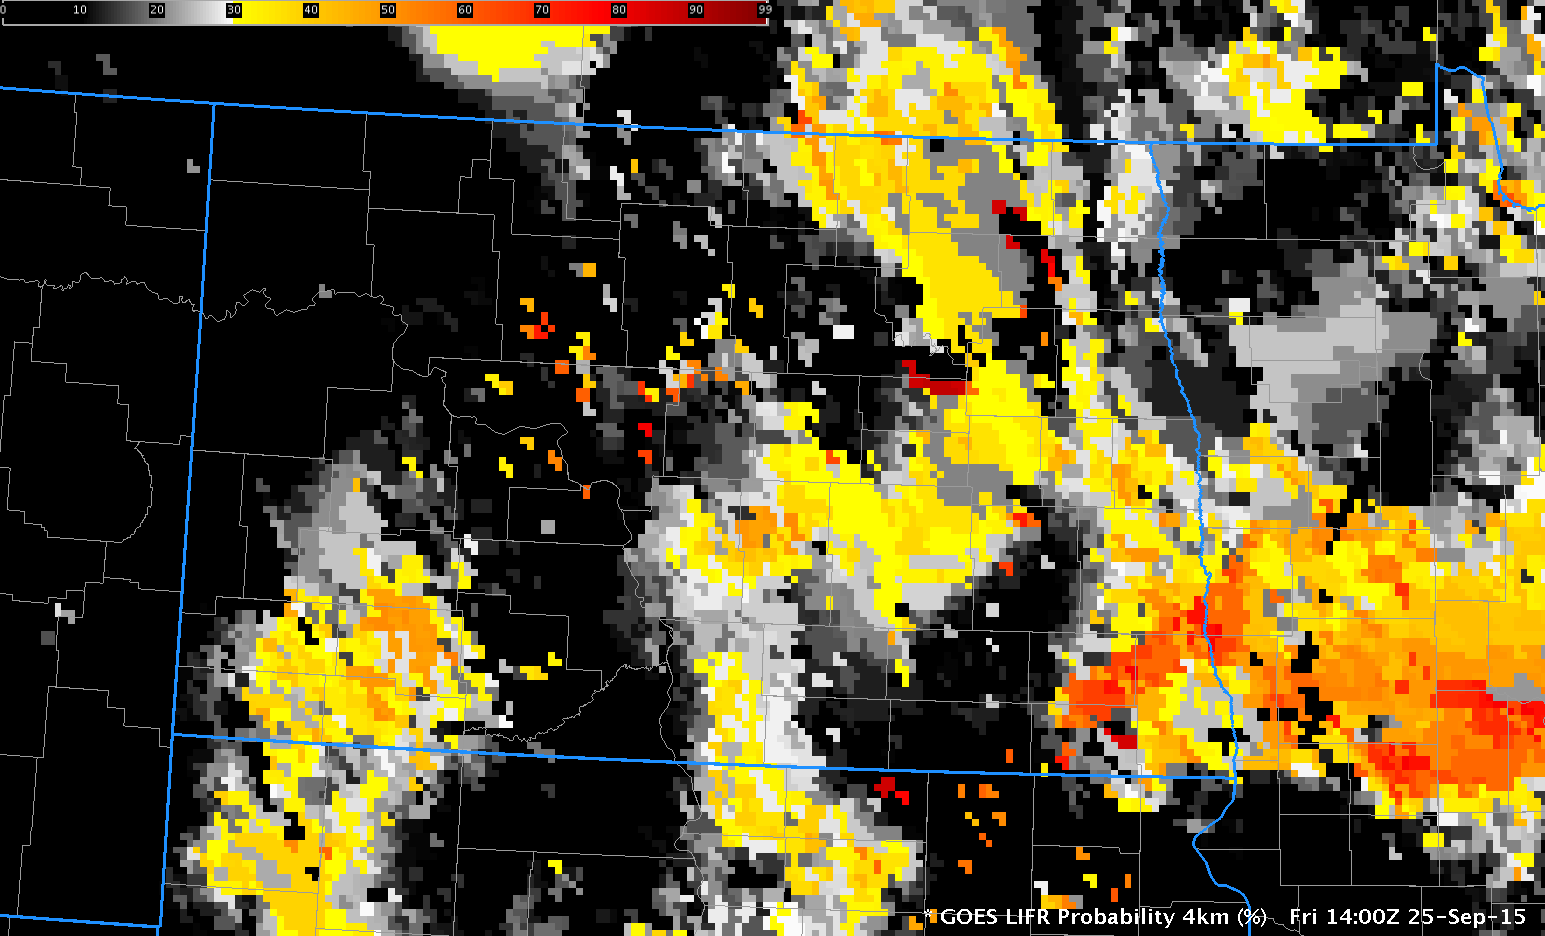
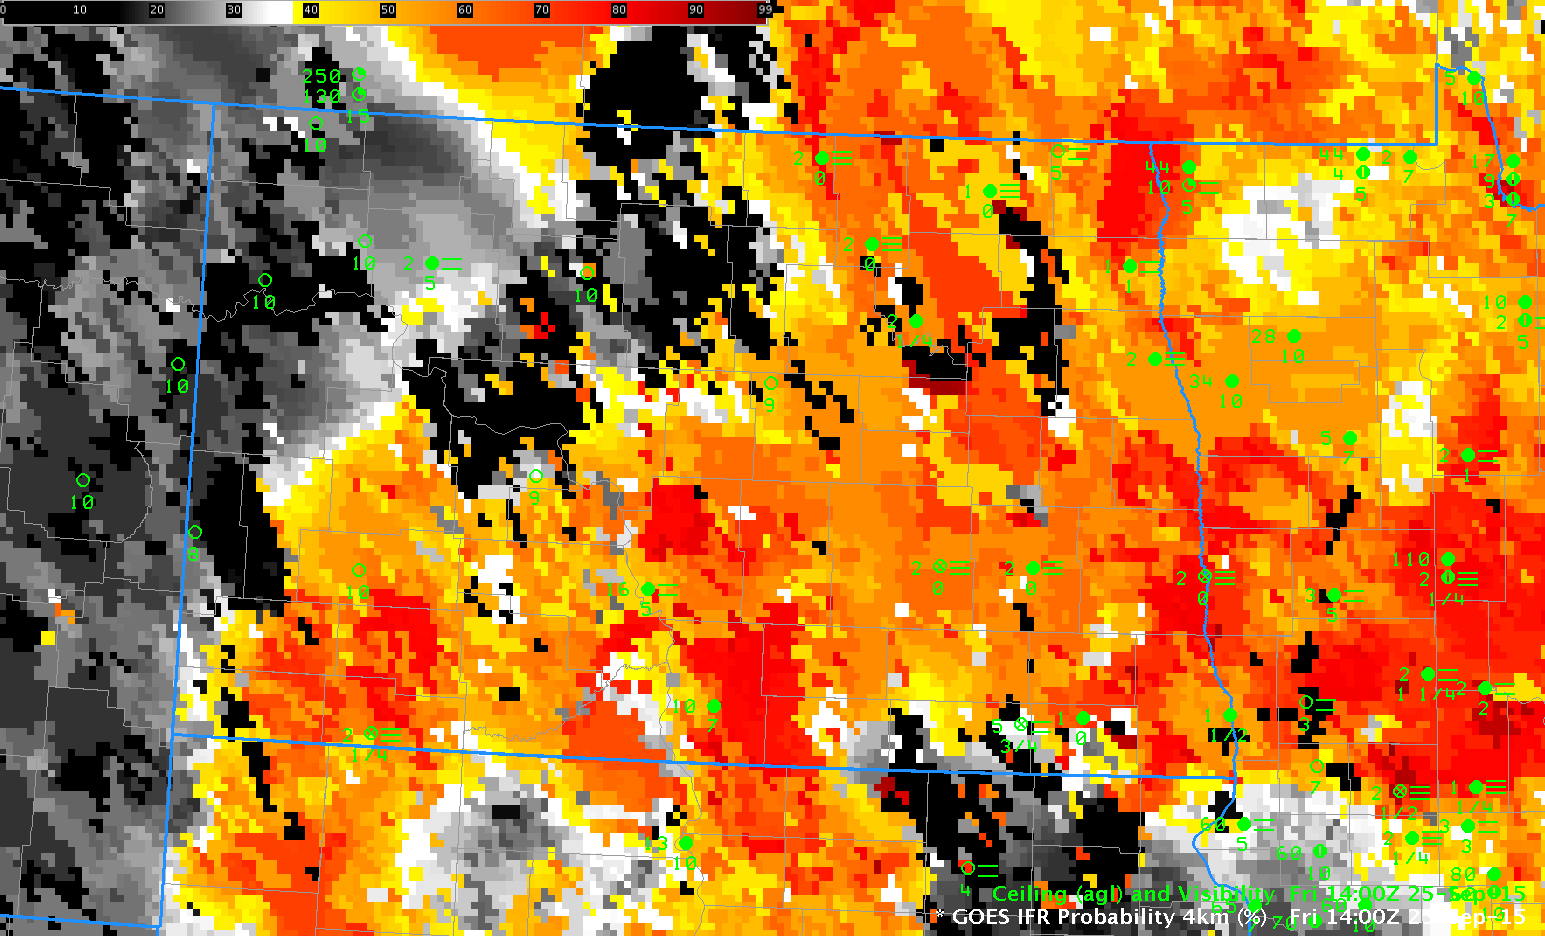
![GOES-R IFR Probability fields, 1300-1515 UTC on 25 September 2015 [click to play animation]](https://cimss.ssec.wisc.edu/satellite-blog/wp-content/uploads/sites/5/2015/09/GOES_R_IFRPROB_1300_1515UTC_25Sept2015anim.gif)
![GOES-R Low IFR Probability field, 1400 UTC on 25 September 2015 [click to enlarge]](https://cimss.ssec.wisc.edu/satellite-blog/wp-content/uploads/sites/5/2015/09/GOES_R_LIFRPROB_1400UTC_25Sept2015.png)
![GOES-13 Visible (0.63 µm) images [click to play rocking animation]](https://cimss.ssec.wisc.edu/satellite-blog/wp-content/uploads/sites/5/2015/09/VIS_22SEP2015_1245_1700rock.gif)
![NOAA/CIMSS ProbSevere values, 1300-1412 UTC on 22 September 2015 [click to play animation]](https://cimss.ssec.wisc.edu/satellite-blog/wp-content/uploads/sites/5/2015/09/ProbSevere1300_1412_22Sep2015anim.gif)
![GOES-13 Sounder DPI Values of Lifted Index [click to play animation]](https://cimss.ssec.wisc.edu/satellite-blog/wp-content/uploads/sites/5/2015/09/GOESSounder_LI_08-1622Sep2015anim.gif)
![GOES-13 visible (0.63 µm) images [click to play animation]](https://cimss.ssec.wisc.edu/satellite-blog/wp-content/uploads/sites/5/2015/09/150920_goes13_visible_Montana_mountain_waves_anim.gif)
![GOES-13 infrared (10.7 um) images [click to play animation]](https://cimss.ssec.wisc.edu/satellite-blog/wp-content/uploads/sites/5/2015/09/150920_goes13_infrared_Montana_mountain_waves_anim.gif)
![GOES-13 water vapor (6.5 um) images [click to play animation]](https://cimss.ssec.wisc.edu/satellite-blog/wp-content/uploads/sites/5/2015/09/150920_goes13_water_vapor_Montana_mountain_waves_anim.gif)

![Suomi NPP VIIRS visible (0.64 um), infrared window (11.45 um), and shortwave infrared (3.74 um) images [click to enlarge]](https://cimss.ssec.wisc.edu/satellite-blog/wp-content/uploads/sites/5/2015/09/150920_2057utc_suomi_npp_viirs_Visible_IR_shortwaveIR_MT_mountain_wave_clouds_anim.gif)
