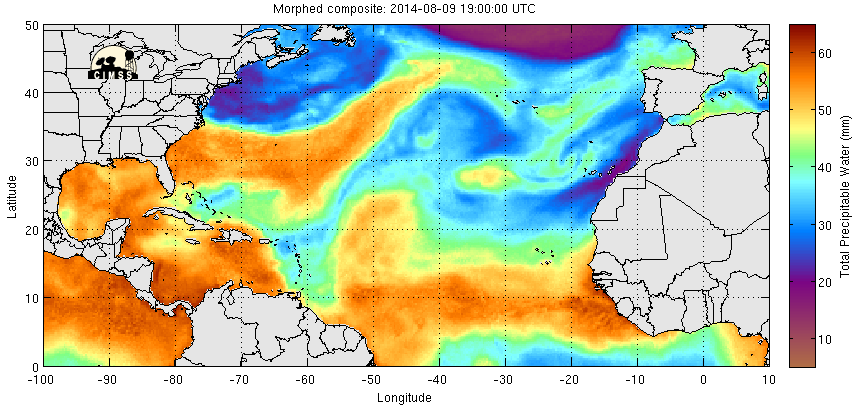

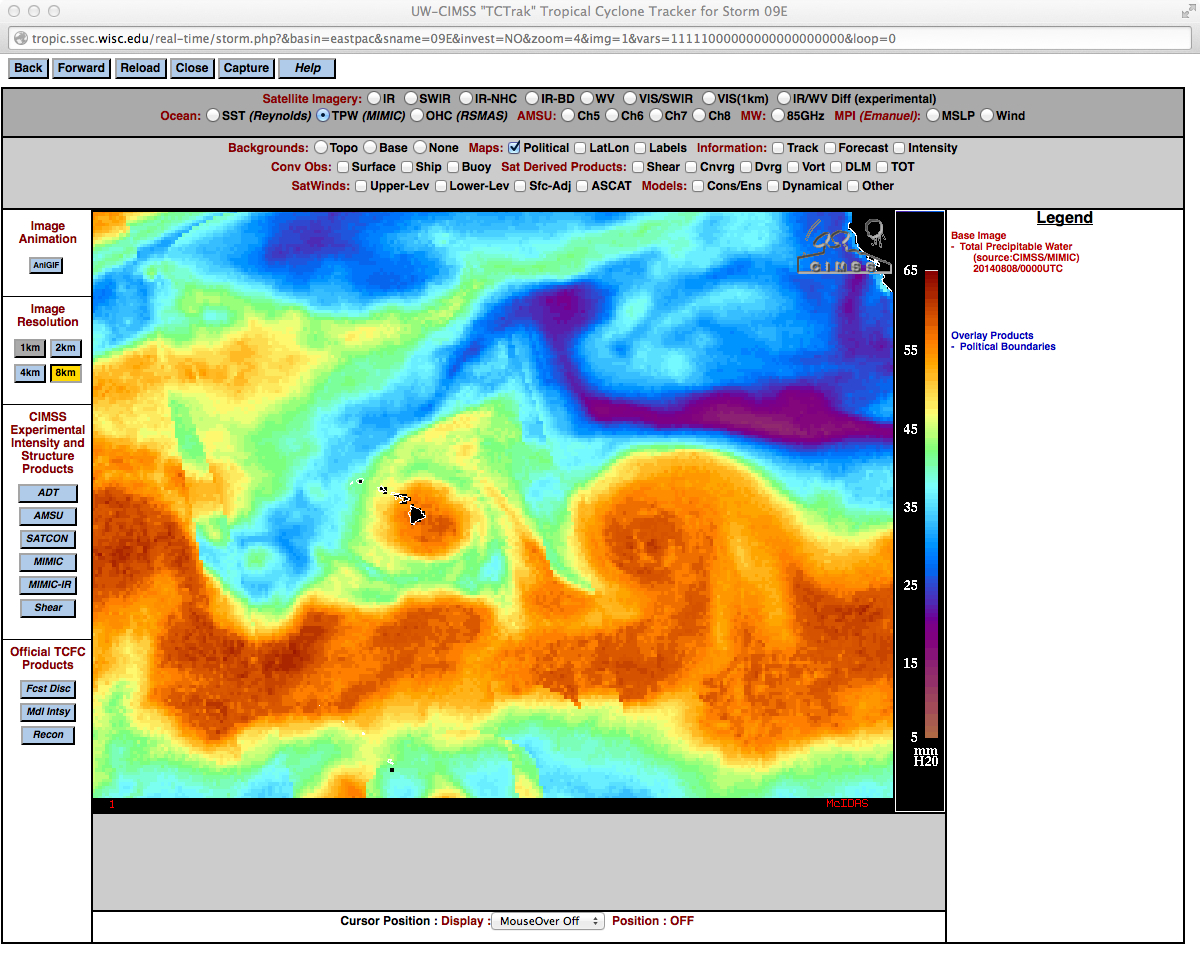
MIMIC Total Precipitable Water for the 72 hours ending at 1800 UTC 12 August 2014 (click to enlarge)
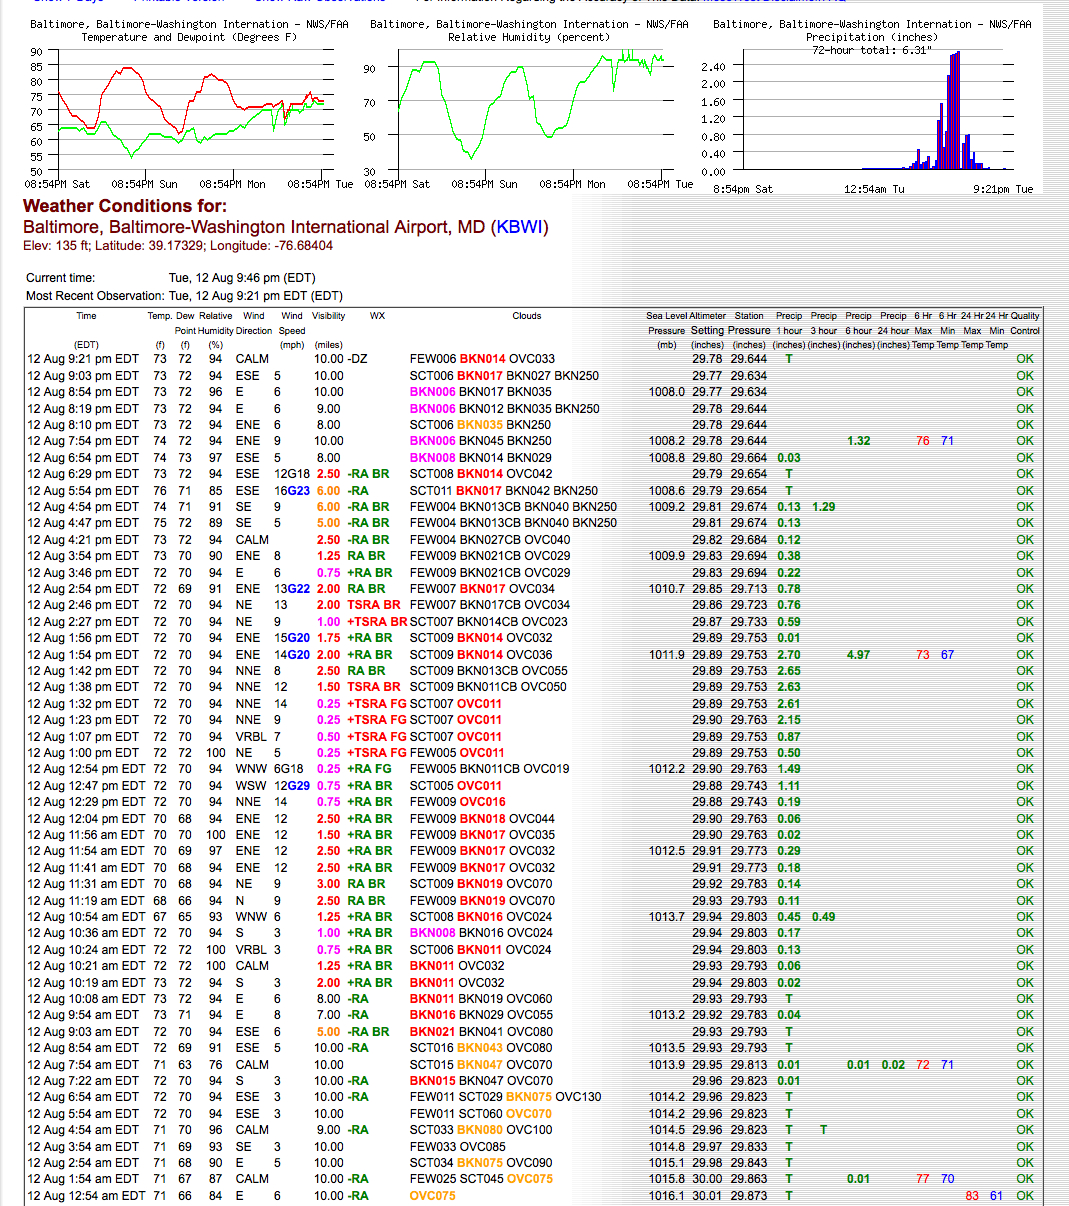
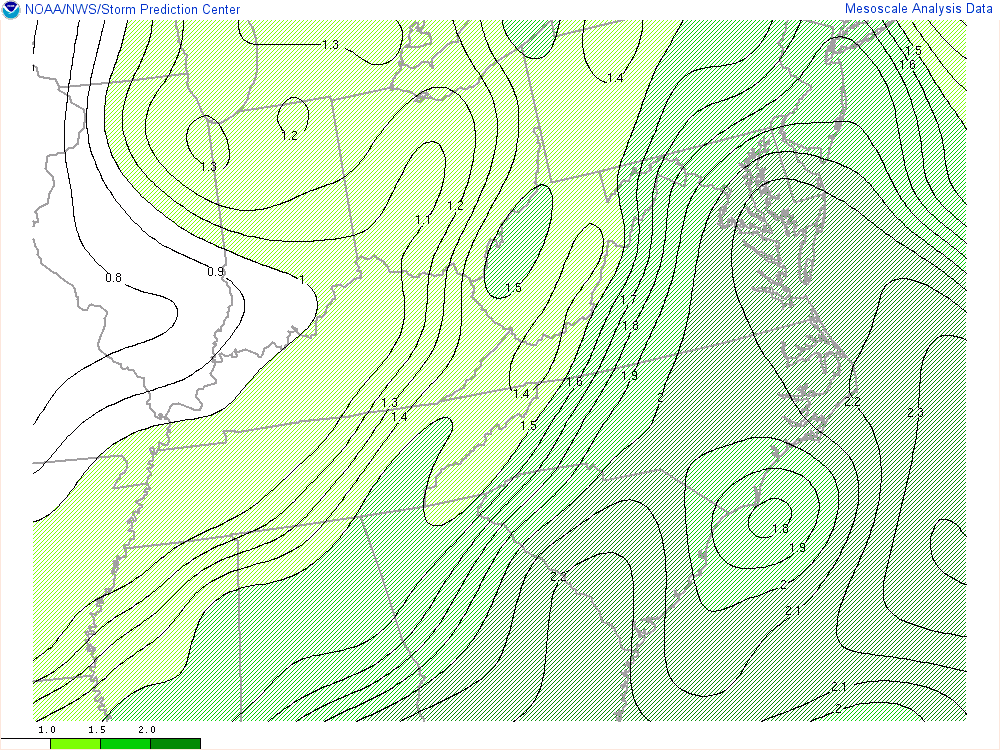
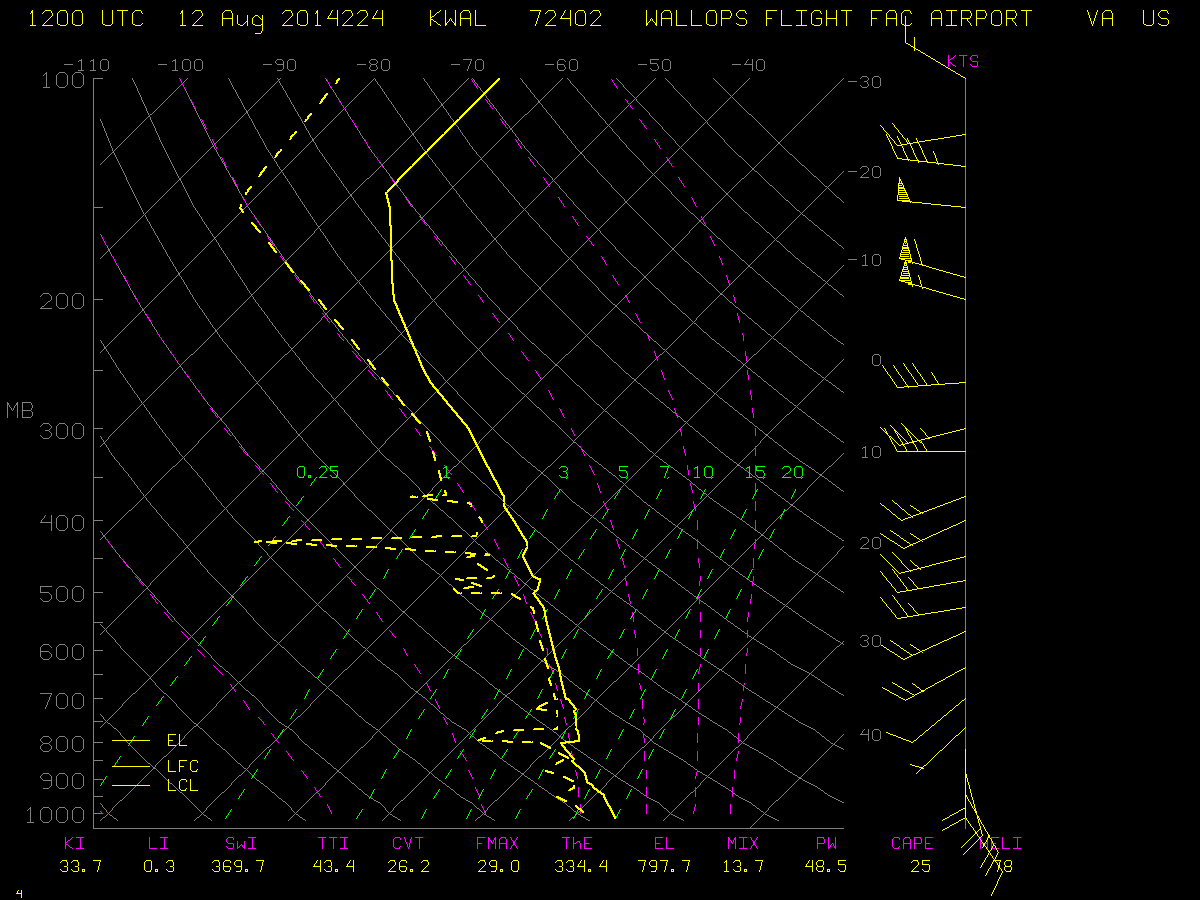
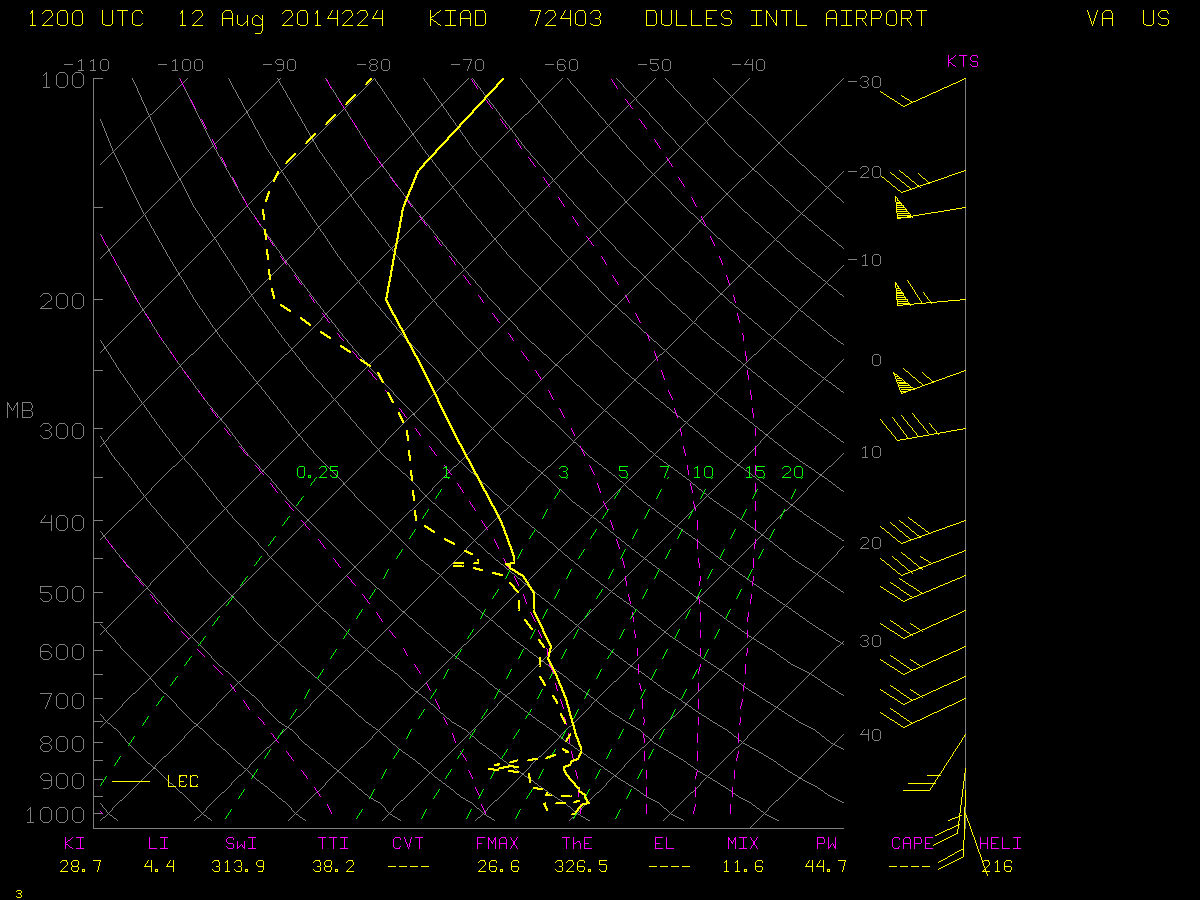
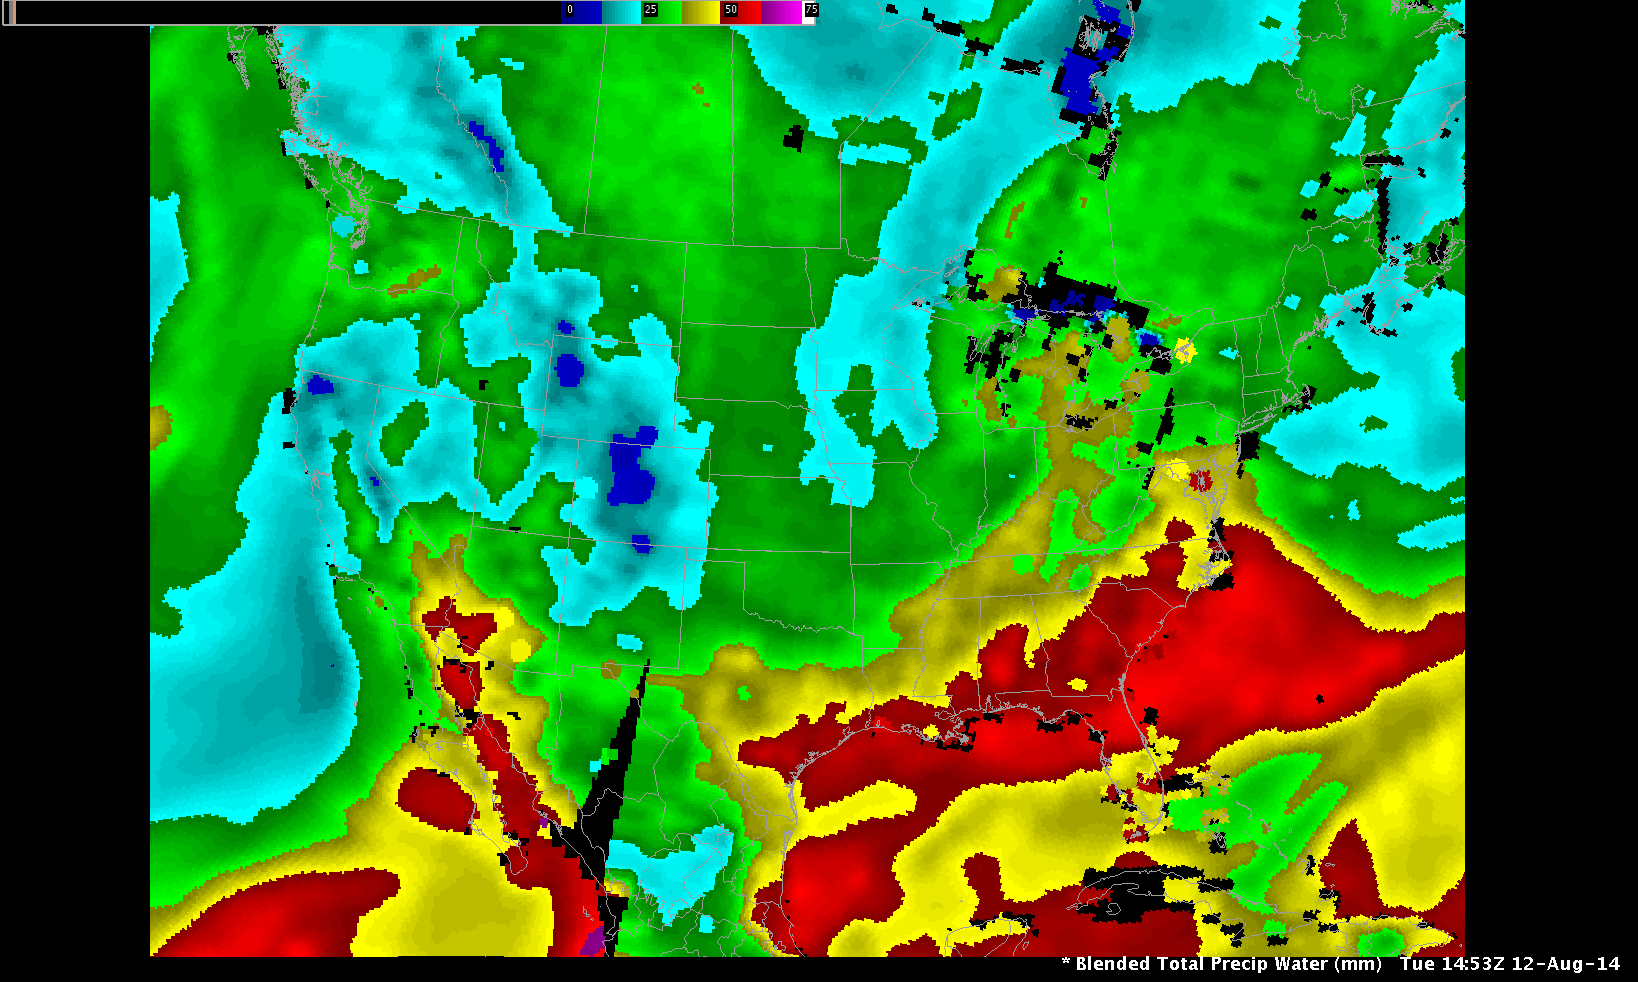
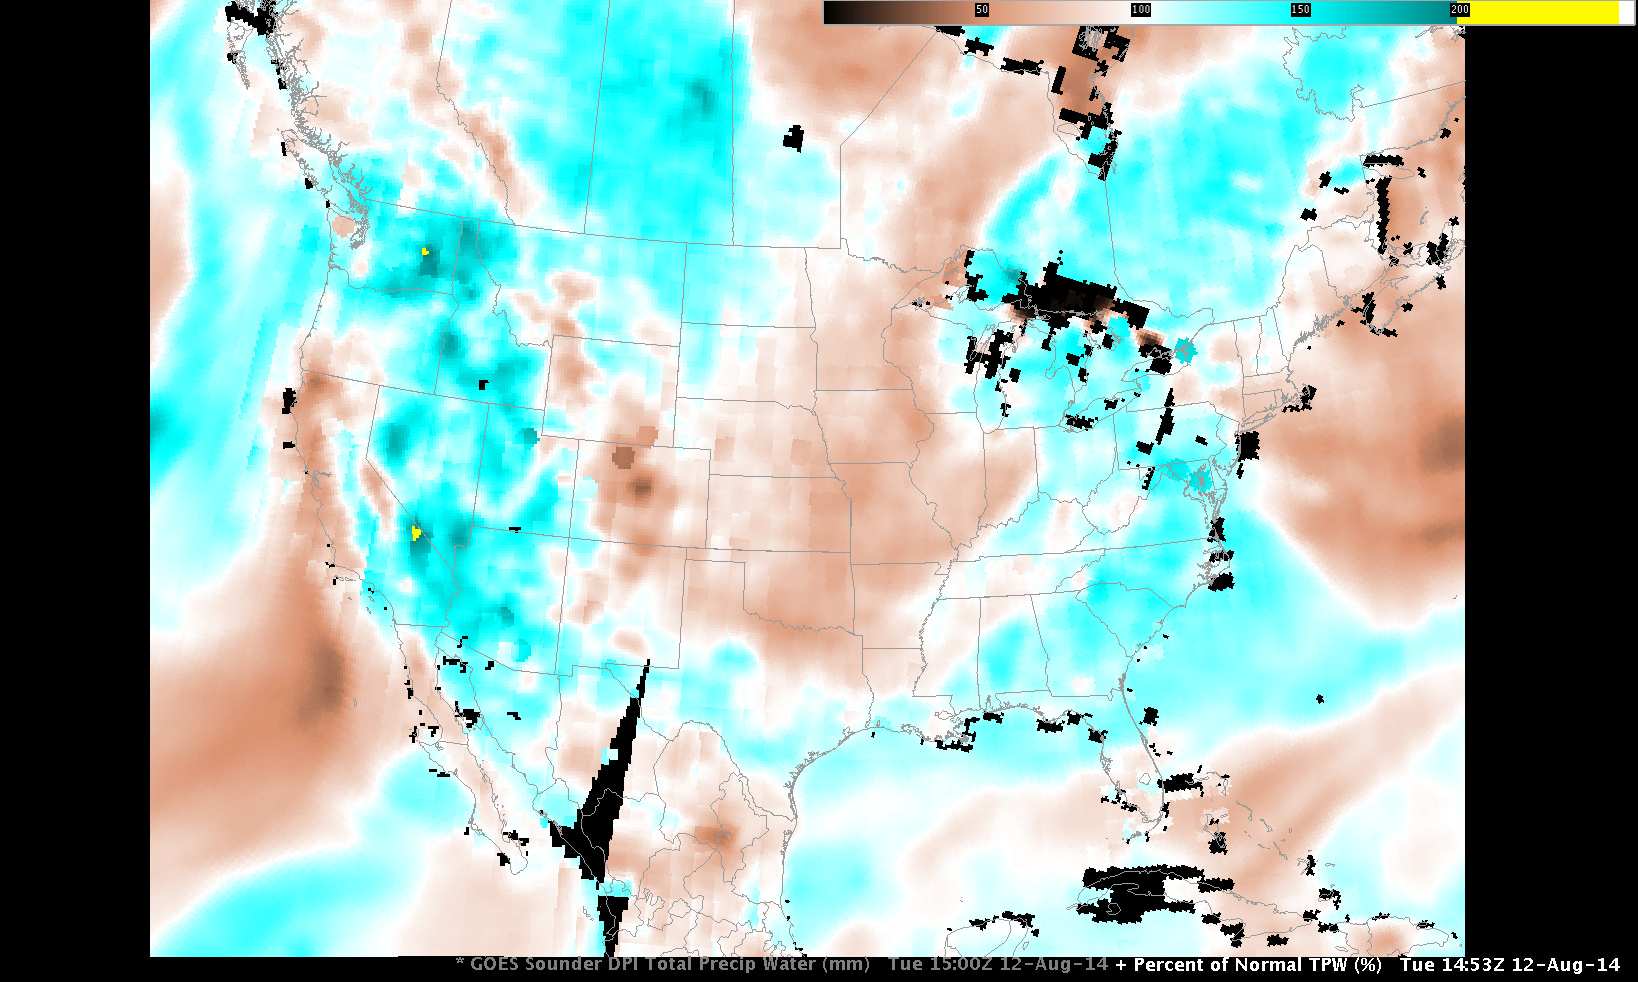
Very heavy rain has fallen during the day on August 12th in and around Baltimore (with rainfall rates as high as 2.70″ per hour at KBWI) and Washington DC, with reports of up to 10″. Where has this moisture come from? There are a variety of products available to diagnose total precipitable water in the atmosphere. The animation above, taken from the MIMIC Total Precipitable Water page (link), shows an influx of tropical moisture from the south-southeast has surged northward up to the east coast of Maryland on August 12. A mesoanalysis from SPC also suggests a link to the moisture east and south of Cape Hatteras. The GOES Sounder Total Precipitable Water derived product image at 1800 UTC, below, (from this website) showed very high total precipitable water amounts just south of Baltimore and Washington DC with values exceeding 60 mm or 2.4″. Soundings at 1200 UTC also showed high values of precipitable water: 48.5 mm or 1.90″ at Wallops Island, VA, and 44.7 mm or 1.76″ at Washington Dulles. Finally, the Blended Total Precipitable Water Product from NESDIS showed values around 51 mm or 2″ as well. (Values did not quite reach the 200% of normal threshold, however).
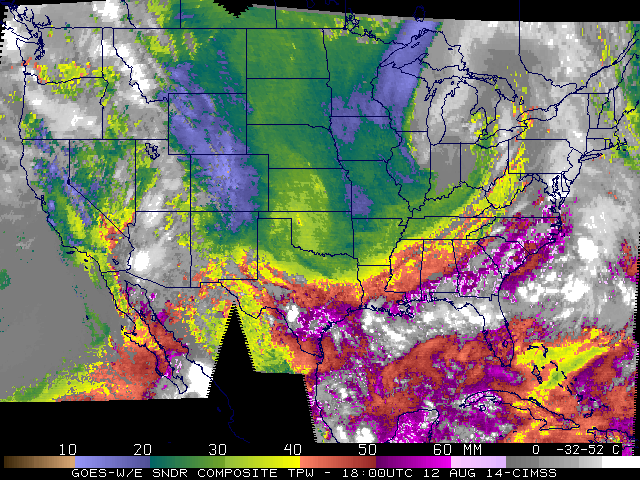
GOES Sounder Total Precipitable Water derived product image at 18 UTC
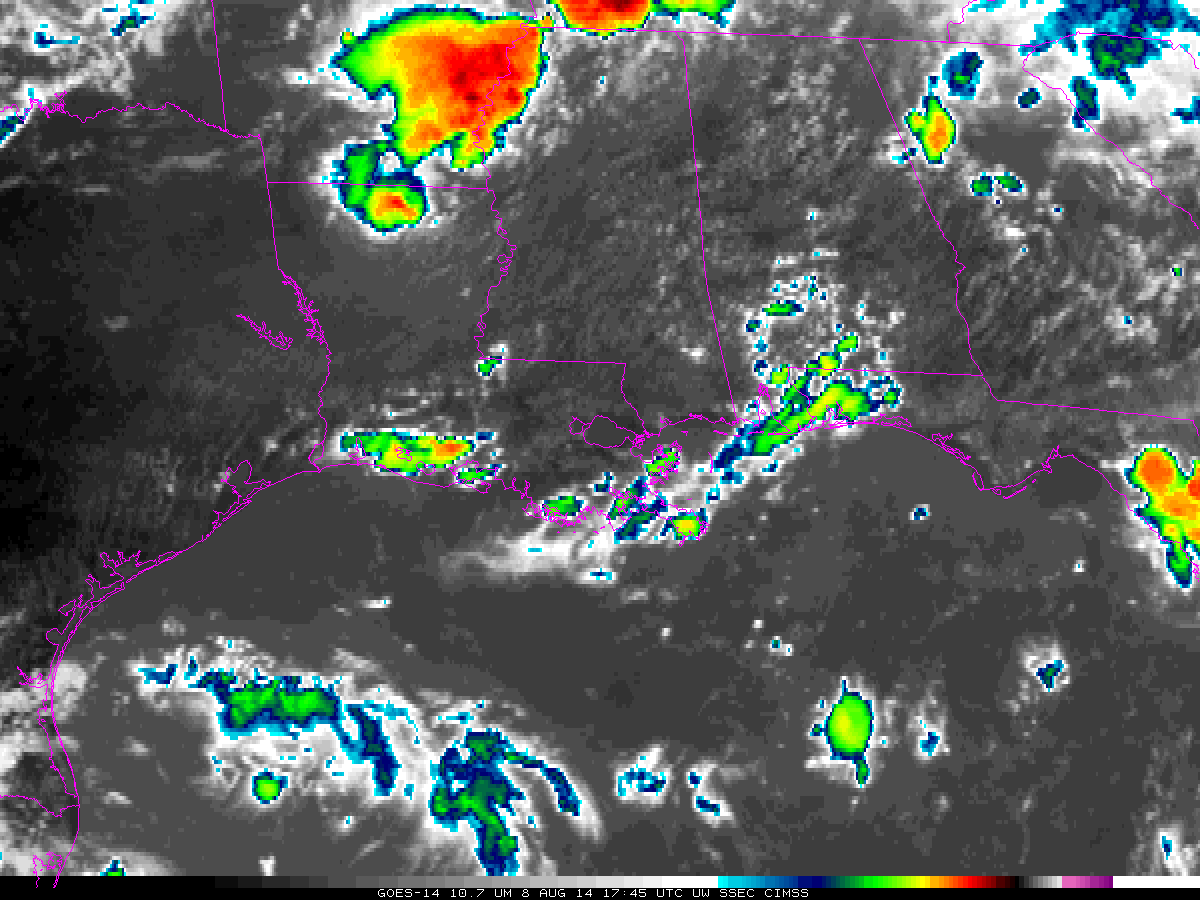
The animation of GOES-13 Infrared (10.7 µm) imagery, below, suggests some training was occurring in the thunderstorm development: thunderstorms continually redeveloped and moved over the same region. Training thunderstorms in moisture-rich air is a recipe for flooding.
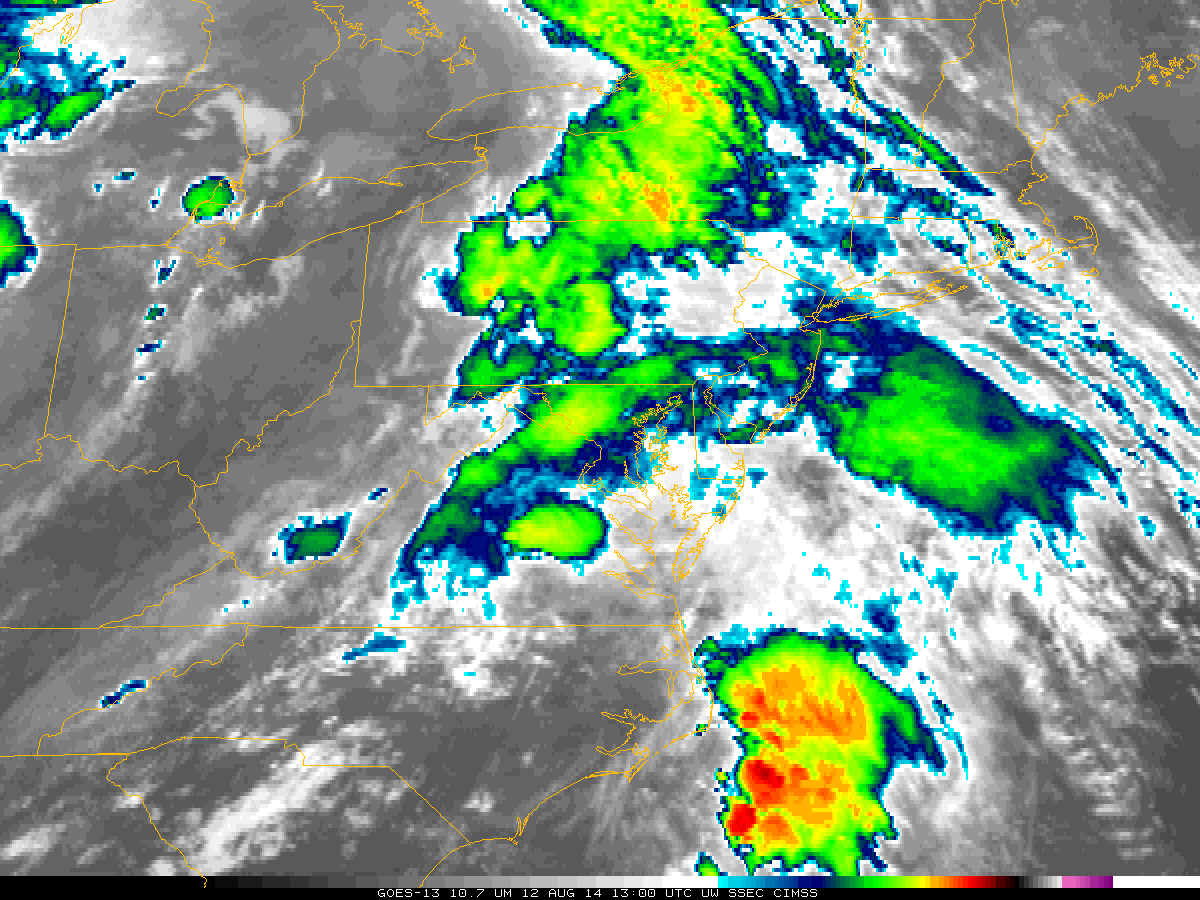
GOES-13 10.7 µm infrared imagery on 12 August 2014 (click to animate)
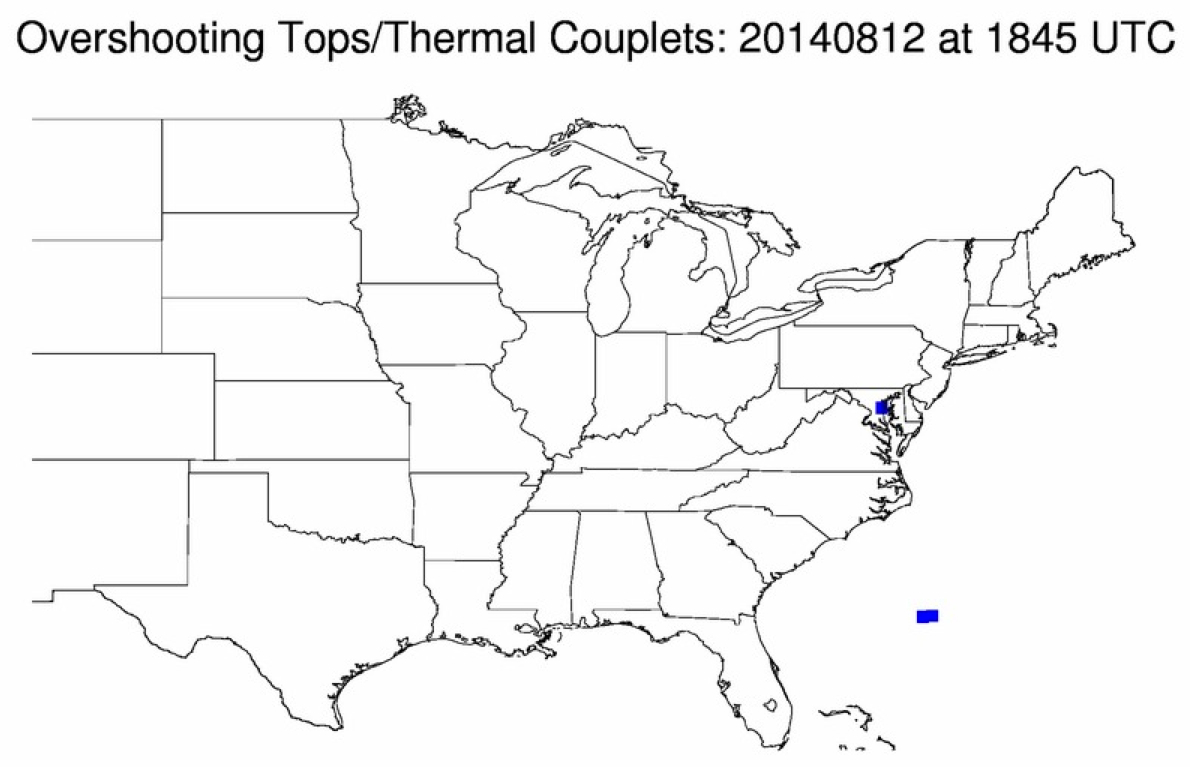
Comparisons of Suomi NPP VIIRS 0.64 µm visible channel and 11.45 µm IR channel images at 17:16 UTC and 18:54 UTC (below) showed that the convection exhibited cold cloud-top IR brightness temperatures (as cold as -77º C), and subtle shadowing on the visible imagery suggestive of overshooting tops. Using GOES-13 IR imagery, the CIMSS/NASA Langley Automated Overshooting Tops / Thermal Couplets product displayed one distinct overshooting top (blue square symbol) over the Baltimore area at 18:45 UTC.
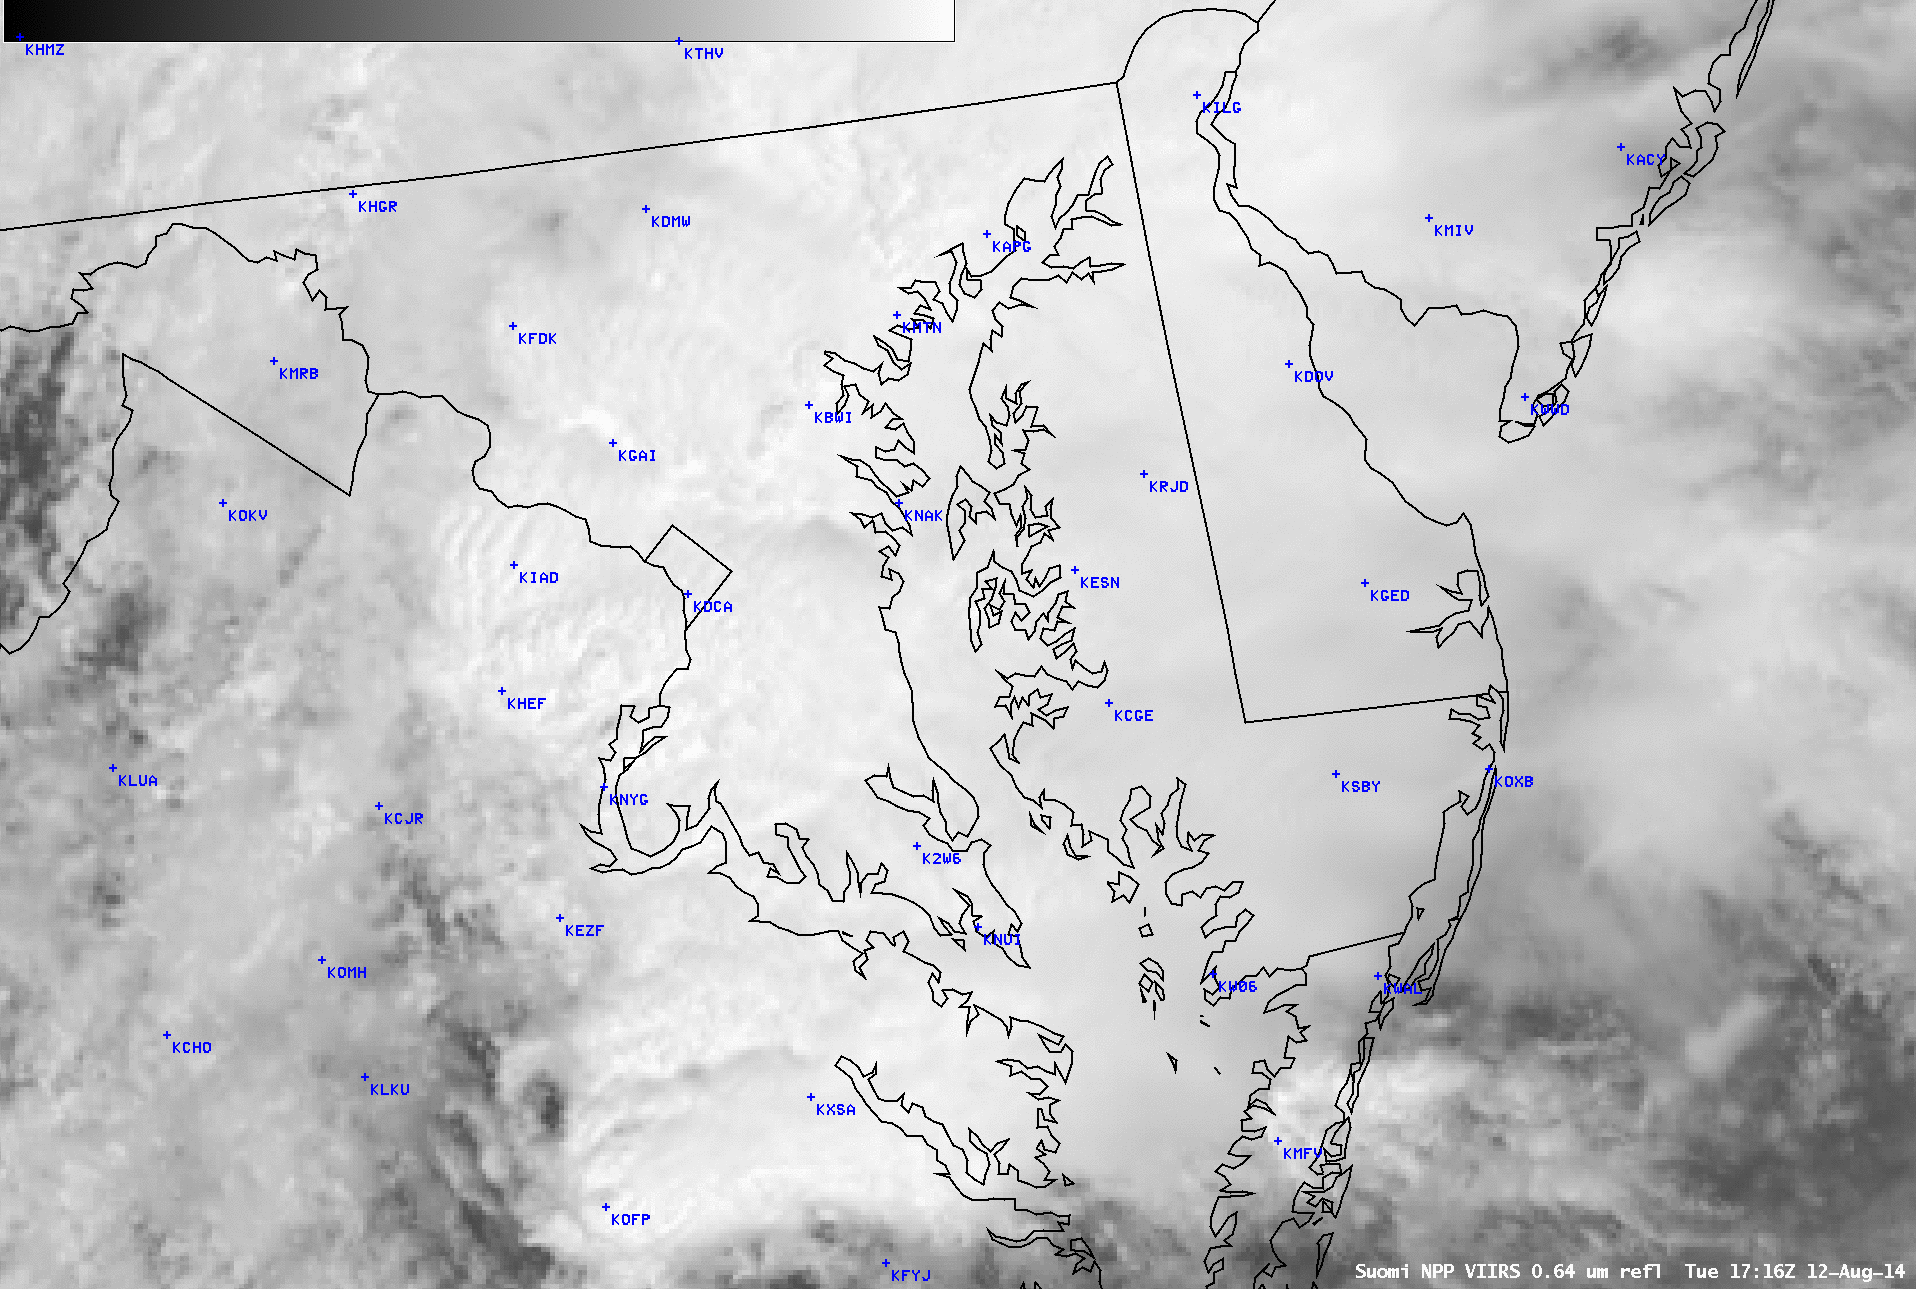
Suomi NPP VIIRS 0.64 µm visible channel and 11.45 µm IR channel images at 17:16 UTC
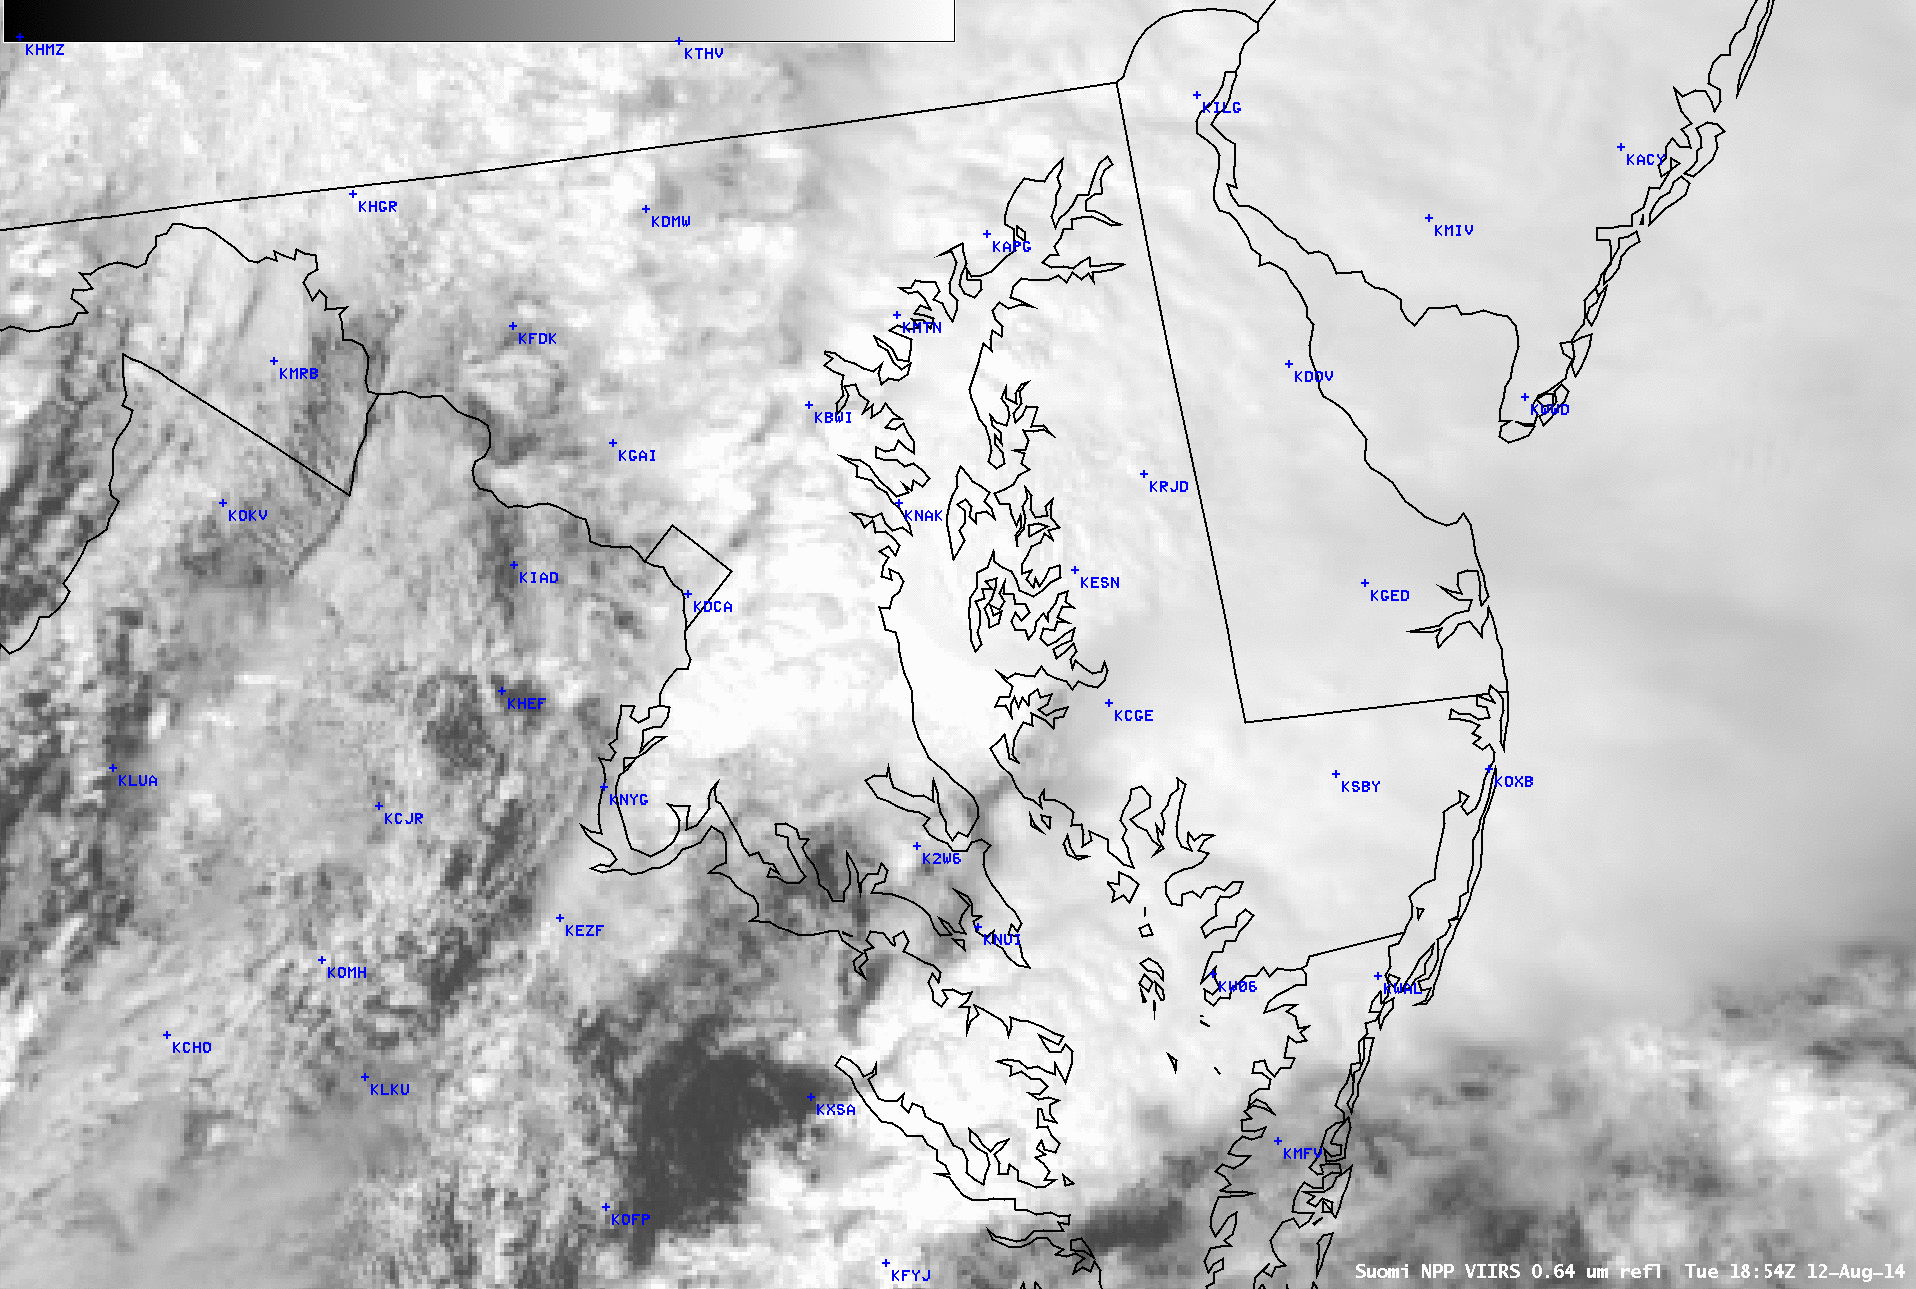
Suomi NPP VIIRS 0.64 µm visible channel and 11.45 µm IR channel images at 18:54 UTC
View only this post Read Less
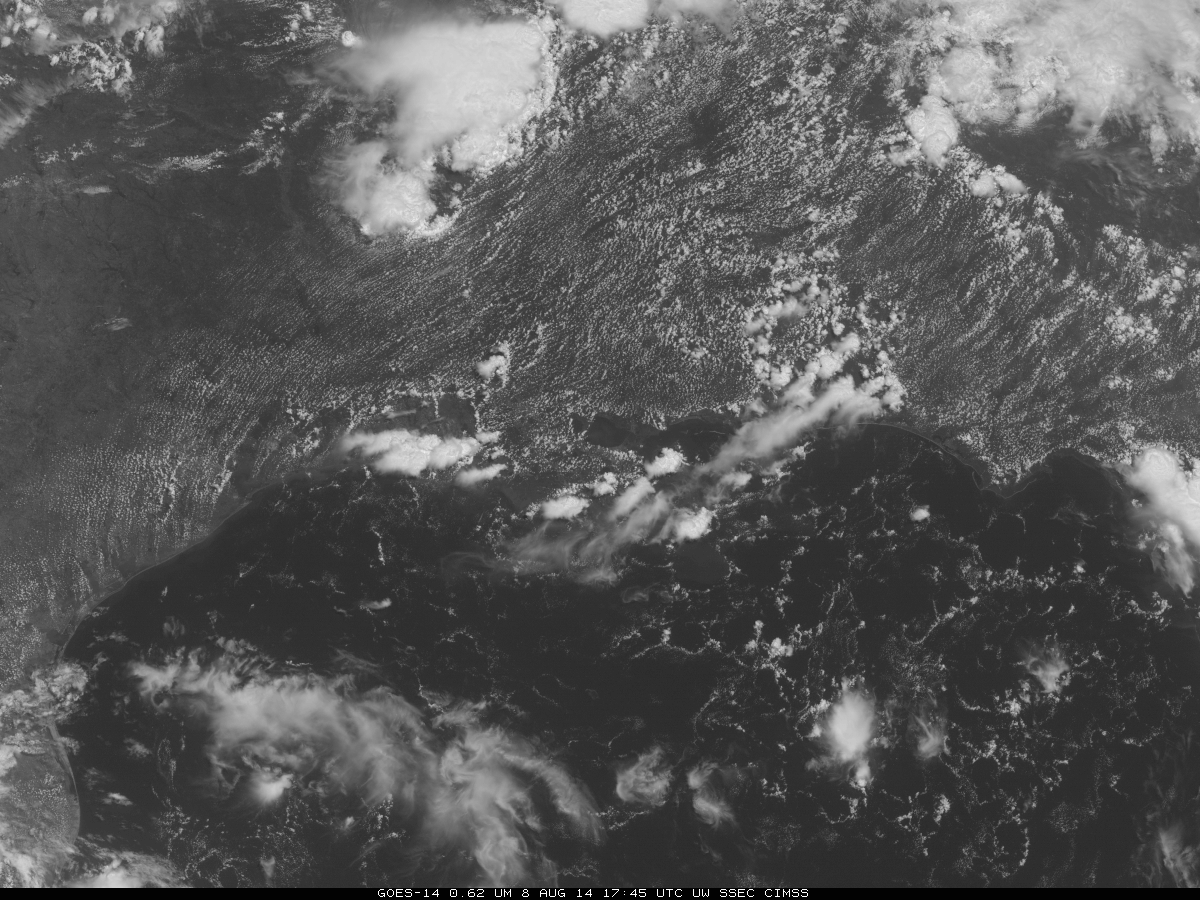
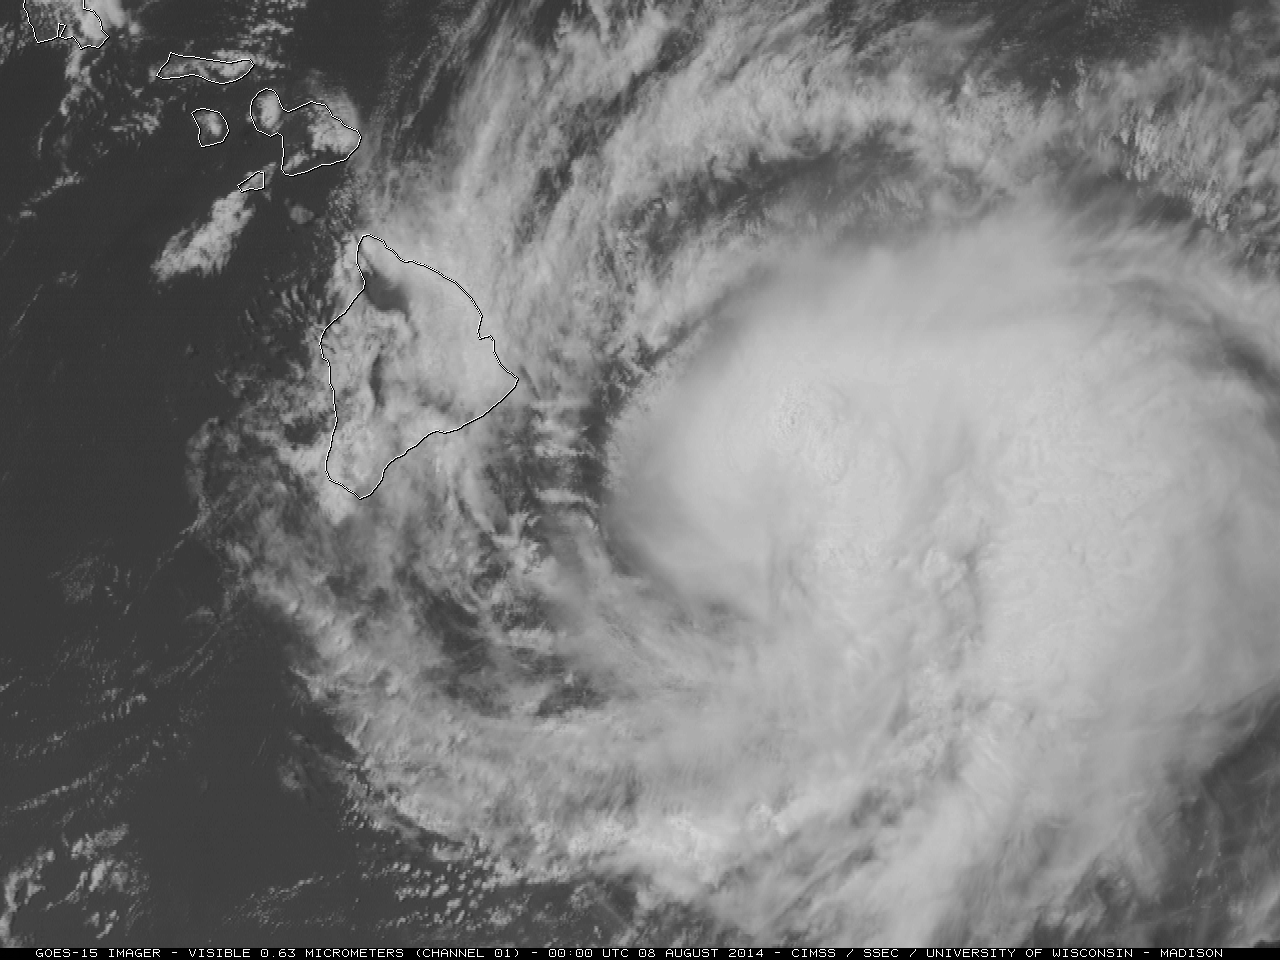
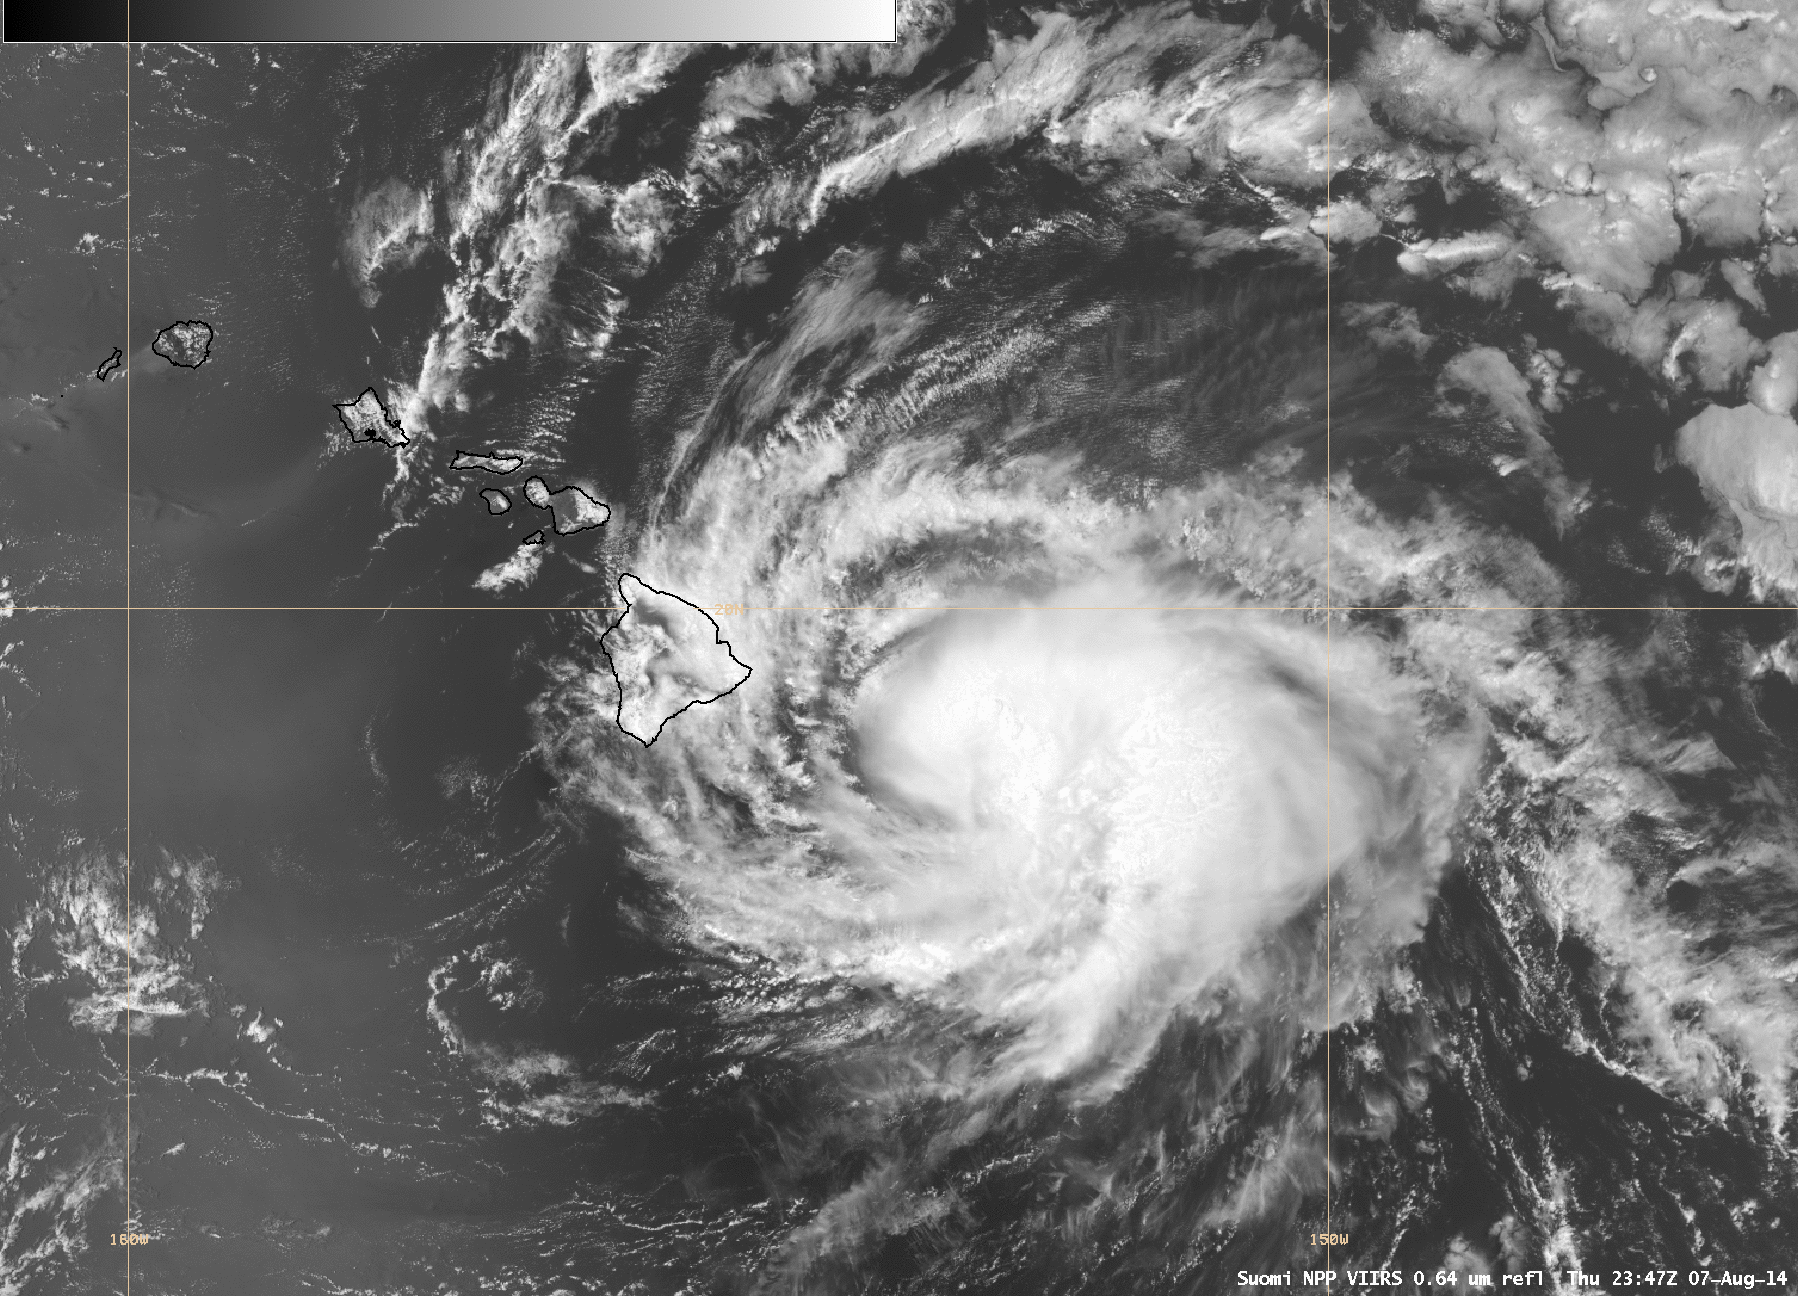
![GOES-15 0.63 µm visible channel and 10.7 µm IR channel images [click to play animation]](https://cimss.ssec.wisc.edu/satellite-blog/wp-content/uploads/sites/5/2014/08/140807-08_goes15_visible_ir_Iselle_anim.gif)
