Hurricanes Iselle and Julio in the central and eastern Pacific Ocean, respectively, are forecast to affect the Hawaiian Islands in the coming days. The True-Color image of Iselle, above, derived from data from Suomi NPP downloaded at NOAA’s X/L Antenna in Hawaii from 2245 UTC on 5 August shows asymmetries... Read More

Suomi NPP True Color Imagery of Iselle 2245 UTC 5 August (click to enlarge)
Hurricanes Iselle and Julio in the central and eastern Pacific Ocean, respectively, are forecast to affect the Hawaiian Islands in the coming days. The True-Color image of Iselle, above, derived from data from Suomi NPP downloaded at NOAA’s X/L Antenna in Hawaii from 2245 UTC on 5 August shows asymmetries in the storm that testify to the presence of dry air ahead of the storm that is wrapping into the circulation from the southwest. (Compare the storm’s presentation at 2245 UTC 5 August, above, to the more circular one 24 hours earlier, at 2300 UTC on 4 August (from this post), when dry air was not impinging on Iselle’s side). The toggle below, between the 11.35 µm imagery, at 1113 UTC and the Day Night Band at the same time shows the ragged appearance of the storm. Coldest cloud tops were -63 C.
Suomi NPP 11.35 µm Infrared and Day Night Band Visible Imagery at 1113 UTC 6 August (click to animate)
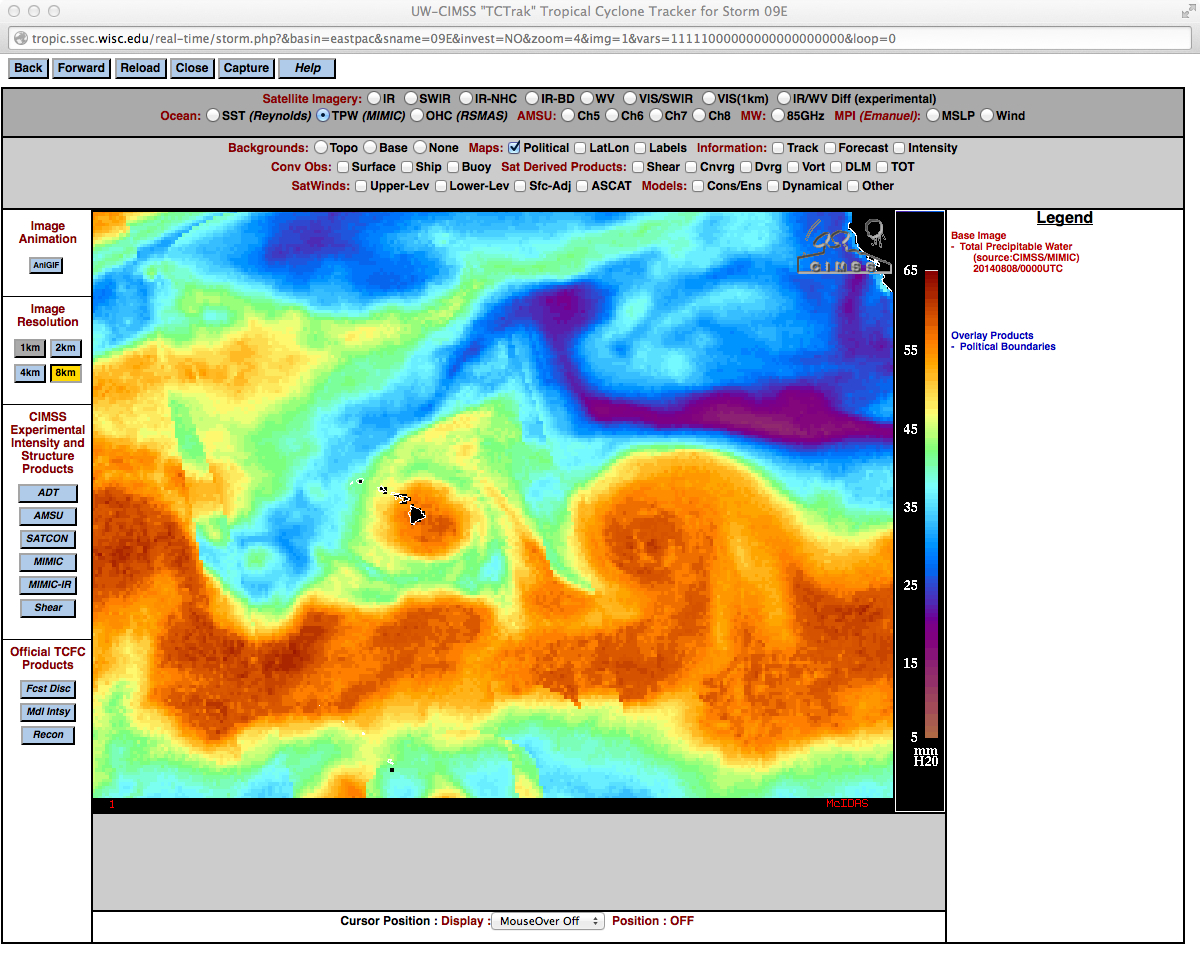
GOES-15 water vapor imagery, below, shows the region of dry air in between Iselle and the Hawaiian Islands. Such warm values (the yellow in the enhancement) in the water vapor channel mean the top of the moist layer is low in the troposphere. Of course, water vapor imagery does not quantify the amount of moisture in the atmosphere, it only identifies where the top of the moist layer is. Total Precipitable Water (TPW) can be estimated, with accuracy, using microwave imagery, and the MIMIC TPW for the 72 hours ending at 1100 UTC on 6 August (from this site), below, shows very dry air in advance of the Iselle. Further Information and advisories on Iselle can be found at the website of the Central Pacific Hurricane Center in Honolulu (Link).
GOES-15 6.5 µm Water Vapor Imagery, 1200 UTC 6 August 2014 (click to enlarge)
Morphed Integrated Microwave Imagery at CIMSS – Total Precipitable Water (MIMIC-TPW) for 72 hours ending 1100 UTC 6 August 2014 (click to enlarge)
Hurricane Julio is also obvious in the TPW animation above, following close on the heels of Iselle. Julio will not have as much dry air to deal with, compared to Iselle, as it moves west-northwestward. However, Julio will move farther north than Iselle, and the cooler water under Julio’s projected track (and somewhat stronger shear) should limit its strength as it moves north of the Hawaiian Islands. (Click here the forecast track for Julio valid 6 August 2014; Click here for the forecast track for Iselle).
GOES-15 0.62 µm Visible Imagery, 00 UTC 6 August 2014, of Julio (click to enlarge)
Visible imagery from GOES-15, above, at 00 UTC on 6 August, shows that Julio (at that time still a tropical storm) is circular in appearance and lacking an identifiable eye. A burst of convection is apparent over the center, however. The infrared imagery from 00 UTC and 12 UTC, below, shows little change in Julio. It nevertheless strengthened to become the fifth hurricane of the eastern Pacific season.
GOES-15 10.7 µm infrared Imagery, 00 and 12 UTC 6 August 2014, of Julio (click to animate)
The toggle above of the 10.7 µm imagery shows an obvious overshooting top at 1200 UTC. Overshooting tops have been correlated with storm intensification. The plot below shows where overshooting tops were identified at 1330 UTC on 6 August (taken from this site). Plots showing the number of overshooting tops as a function of time are available for Iselle and Julio.
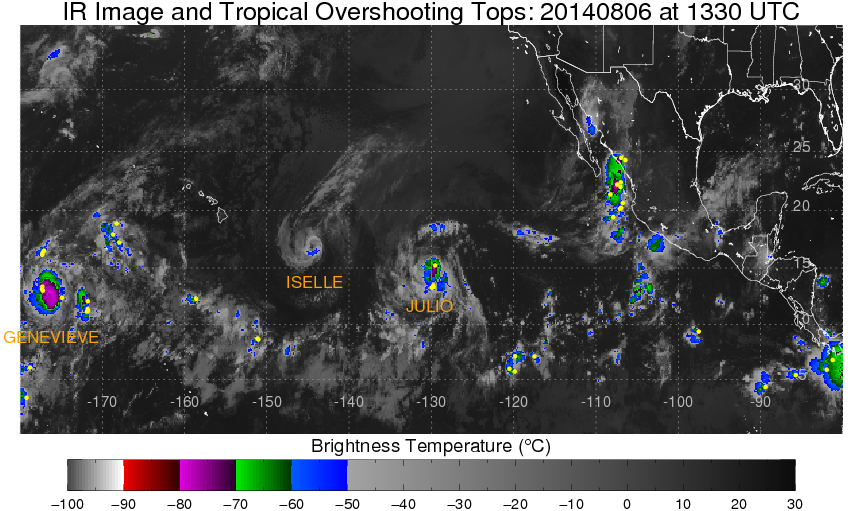
Infrared 10.7 µm Imagery and auto-detected Overshooting Tops, 1330 UTC 6 August 2014 (click to enlarge)
View only this post
Read Less
![GOES-15 0.63 µm visible channel and 10.7 µm IR channel images [click to play animation]](https://cimss.ssec.wisc.edu/satellite-blog/wp-content/uploads/sites/5/2014/08/140807-08_goes15_visible_ir_Iselle_anim.gif)


