GOES-16 data posted on this page are preliminary, non-operational data and are undergoing testing.GOES-16 includes both a clean infrared window (10.33 µm) and a so-called ‘dirty’ infrared window channel (12.30 µm). The clean infrared window is in a part of the electromagnetic spectrum where there is very little absorption of... Read More
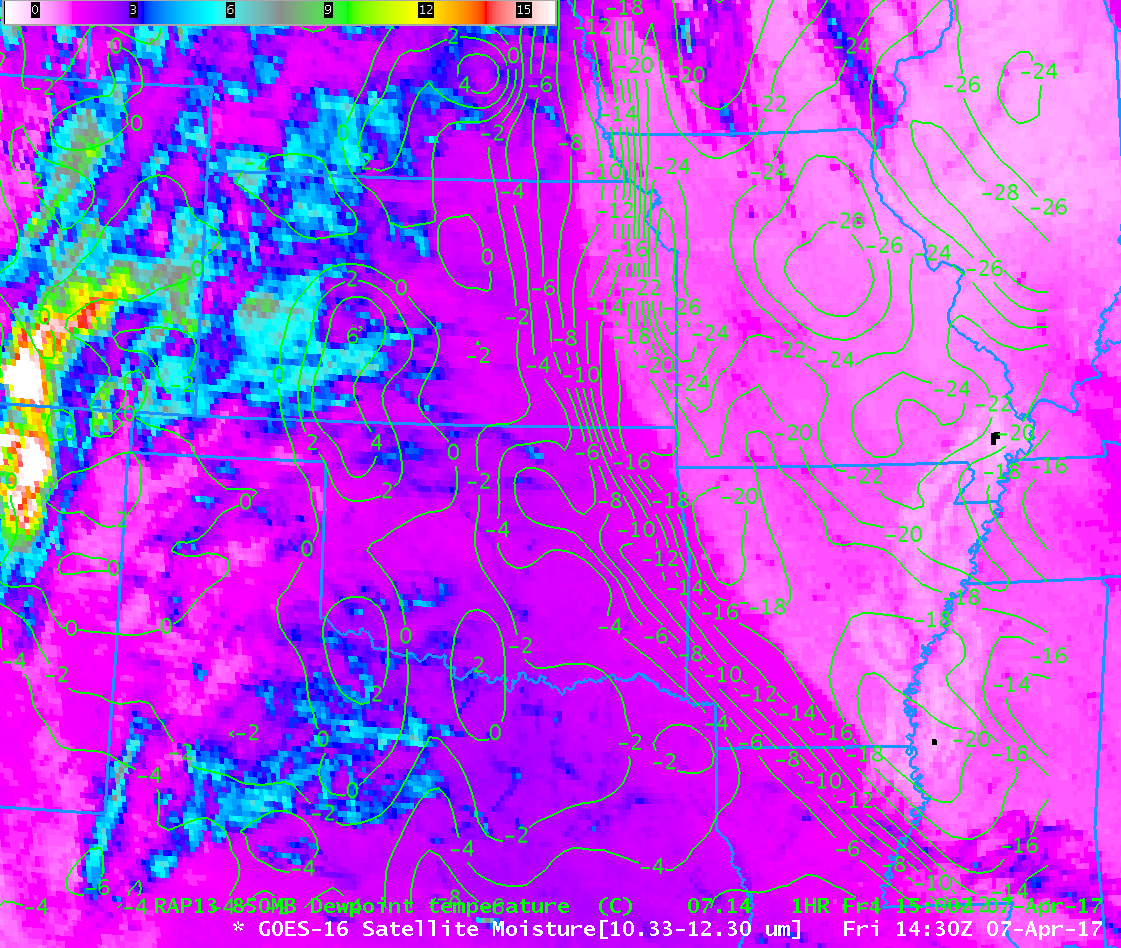
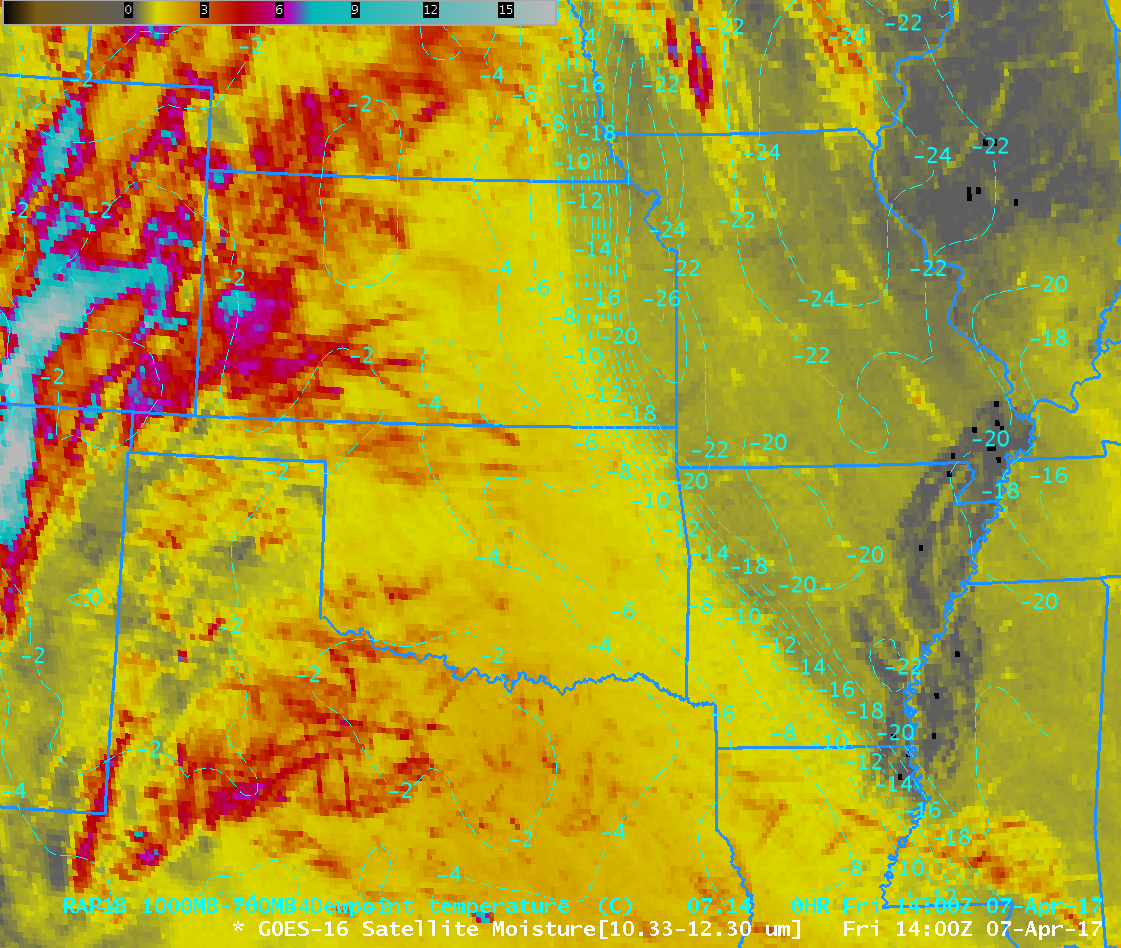
GOES-16 Split Window Difference (10.33 µm – 12.30 µm) with 850-mb Dewpoint Temperatures from the Rapid Refresh overlain (Click to enlarge)
GOES-16 data posted on this page are preliminary, non-operational data and are undergoing testing.
GOES-16 includes both a clean infrared window (10.33 µm) and a so-called ‘dirty’ infrared window channel (12.30 µm). The clean infrared window is in a part of the electromagnetic spectrum where there is very little absorption of energy by water vapor; in the dirty infrared window, modest amounts of water vapor absorption occur. The brightness temperature difference, nicknamed the Split Window Difference (SWD for short), can highlight differences in moisture in clear skies.
The toggle above shows the SWD (10.33 µm – 12.30 µm) at 1430 UTC on 7 April 2017. A pronounced gradient stretches southeast to northwest from Louisiana to northeast Kansas and extreme southeastern Nebraska. Values over Missouri, for example, are around 0.9-1.0 K vs. 1.7-2.2 K over Oklahoma. The gradient in the brightness temperature difference aligns very neatly with the 850-mb dewpoint temperature from the Rapid Refresh. You can use this product to monitor moisture return from the Gulf of Mexico.
AWIPS Note: The Default enhancement in AWIPS for the Split Window Difference, shown above, does not include large enough negative values. The Split Window Difference value can exceed -5 K in regions of dust. See this link for a different enhancement for this case with a wider range of temperature differences. A similar image uses the mean 1000-700 mb dewpoint temperature rather than values from the single 850-mb level.
=============== Added ===============
An animation of this imagery (not shown) shows general increases in the SWD values with time. A consistent signal of moisture will be present only if the temperature decreases with height in the moist layer (that is — if there is no inversion). An increase in the SWD does not necessarily show an increase in moisture — it can, rather, signify an increase in near-surface temperature (for more information, consult this article by Lindsey et al.). The gradient in the field can remain, however, as in this example.
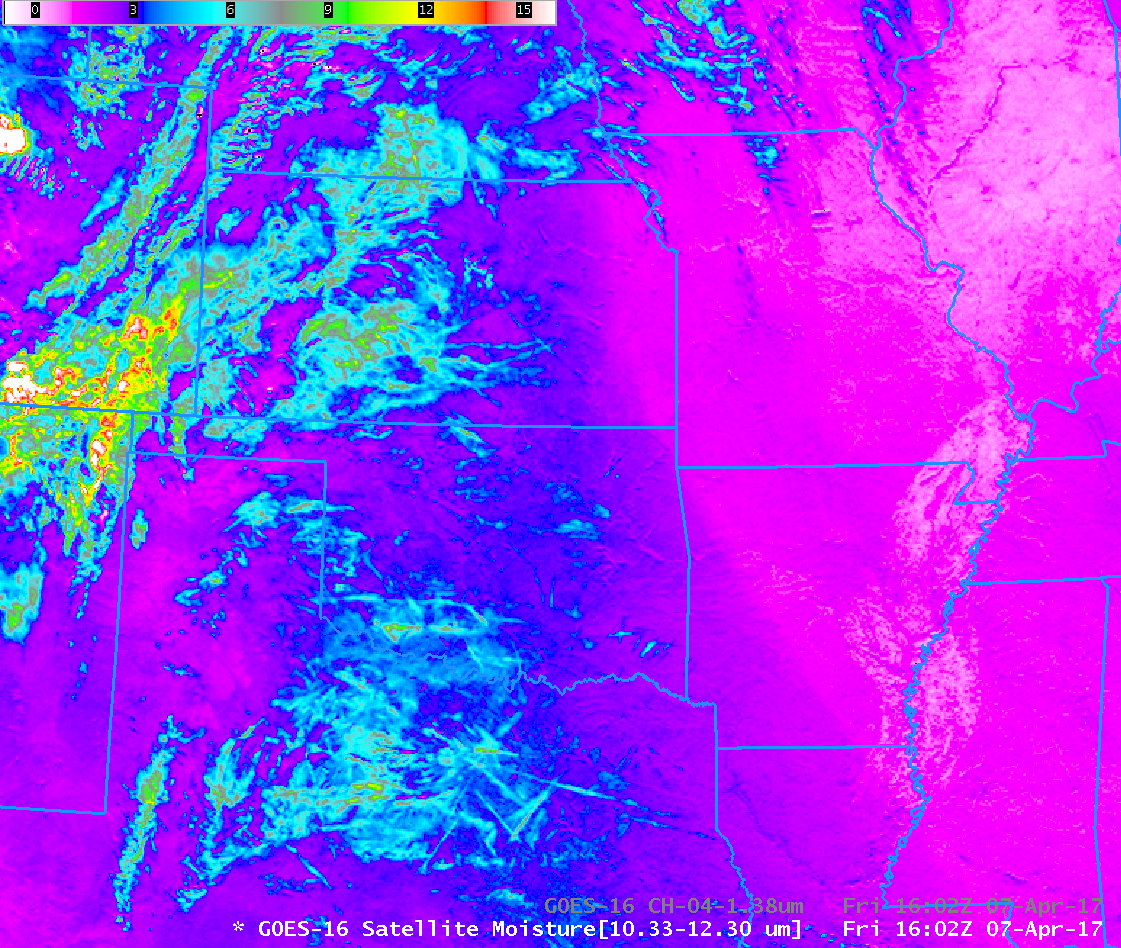
The Split Window Difference field does an exemplary job of detecting contrails over the southern Plains. The toggle below shows that the SWD signal of cirrus is more distinct than in the 1.378 µm Cirrus Channel! (Thanks to Matt Bunkers of WFO Rapid City for noting this!)
Cirrus Channel (1.378 µm ) and Split Window Difference (10.33 µm – 12.30 µm) at 1607 UTC on 7 April 2017 (Click to enlarge)
(Note that the SWD was something that was available from GOES-8 through GOES-11. Link)
View only this post
Read Less
![GOES-16 Visible (0.64 µm) images, with hourly surface and ship reports plotted in yellow [click to play animation]](https://cimss.ssec.wisc.edu/satellite-blog/wp-content/uploads/sites/5/2017/04/170408_goes16_visible_Lake_Michigan_eddy_anim.gif)
![Terra and Aqua MODIS true-color RGB images from 07 and 08 April [click to enlarge]](https://cimss.ssec.wisc.edu/satellite-blog/wp-content/uploads/sites/5/2017/04/170407-08_viirs_truecolor_Lake_Michigan_eddy_anim.gif)
![EUMETSAT Meteosat-10 Shortwave Infrared (3.9 µm) images, with hourly surface reports; Shayrat Air Base is located at the center of the cyan circle [click to play animation]](https://cimss.ssec.wisc.edu/satellite-blog/wp-content/uploads/sites/5/2017/04/170407_meteosat10_shortwave_infrared_Syria_anim.gif)
![EUMETSAT Meteosat-10 Shortwave Infrared (3.9 µm) images at 0015 and 0030 UTC [click to enlarge]](https://cimss.ssec.wisc.edu/satellite-blog/wp-content/uploads/sites/5/2017/04/170407_0015_003utc_meteosat10_shortwave_infrared_Syria_anim.gif)
![Flood Warnings (green) in effect at 7:43 pm CDT on 06 April 2017 [click to enlarge]](https://cimss.ssec.wisc.edu/satellite-blog/wp-content/uploads/sites/5/2017/04/170406_flood_warnings.jpeg)
![GOES-16 Visible (0.47 µm and 0.64 µm) and Near-Infrared (0.86 µµ and 1.61 µm) images [click to enlarge]](https://cimss.ssec.wisc.edu/satellite-blog/wp-content/uploads/sites/5/2017/04/170406_1507utc_goes16_bands_1_2_3_5_KS_flooding_anim.gif)
