GOES-16 “Red” Band (0.64 µm) from 1222 through 1517 UTC on 6 April 2017 (Click to animate)
GOES-16 data posted on this page are preliminary, non-operational data and are undergoing testing.
GOES-16 Visible Imagery early on 6 April 2017 showed a strong thunderstorm developing north of Lake Okeechobee and proceeding east towards the Atlantic Coast near Vero Beach (1-minute or 30-second imagery was not available over Florida because the GOES-16 Mesoscale Sectors were in their default locations; routine 5-minute CONUS imagery is shown above).
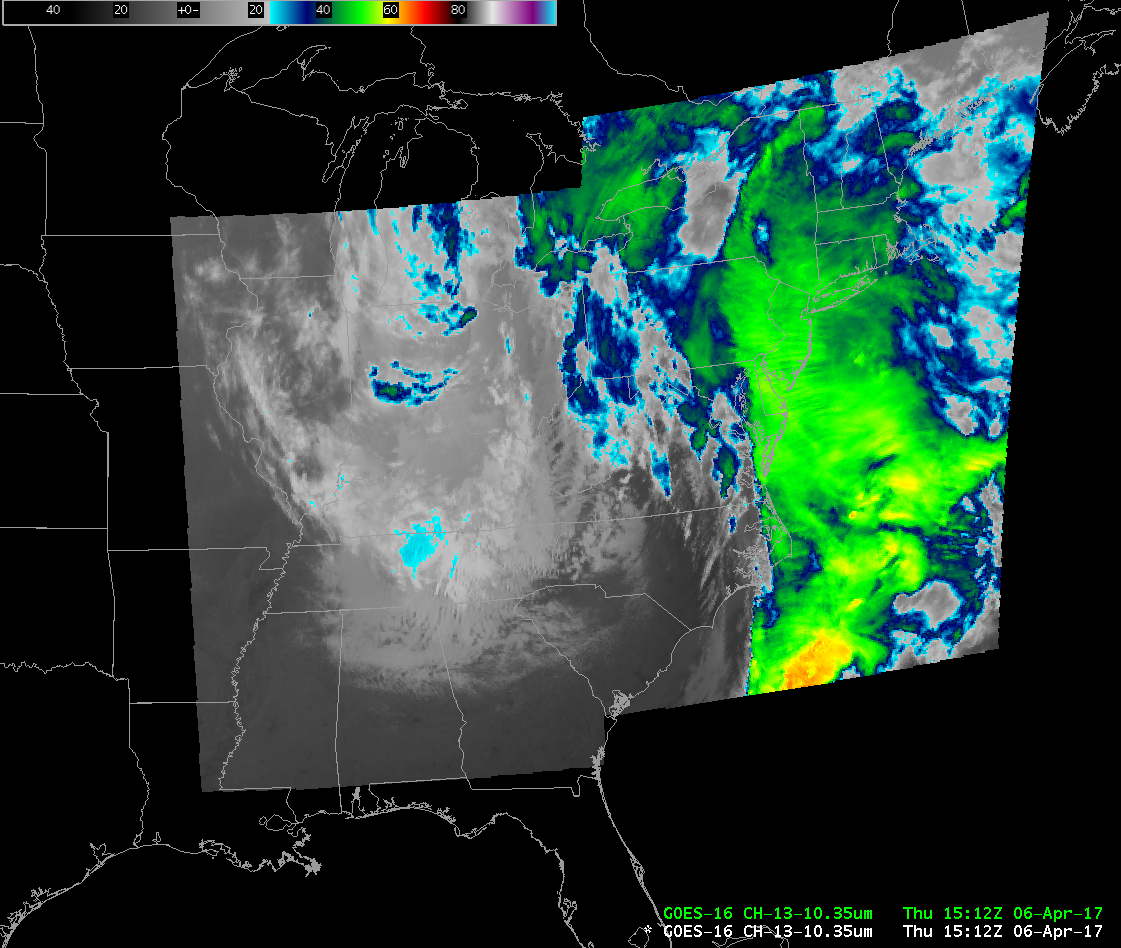
Clean Infrared Window channel (10.33 µm) imagery from 1400-1500 UTC, taken from AWIPS, below, shows a well-developed albeit weakening storm that is moving off the coast. A pronounced Overshooting Top/Thermal Couplet is present at 1402 UTC; the brightness temperature of the overshoot is -77º C, and the downwind warm trench is -62º C.
GOES-16 Clean Infrared Window Band (10.3 µm) from 1402 through 1457 UTC on 6 April 2017 (Click to animate)
The NOAA/CIMSS ProbTor product was monitoring this storm as it moved eastward through central Florida. The animation below shows the cell strengthening rapidly after 1310 UTC, and maintaining large ProbTor values for about an hour, after which time values collapsed.
NOAA/CIMSS ProbTor product from 1256 through 1444 UTC on 6 April 2017 (Click to animate)
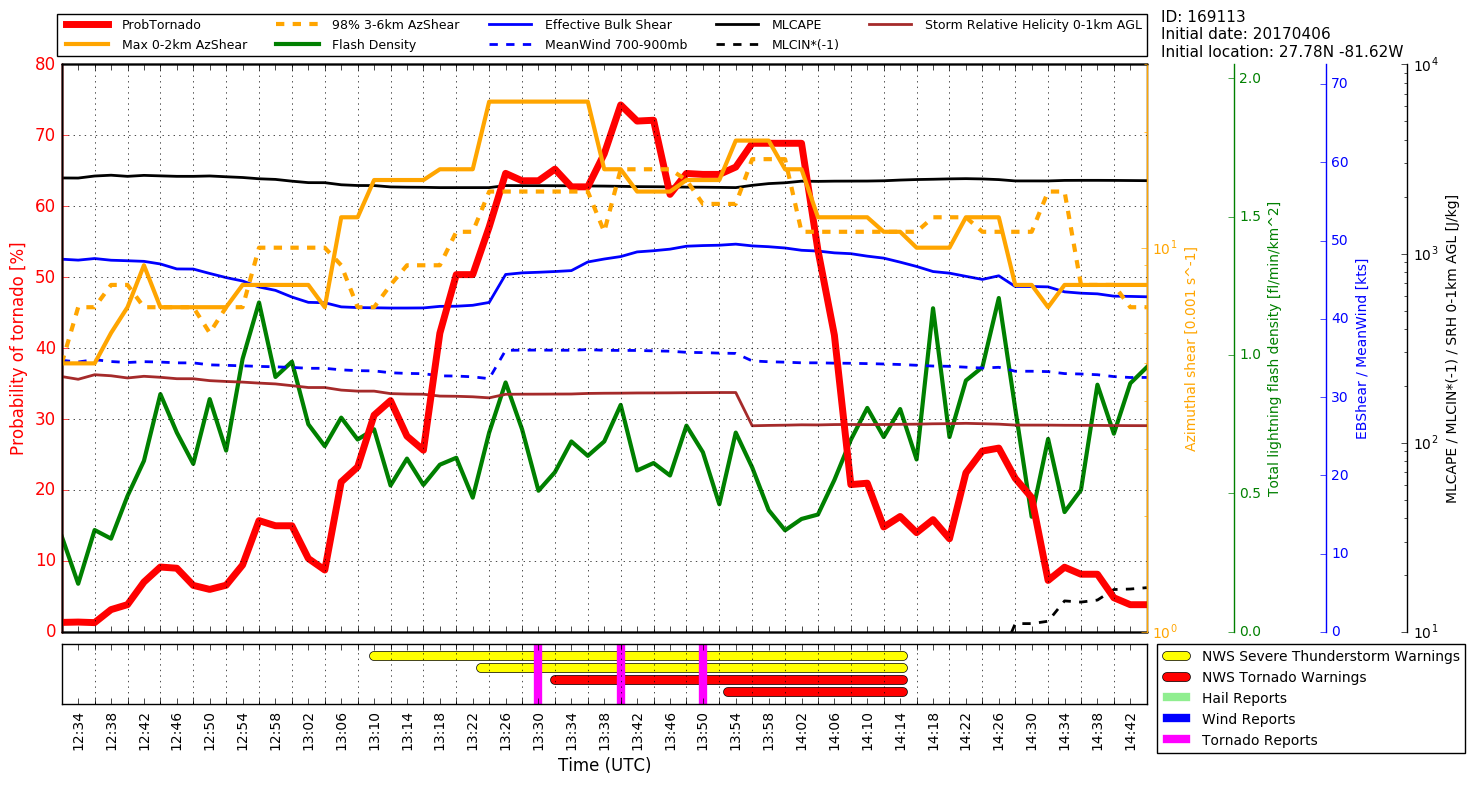
The time series below shows ProbTor as a function of time (1232-1444 UTC). The different parameters that are used in the computation of ProbTor are plotted as well. The times of the Severe Weather Warnings issued by the National Weather Service are drawn along the horizontal axis. The three wind events noted as vertical magenta lines (wind events taken from the Storm Prediction Center Storm Reports) occur within the envelope of highest ProbTor probabilities.

Plot of NOAA/CIMSS ProbTor values from 1232 through 1444 UTC on 6 April 2017. Vertical magenta lines are wind damage reports from SPC (Click to animate)
Note: NOAA/CIMSS ProbSevere Products — ProbHail, ProbWind, ProbTornado and the 2016 version of ProbSevere are all run using legacy GOES data (GOES-13 and GOES-15). GOES-16 data can be incorporated into this tool only after the statistical model has been trained on GOES-16 data, and that has not yet happened; A GOES-16 version is planned for the 2018 convective season.
With 16 Channels, the ABI on GOES-16 allows many different views of the same event. The animation below includes the 1/2-km resolution 0.64 µm “Red” Visible channel, the Snow/Ice channel (1.61 µm, 1-km resolution) that distinguished between clouds made of water droplets and clouds made of ice because ice strongly absorbs radiation at 1.61 µm and hence reflectances are smaller and the cloud appears less white, the Cirrus channel (1.378 µm, 2-km resolution) that highlights high clouds because radiation at the wavelength is very strongly absorbed by water vapor so reflectance from low-level clouds cannot escape to space before it is absorbed, and the Clean Infrared Window channel (10.33 µm, 2-km resolution) that affords a view that is least affected by water vapor absoption. In the animation below, the coastline does not become visible in the Cirrus channel because of strong absorption of radiation at that wavelength by water vapor. The Cirrus clouds in the 1.61 µm channel are considerably darker because of absorption by ice of radiation at that wavelength; a few water-based clouds do appear in the scene and are bright: 1.61 µm radiation is reflected quite well by water droplets.
GOES-16 “Red” Visible Band (0.64 µm), Snow/Ice Band (1.61 µm), Cirrus Band (1.378 µm) and Clean Infrared Window (10.33 µm) from 1222 through 1517 UTC on 6 April 2017 (Click to animate)
The GOES-R website has Quick Guide information on the Red Visible Band (0.64 µm), the Snow/Ice Band (1.61 µm), the Cirrus Band (1.378 µm) and the Clean Infrared Window Band (10.33 µm) at this site.
View only this post Read Less

![Visible images from GOES-15 (0.63 µm, left), GOES-16 (0.64 µm, center) and GOES-13 (0.63 µm, right), with hourly surface reports plotted in yellow [click to play animation]](https://cimss.ssec.wisc.edu/satellite-blog/wp-content/uploads/sites/5/2017/04/170404_goes15_goes16_goes13_visible_Great_Salt_Lake_les_anim.gif)
![MODIS Sea Surface Temperature product [click to enlarge]](https://cimss.ssec.wisc.edu/satellite-blog/wp-content/uploads/sites/5/2017/04/170404_0558utc_modis_sst.jpeg)
![GOES-16 0.64 µm Visible (left) and GOES-13 0.63 µm Visible (right) images, with surface reports of fog plotted in yellow [click to play animation]](https://cimss.ssec.wisc.edu/satellite-blog/wp-content/uploads/sites/5/2017/04/170404_goes16_goes13_visible_fog_AL_GA_anim.gif)
