** The GOES-16 data posted on this page are preliminary, non-operational data and are undergoing testing. **A comparison of GOES-16 Lower-level (7.3 µm), Mid-level (6.9 µm) and Upper-level (6.2 µm) Water Vapor images (above) revealed the presence of numerous mountain waves over parts of California and Nevada on 13 April 2017. The more pronounced of... Read More
![GOES-16 7.3 µm (left), 6.9 µm (center) and 6.2 µm (right) Water Vapor images [click to play animation]](https://cimss.ssec.wisc.edu/satellite-blog/wp-content/uploads/sites/5/2017/04/960x427_GOES16FL_B1098_G16_WV_3PANEL_CA_NV_13APR2017_2017103_125218_0003PANELS.GIF)
GOES-16 7.3 µm (left), 6.9 µm (center) and 6.2 µm (right) Water Vapor images [click to play animation]
A comparison of GOES-16 Lower-level (7.3 µm), Mid-level (6.9 µm) and Upper-level (6.2 µm) Water Vapor images (above) revealed the presence of numerous mountain waves over parts of California and Nevada on 13 April 2017. The more pronounced of these waves were caused by strong southwesterly winds interacting with higher terrain of the Sierra Nevada.
A 3-satellite comparison of GOES-15 (GOES-West), GOES-16 and GOES-13 (GOES-East) Water Vapor images (below) highlighted 2 factors that allowed better detection of these mountain waves by GOES-16 — improved spatial resolution (2 km for GOES-16 at satellite sub-point, vs 4 km for GOES-15/13), and a more direct satellite viewing angle (GOES-16 is positioned at 105ºW longitude, while GOES-15 is at 135ºW and GOES-13 is at 75ºW).
![OES-15 (6.5 µm, left), GOES-16 (6.9 µm, center) and GOES-13 (6.5 µm, right) Water Vapor images [click to play animation]](https://cimss.ssec.wisc.edu/satellite-blog/wp-content/uploads/sites/5/2017/04/G15_G16_G13_WV_CA_NV_13APR2017_960x427_B393_00219_2017103_130000_0003PANELS.GIF)
GOES-15 (6.5 µm, left), GOES-16 (6.9 µm, center) and GOES-13 (6.5 µm, right) Water Vapor images [click to play animation]
Note that there were no Visible cloud features associated with many of the waves seen on Water Vapor imagery
(below); encounters of Clear Air Turbulence (CAT) often occur with these types of mountain waves, as seen by scattered pilot reports of moderate turbulence (plotted as Category 4).
![GOES-16 Visible (0.64 µm, left) and Water Vapor (6.9 µm, right) images, with pilot reports of turbulence [click to play animation]](https://cimss.ssec.wisc.edu/satellite-blog/wp-content/uploads/sites/5/2017/04/958x638_AGOES16_B29_G16_VIS_WV_PIREPS_CA_NV_13APR2017_2017103_224218_0002PANELS.GIF)
GOES-16 Visible (0.64 µm, left) and Water Vapor (6.9 µm, right) images, with pilot reports of turbulence [click to play animation]
View only this post
Read Less
![GOES-16 Upper-Level Water Vapor (6.2 µm) images [click to play animation]](https://cimss.ssec.wisc.edu/satellite-blog/wp-content/uploads/sites/5/2017/04/170421_goes16_water_vapor_band8_full_disk_anim.gif)
![GOES-16 Mid-Level Water Vapor (6.9 µm) images [click to play animation]](https://cimss.ssec.wisc.edu/satellite-blog/wp-content/uploads/sites/5/2017/04/170421_goes16_water_vapor_band9_full_disk_anim.gif)
![GOES-16 Lower-Level Water Vapor (7.3 µm) images [click to play animation]](https://cimss.ssec.wisc.edu/satellite-blog/wp-content/uploads/sites/5/2017/04/170421_goes16_water_vapor_band10_full_disk_anim.gif)
![GOES-16 Visible (0.64 um, left) and Infrared Window (10.3 um, right) images [click to play animation]](https://cimss.ssec.wisc.edu/satellite-blog/wp-content/uploads/sites/5/2017/04/170420_goes16_visible_infrared_TS_Arlene_anim.gif)
![DMSP-15 SSMI Microwave (85 GHz) image [click to enlarge]](https://cimss.ssec.wisc.edu/satellite-blog/wp-content/uploads/sites/5/2017/04/170420_1654utc_dmsp15_ssmi_microwave_Arlene.png)
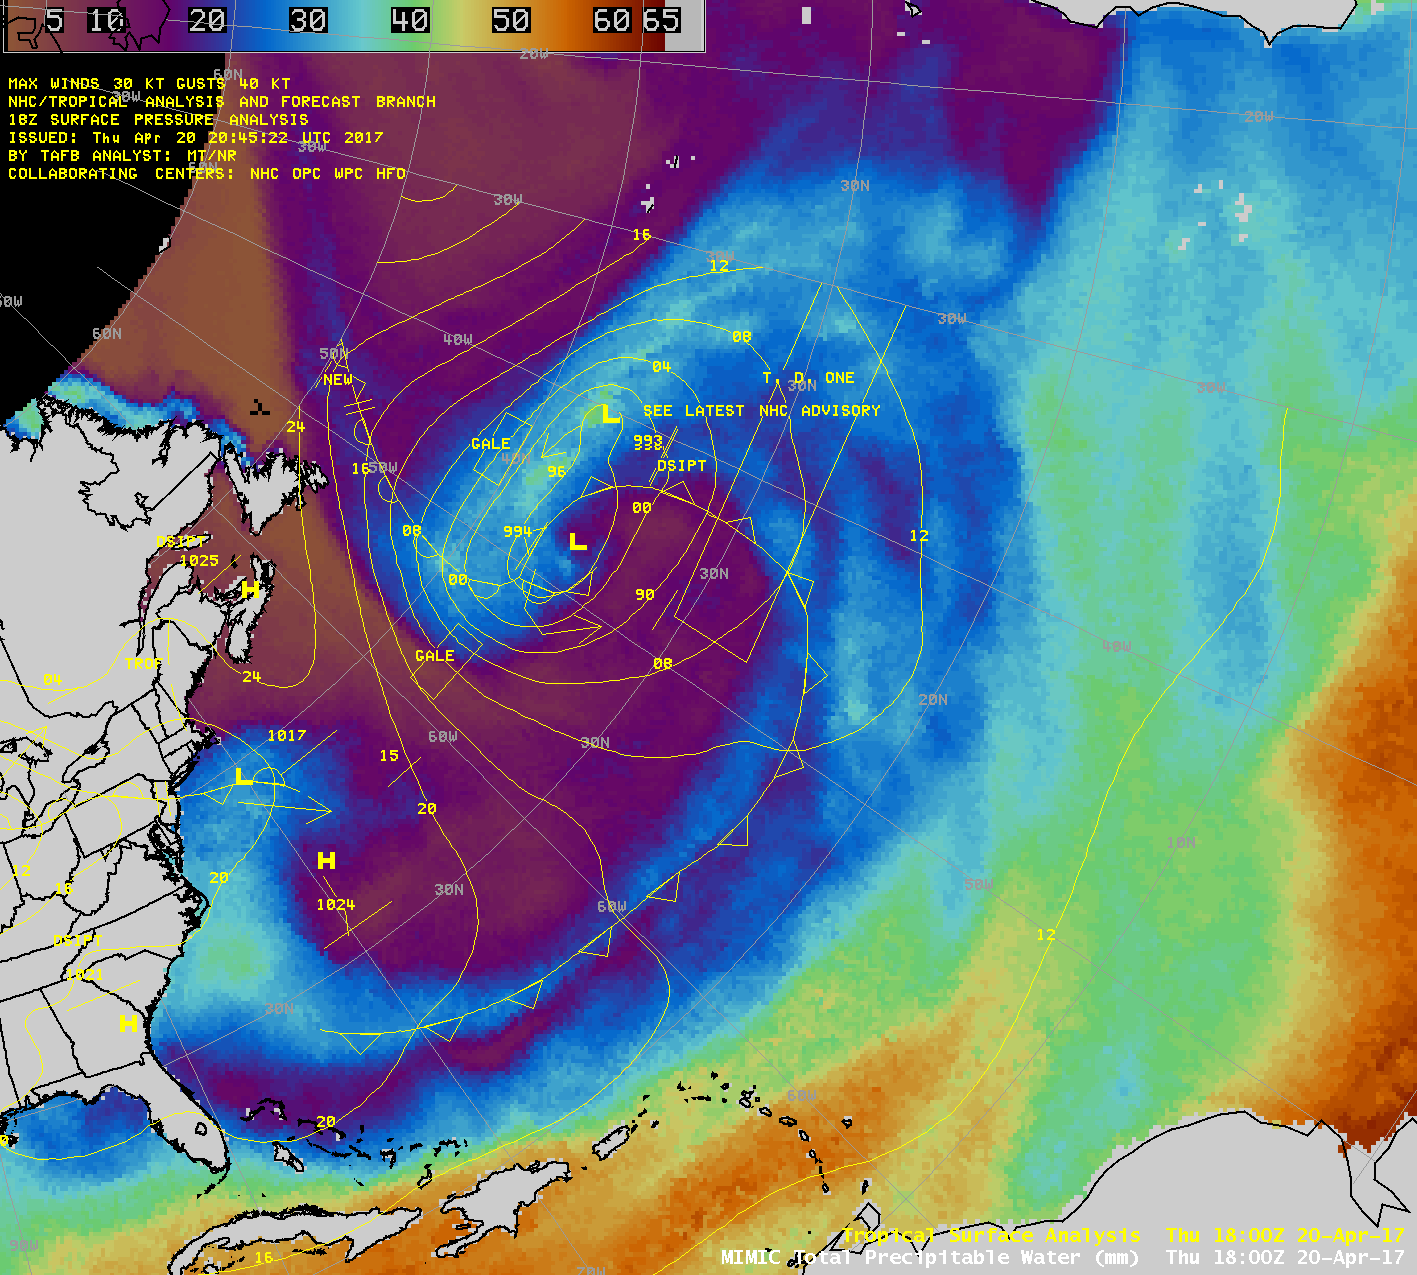
![MIMIC Total Precipitable Water product, with surface analyses [click to play animation]](https://cimss.ssec.wisc.edu/satellite-blog/wp-content/uploads/sites/5/2017/04/170419-20_mimic_tpw_anim.gif)
![GOES-16 7.3 µm (left), 6.9 µm (center) and 6.2 µm (right) Water Vapor images [click to play animation]](https://cimss.ssec.wisc.edu/satellite-blog/wp-content/uploads/sites/5/2017/04/170413_goes16_water_vapor_CA_NV_anim.gif)
![OES-15 (6.5 µm, left), GOES-16 (6.9 µm, center) and GOES-13 (6.5 µm, right) Water Vapor images [click to play animation]](https://cimss.ssec.wisc.edu/satellite-blog/wp-content/uploads/sites/5/2017/04/170413_goes15_goes16_goes13_water_vapor_pireps_CA_NV_anim.gif)
![GOES-16 Visible (0.64 µm, left) and Water Vapor (6.9 µm, right) images, with pilot reports of turbulence [click to play animation]](https://cimss.ssec.wisc.edu/satellite-blog/wp-content/uploads/sites/5/2017/04/170413_goes16_visible_water_vapor_pireps_CA_NV_anim.gif)
![GOES-16 (left) and GOES-13 (right) Shortwave Infrared (3.9 µm) images [click to play animation]](https://cimss.ssec.wisc.edu/satellite-blog/wp-content/uploads/sites/5/2017/04/170411_goes16_goes13_shortwave_infrared_KS_fires_anim.gif)
![GOES-16 Visible (0.64 µm, left) and GOES-13 Visible (0.63 µm, right) images, with hourly reports of surface visibility (statute miles, red) [click to play animation]](https://cimss.ssec.wisc.edu/satellite-blog/wp-content/uploads/sites/5/2017/04/170411_goes16_goes13_visible_surface_visibility_KS_fires_anim.gif)
