![NOAA-20 VIIRS Day/Night Band (0.7 µm) and Infrared Window (11.45 µm) images [click to enlarge]](https://cimss.ssec.wisc.edu/satellite-blog/wp-content/uploads/sites/5/2018/08/180822_1208utc_noaa20_viirs_DayNightBand_InfraredWindow_Hurricane_Lane_anim.gif)
NOAA-20 VIIRS Day/Night Band (0.7 µm) and Infrared Window (11.45 µm) images [click to enlarge]
A rare and sobering sight tonight in the Central Pacific, as Hurricane #Lane becomes only the 6th recorded Category 5 hurricane in this part of the Pacific, and the nearest to #Hawaii a Cat 5 hurricane has ever been observed. #hiwx pic.twitter.com/d8zLbVKjad
— Michael Lowry (@MichaelRLowry) August 22, 2018
GOES-15 (GOES-West) Infrared Window (10.7 µm) images (below) revealed a significant amount of trochoidal motion as Lane moved northwestward during the 21 August – 22 August period. The storm weakened somewhat to Category 4 intensity as of 15 UTC on 22 August.
![GOES-15 Infrared Window (10.7 µm) images [click to play animation | MP4]](https://cimss.ssec.wisc.edu/satellite-blog/wp-content/uploads/sites/5/2018/08/180821_22_goes15_infrared_Hurricane_Lane_anim.gif)
GOES-15 Infrared Window (10.7 µm) images [click to play animation | MP4]
* GOES-17 images shown here are preliminary and non-operational *

“Red” Visible (0.64 µm) images from Himawari-8 (left) and GOES-17 (right) [click to play animation | MP4]
![DMSP-16 SSMIS Microwave (85 GHz) image at 1411 UTC [click to enlarge]](https://cimss.ssec.wisc.edu/satellite-blog/wp-content/uploads/sites/5/2018/08/180822_1411utc_dmsp16_ssmis_microwave_Lane.jpeg)
DMSP-16 SSMIS Microwave (85 GHz) image at 1411 UTC [click to enlarge]
![DMSP-17 SSMIS Microwave (85 GHz) image at 1717 UTC [click to enlarge]](https://cimss.ssec.wisc.edu/satellite-blog/wp-content/uploads/sites/5/2018/08/180822_1717utc_dmsp17_ssmis_microwave_Lane.jpeg)
DMSP-17 SSMIS Microwave (85 GHz) image at 1717 UTC [click to enlarge]
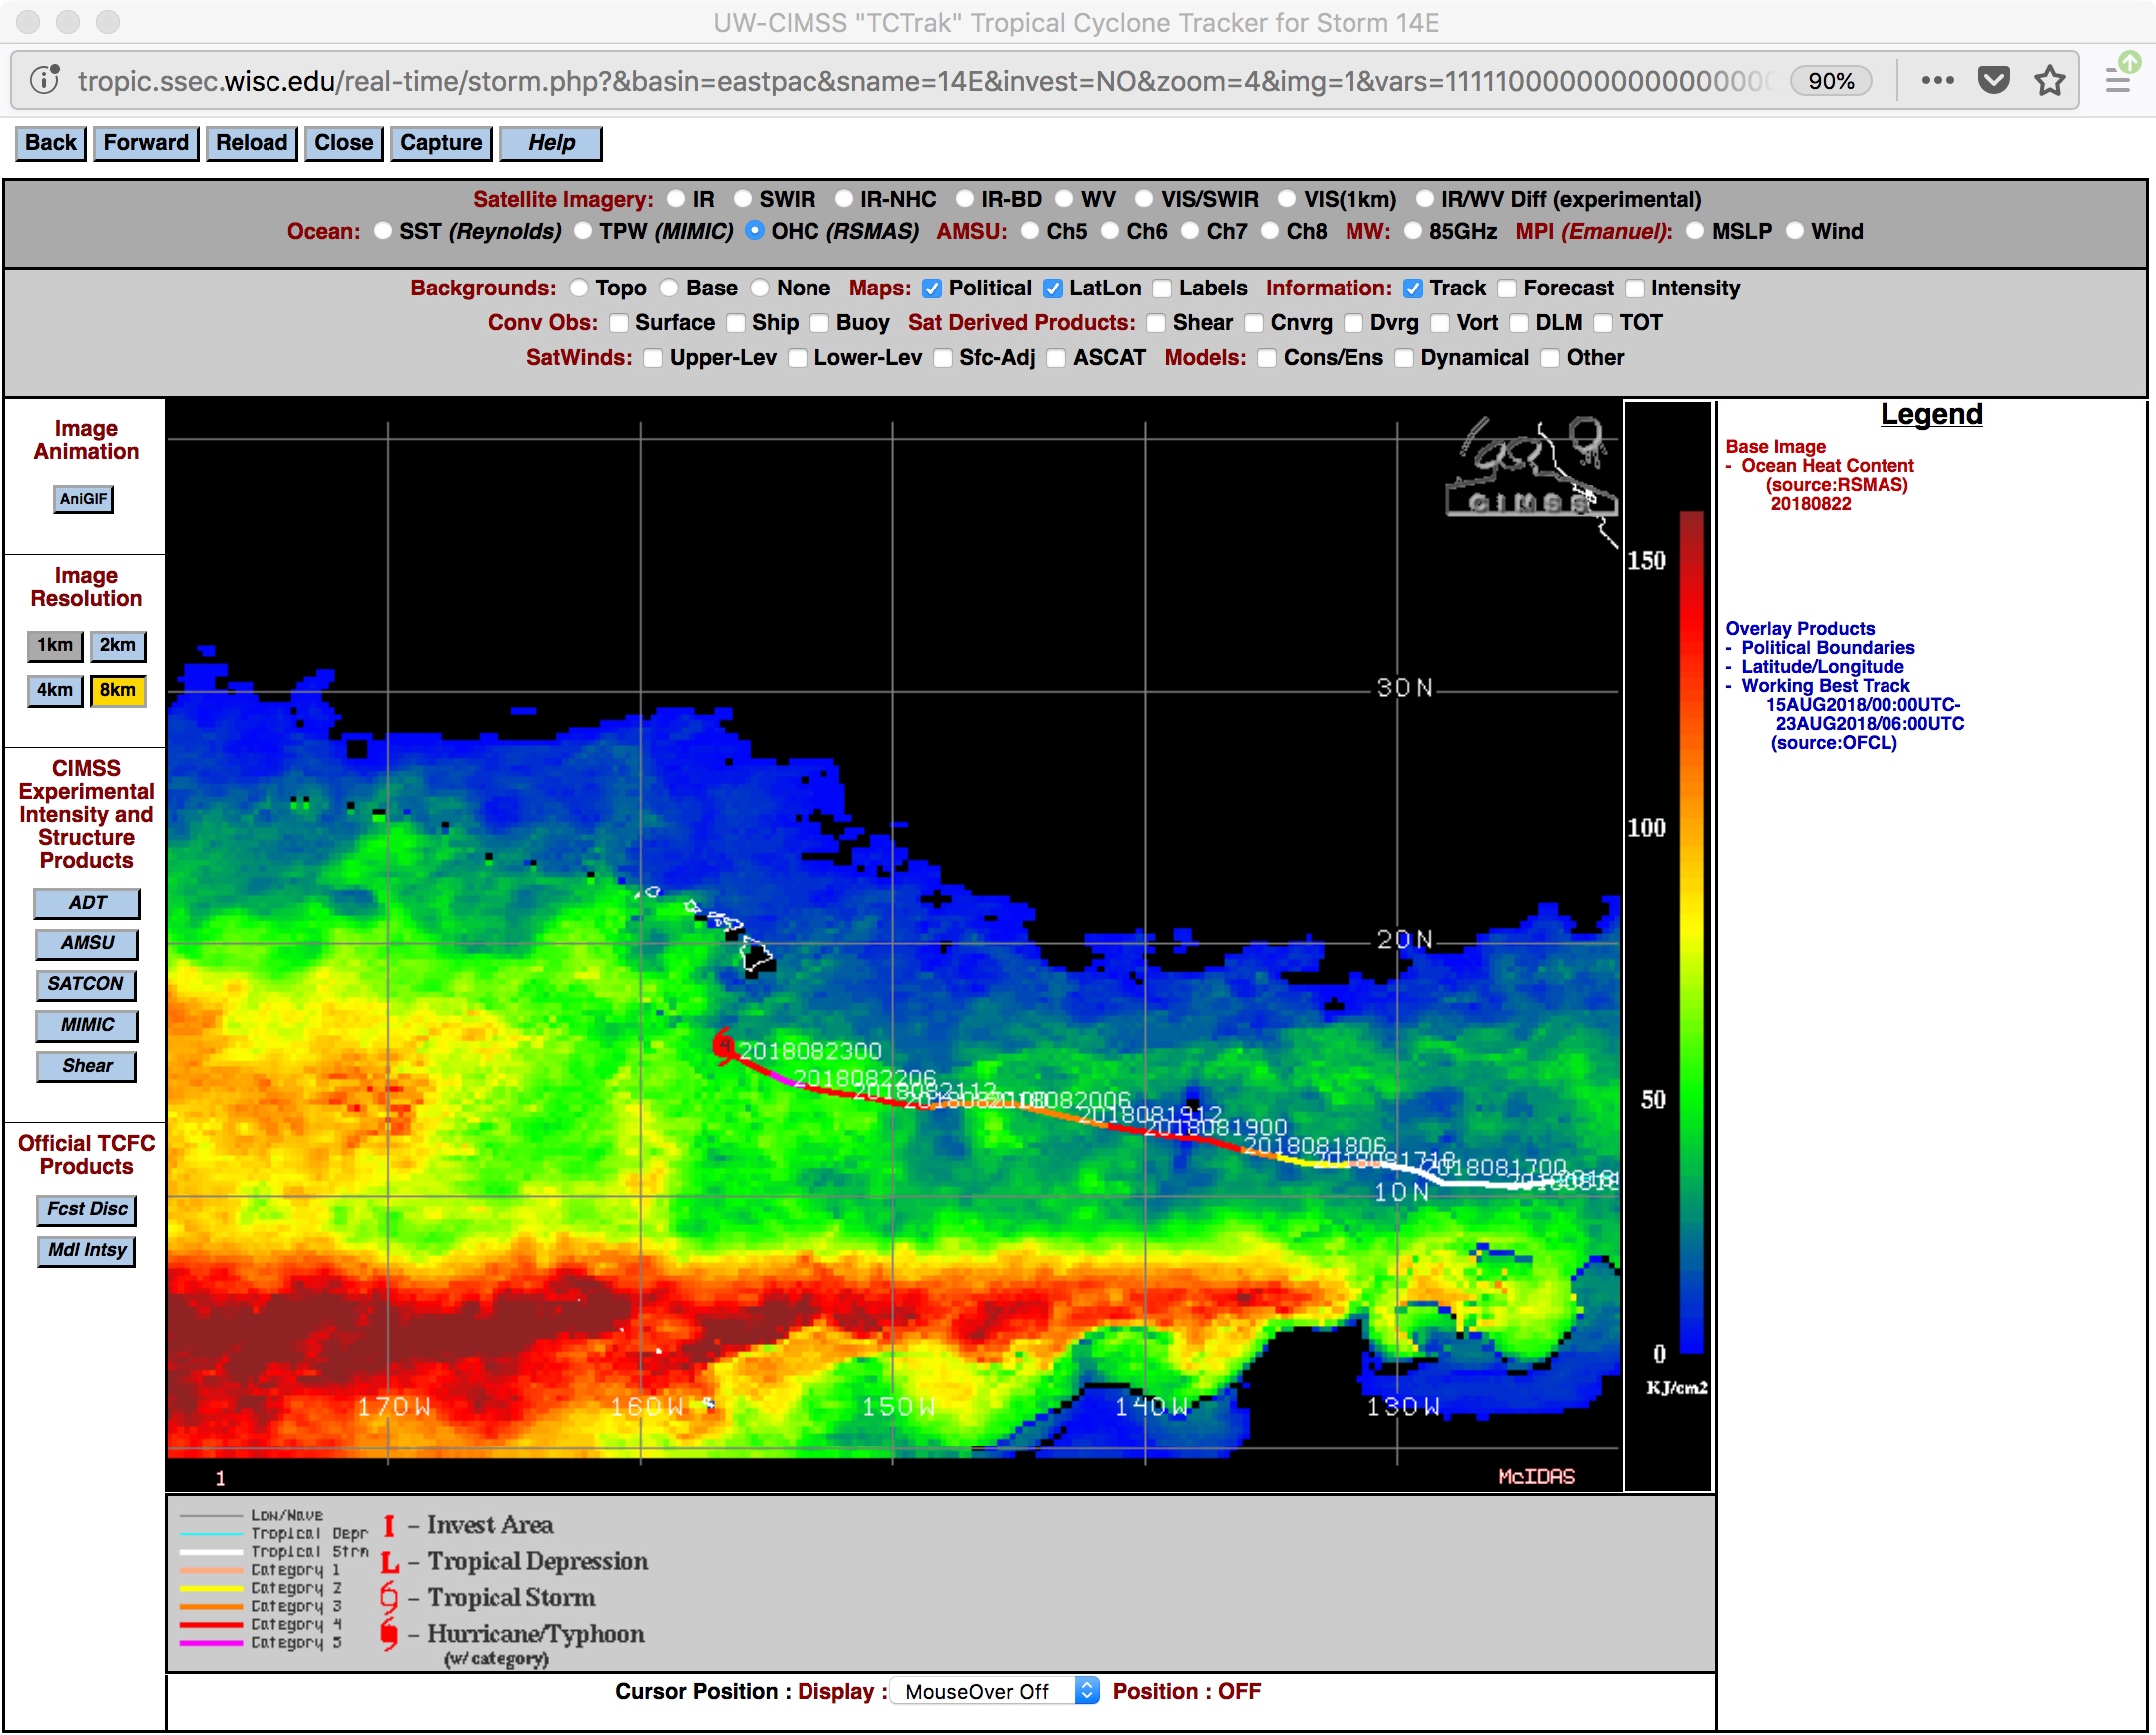
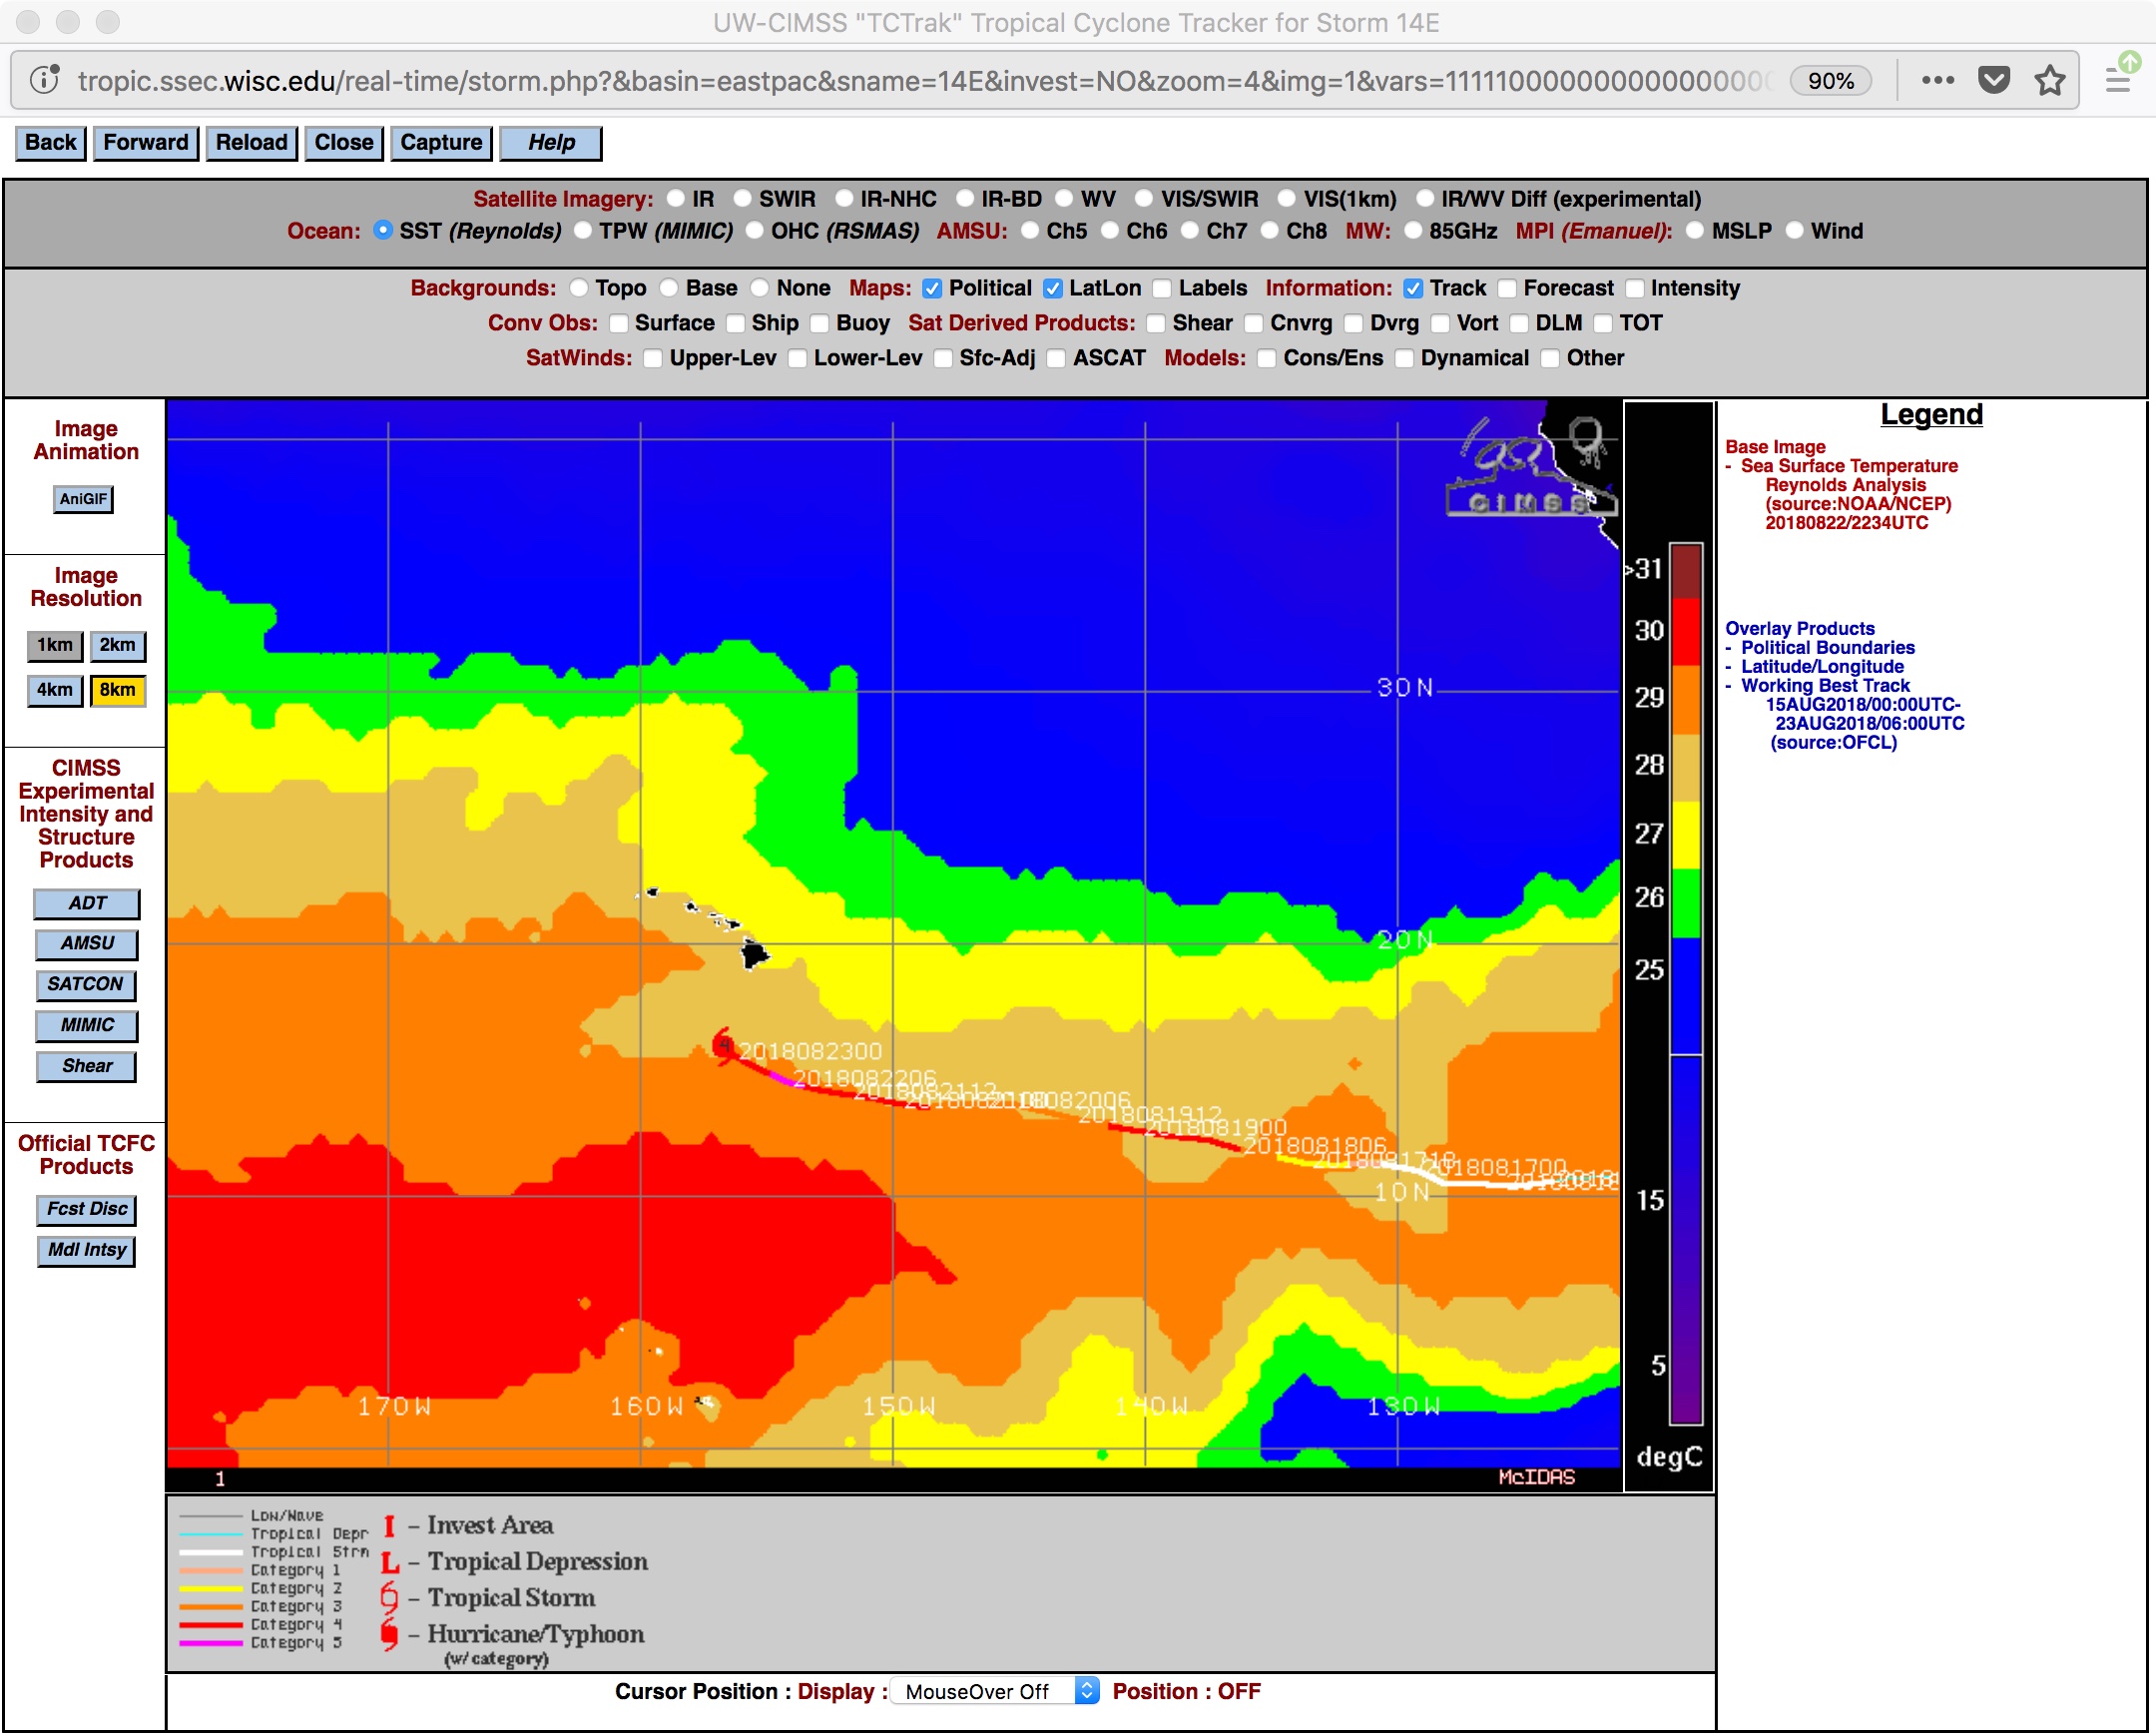
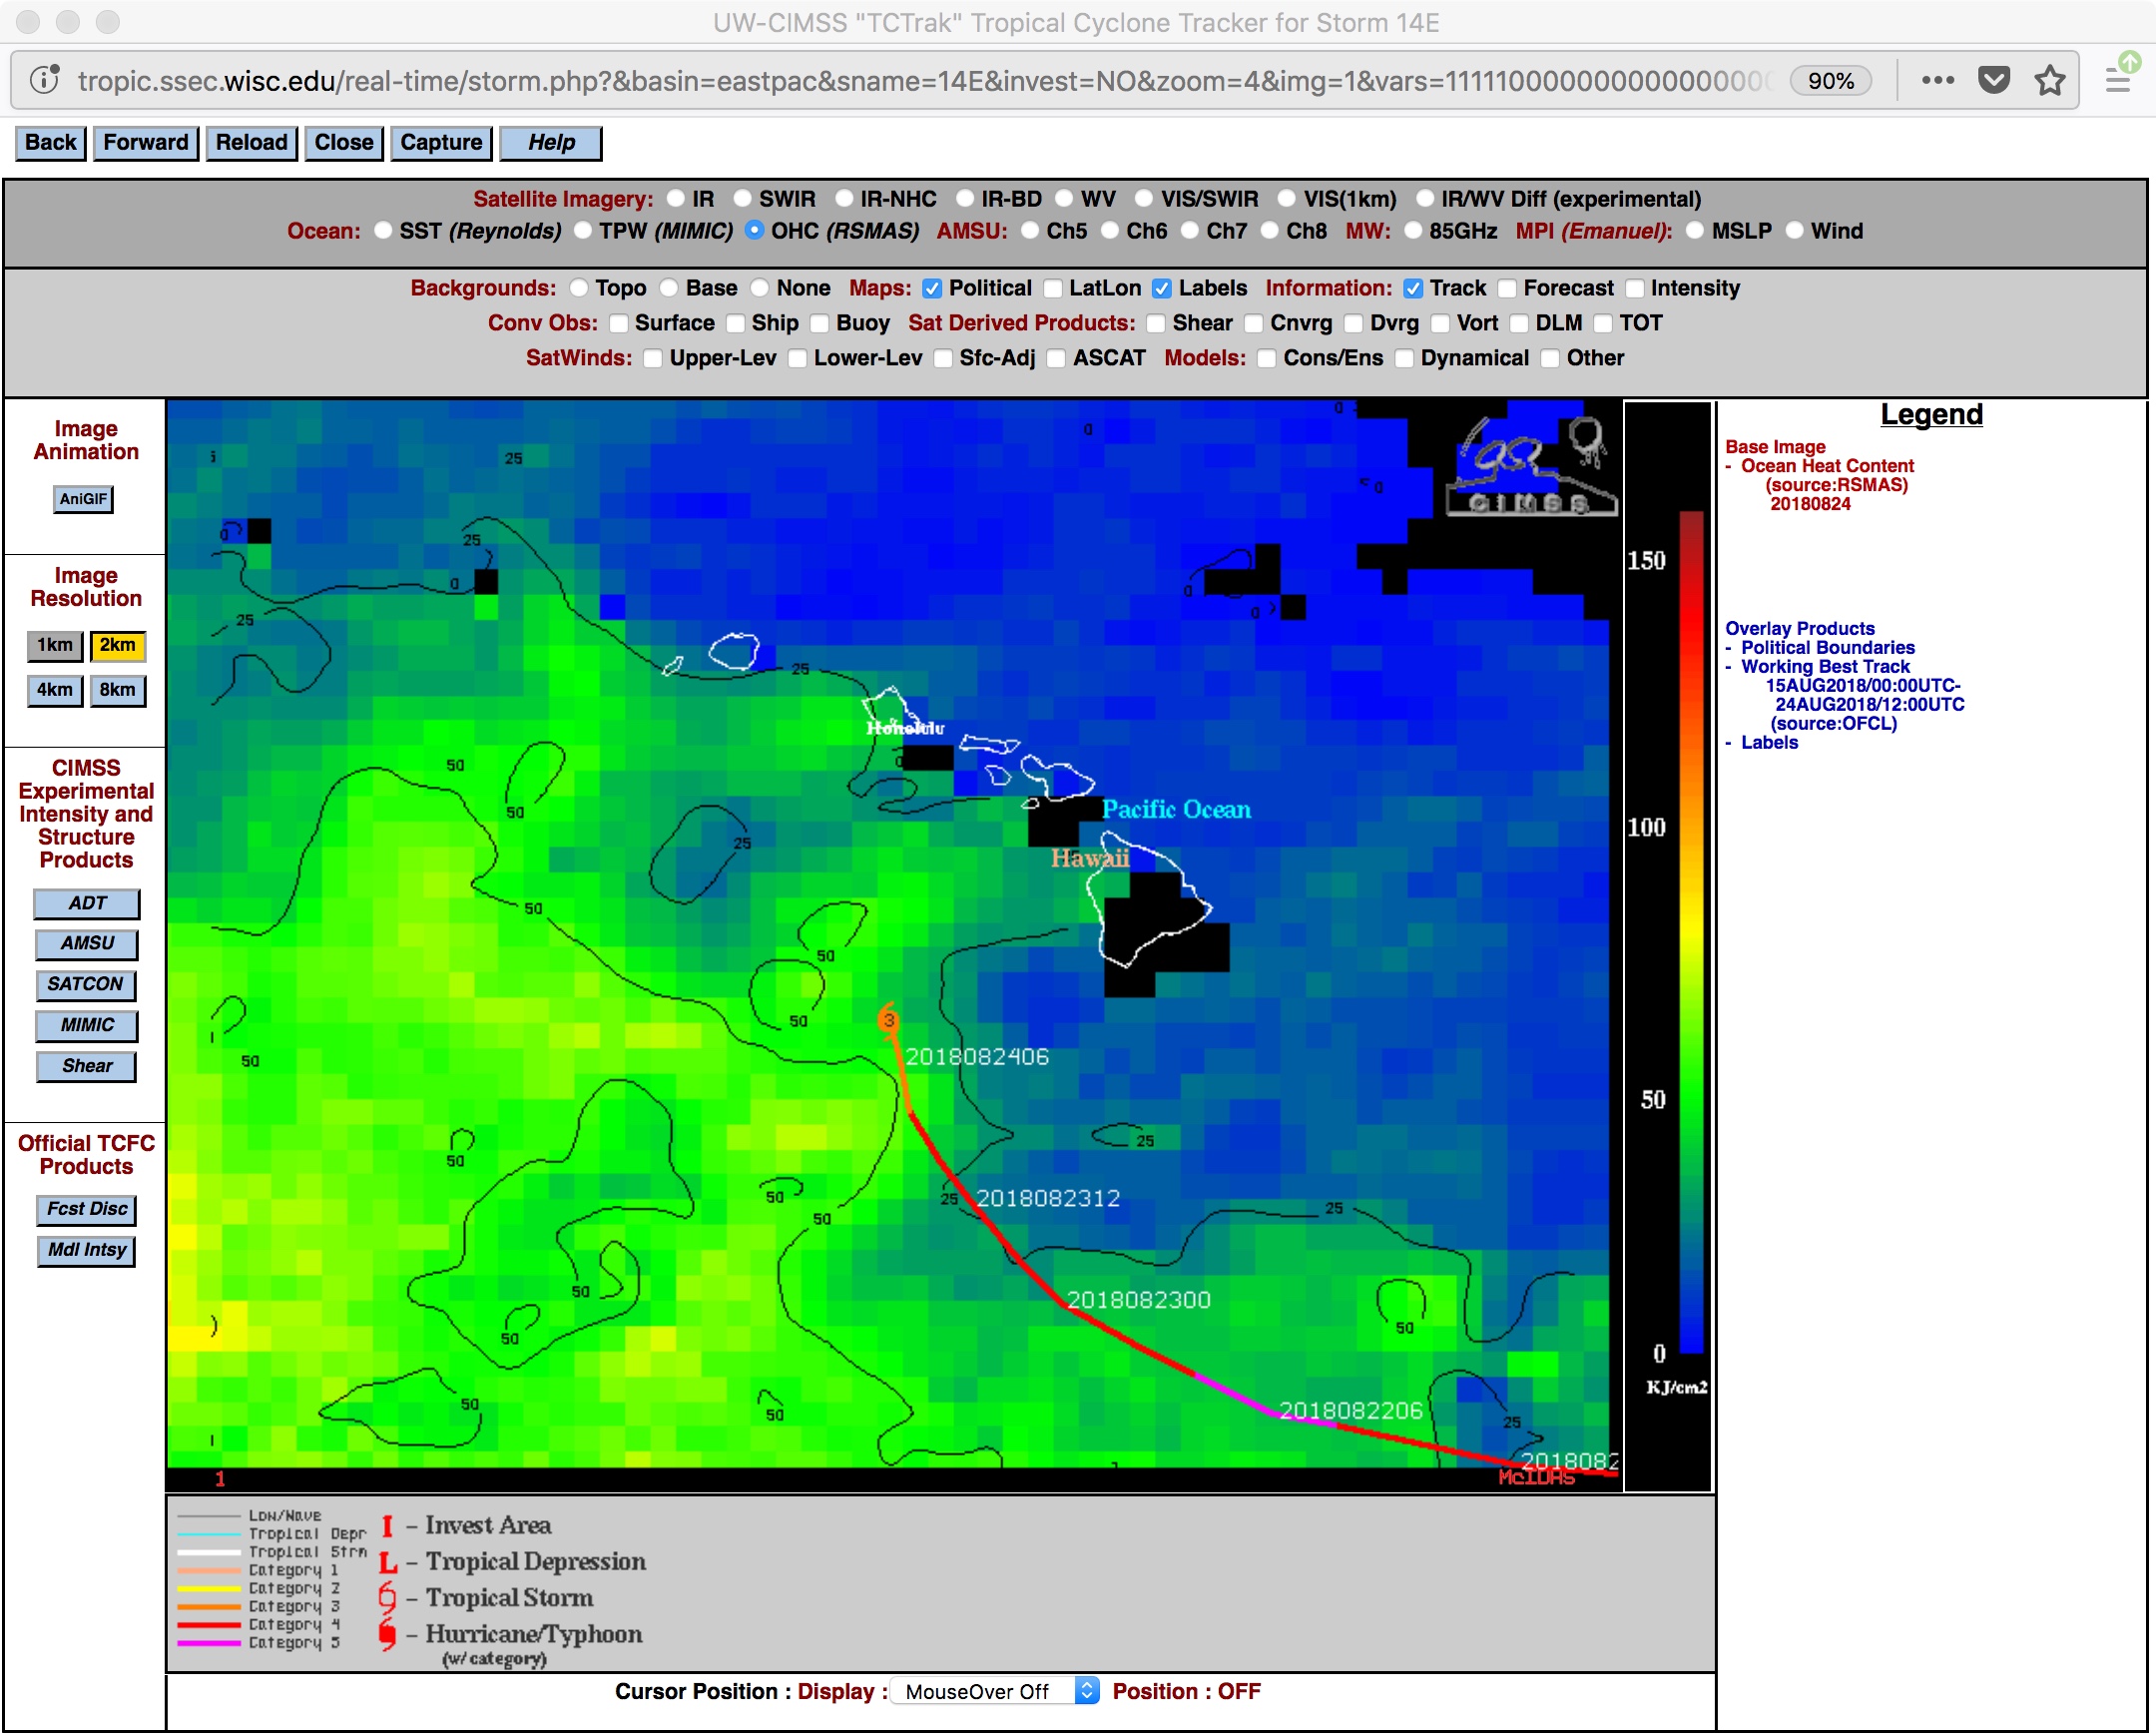
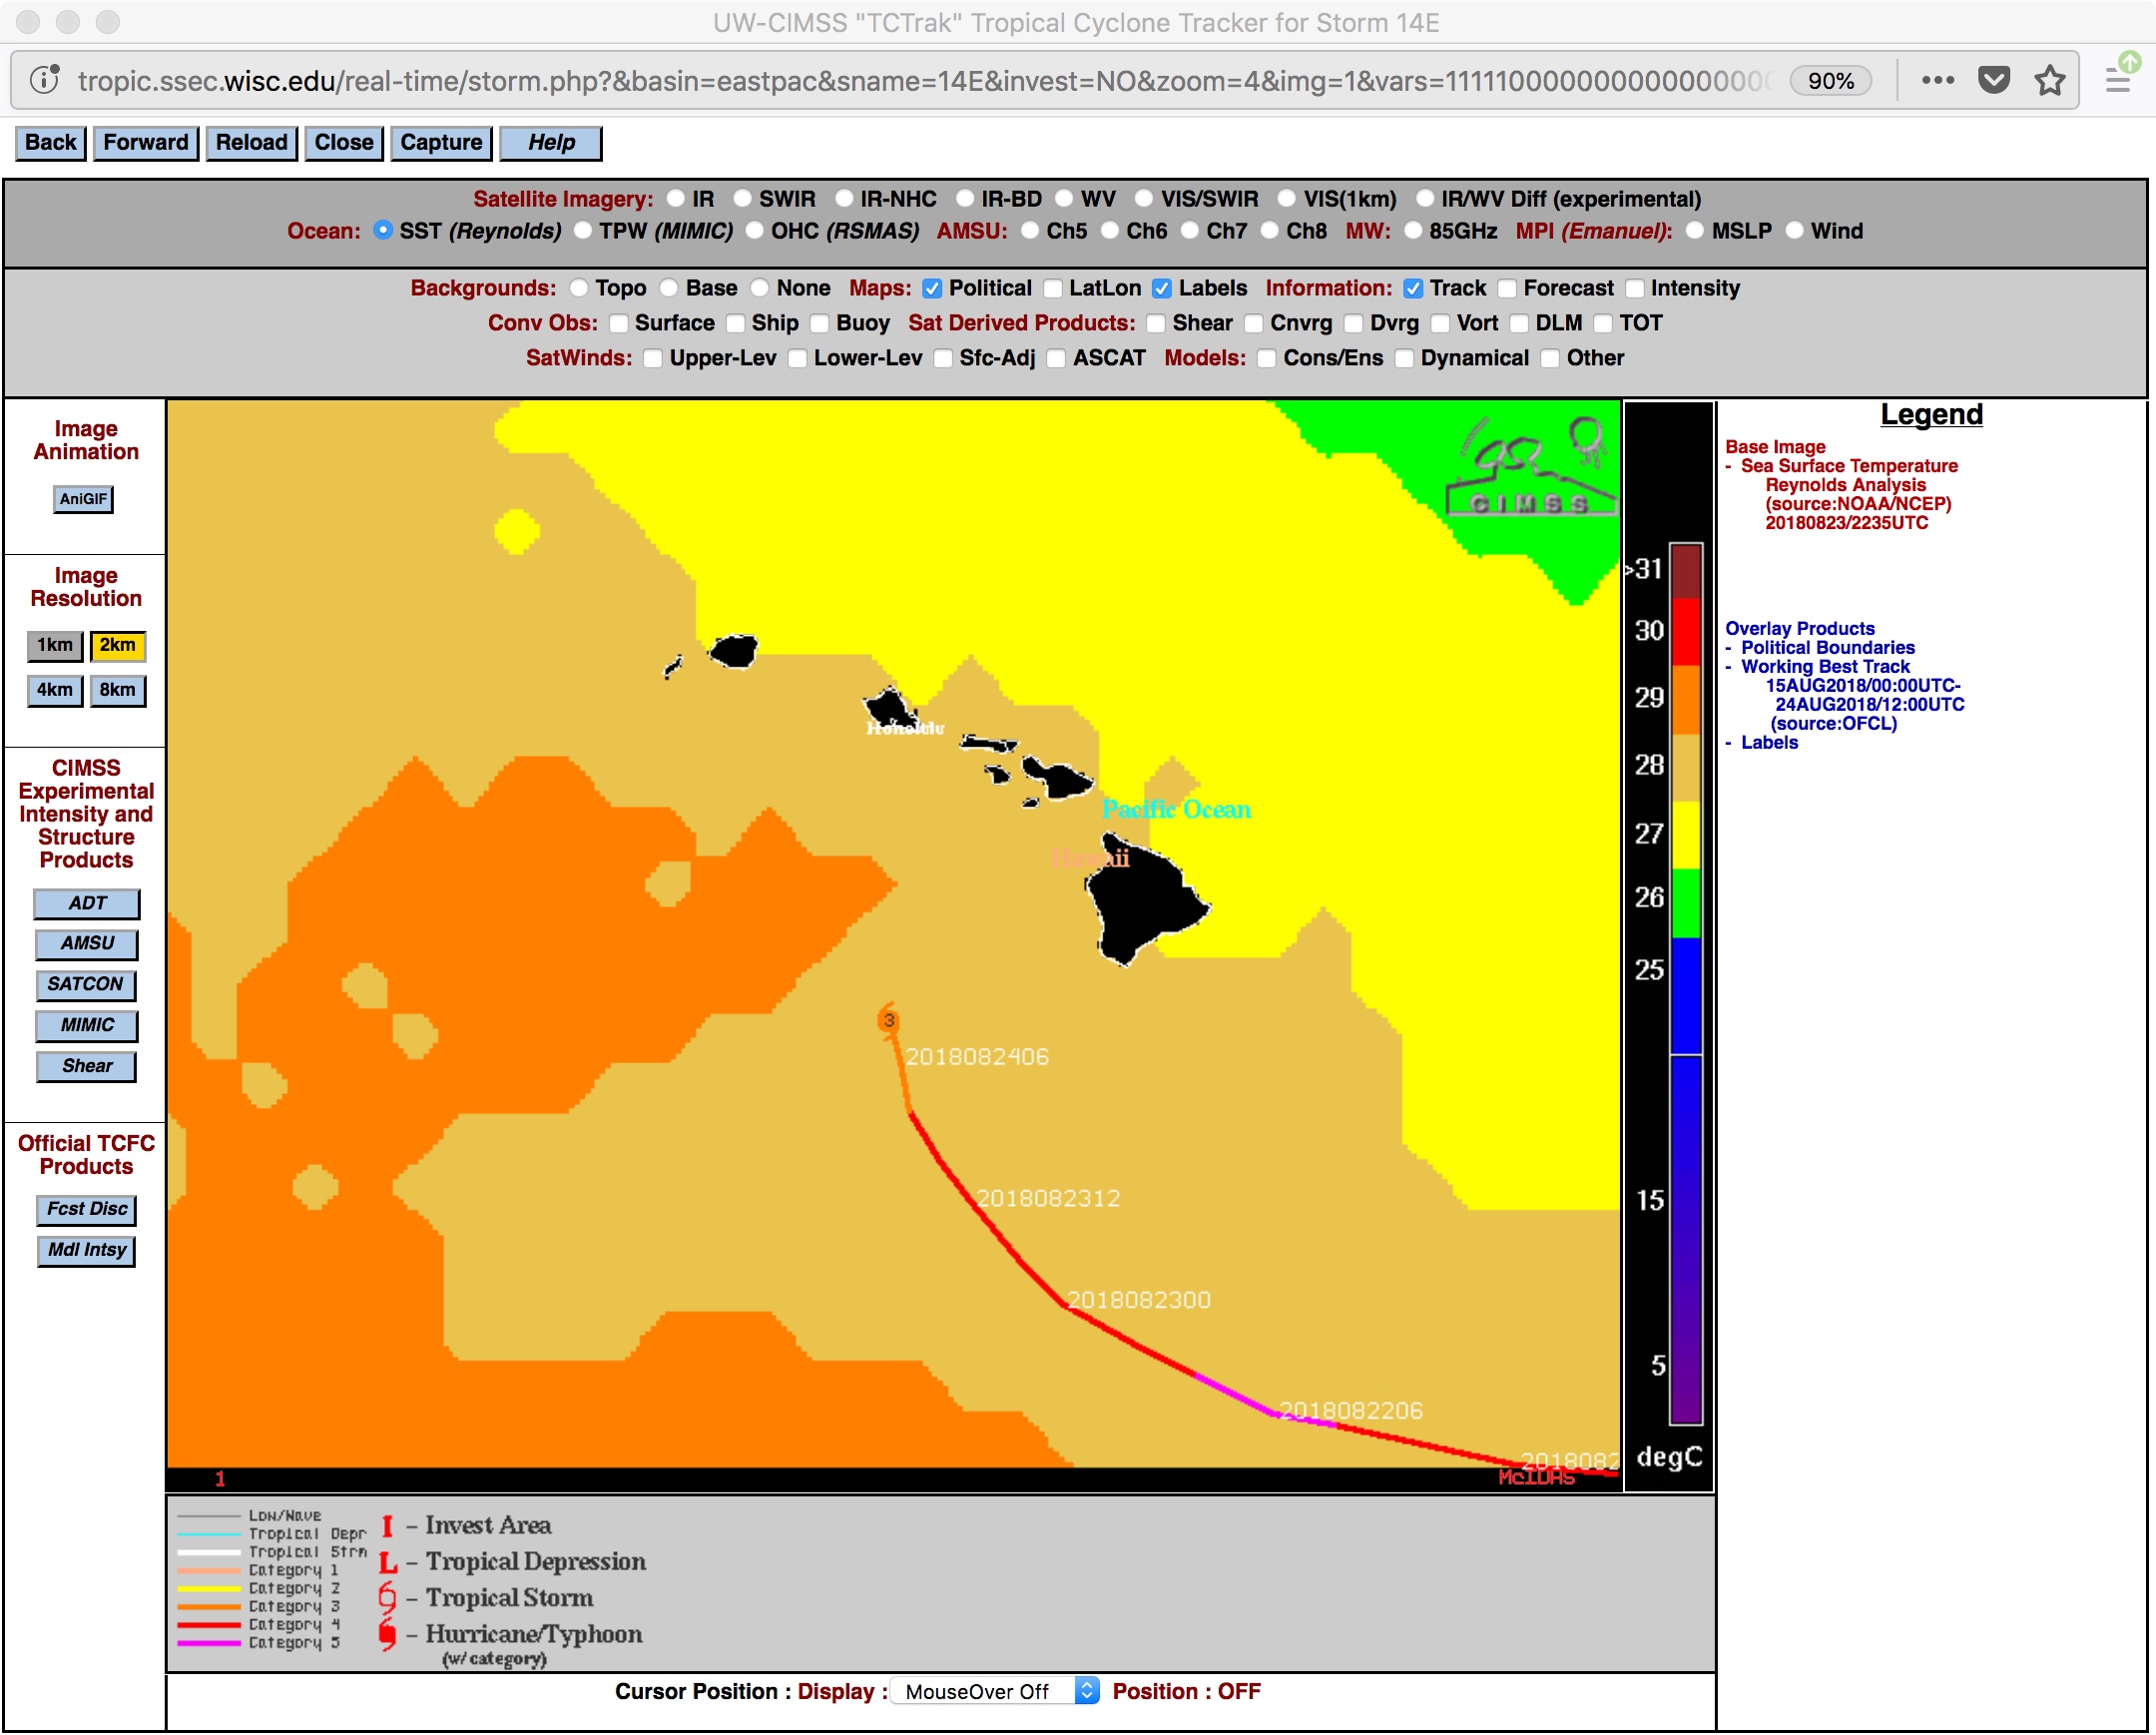
![Track of Hurricane Lane, with maps of Ocean Heat Content and Sea Surface Temperature [click to enlarge]](https://cimss.ssec.wisc.edu/satellite-blog/wp-content/uploads/sites/5/2018/08/180822_ohc_sst_track_Lane_anim.gif)
Track of Hurricane Lane, with maps of Ocean Heat Content and Sea Surface Temperature [click to enlarge]
===== 23 August Update =====
![NOAA-20 VIIRS Day/Night Band (0.7 µm) and Infrared Window (11.45 µm) images at 1150 UTC [click to enlarge]](https://cimss.ssec.wisc.edu/satellite-blog/wp-content/uploads/sites/5/2018/08/180823_1150utc_noaa20_viirs_DayNightBand_InfraredWindow_Hurricane_Lane_anim.gif)
NOAA-20 VIIRS Day/Night Band (0.7 µm) and Infrared Window (11.45 µm) images at 1150 UTC [click to enlarge]
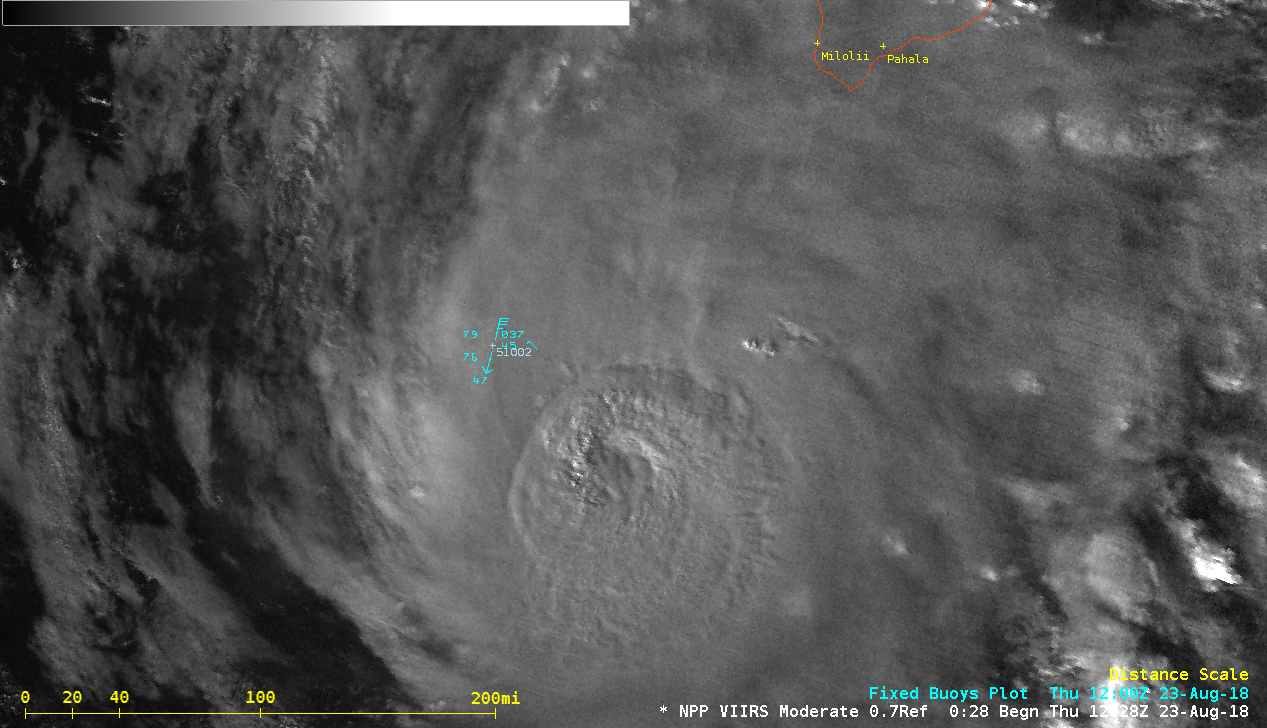
![Suomi NPP VIIRS Day/Night Band (0.7 µm) and Infrared Window (11.45 µm) images at 1240 UTC [click to enlarge]](https://cimss.ssec.wisc.edu/satellite-blog/wp-content/uploads/sites/5/2018/08/180823_1240utc_suomi_npp_viirs_DayNightBand_InfraredWindow_Hurricane_Lane_anim.gif)
Suomi NPP VIIRS Day/Night Band (0.7 µm) and Infrared Window (11.45 µm) images at 1240 UTC [click to enlarge]
![GOES-15 Visible (0.63 µm, left) and Infrared Window (10.7 µm, right) images, with hourly plots of data from Buoy 51002 [click to play animation | MP4]](https://cimss.ssec.wisc.edu/satellite-blog/wp-content/uploads/sites/5/2018/08/180823_goes15_visible_infrared_Hurricane_Lane_anim.gif)
GOES-15 Visible (0.63 µm, left) and Infrared Window (10.7 µm, right) images, with hourly plots of data from Buoy 51002 [click to play animation | MP4]

Plot of wind speed/gust and air pressure data from Buoy 51002
At 1703 UTC Buoy 51002 was located just west of the eye, beneath strong convection of the eyewall as seen on a DMSP-17 SSMIS Microwave (85 GHz) image (below).
![DMSP-17 SSMIS Microwave (85 GHz) image at 1703 UTC, with and without plots of buoy data [click to enlarge]](https://cimss.ssec.wisc.edu/satellite-blog/wp-content/uploads/sites/5/2018/08/180823_1703utc_dmsp17_ssmis_microwave_buoy_Lane_anim.gif)
DMSP-17 SSMIS Microwave (85 GHz) image at 1703 UTC, with and without plots of buoy data [click to enlarge]
![Suomi NPP VIIRS Day/Night Band (0.7 µm) image [click to enlarge]](https://cimss.ssec.wisc.edu/satellite-blog/wp-content/uploads/sites/5/2018/08/snpp_viirs_dnb_Lane-20180823_233423.png)
Suomi NPP VIIRS Day/Night Band (0.7 µm) image [click to enlarge]
===== 24 August Update =====
![Suomi NPP VIIRS Day/Night Band (0.7 µm) image [click to enlarge]](https://cimss.ssec.wisc.edu/satellite-blog/wp-content/uploads/sites/5/2018/08/snpp_viirs_dnb_Lane-20180824_121114.png)
Suomi NPP VIIRS Day/Night Band (0.7 µm) image [click to enlarge]
GOES-15 Infrared Window (10.7 µm) images (below) showed the development of the transverse banding as Lane eventually weakened to a Category 1 storm during the course of the day; a rapid warming of the cloud-top infrared brightness temperatures began around 2100 UTC. Even though the Ocean Heat Content and Sea Surface Temperature in the waters immediately west of Hawai’i were still fairly high, the hurricane was moving into an environment of increasingly unfavorable deep-layer wind shear which acted to decouple the low-level and mid-level circulations and hasten the weakening process.
![GOES-15 Infrared Window (10.7 µm) images [click to play animation | MP4]](https://cimss.ssec.wisc.edu/satellite-blog/wp-content/uploads/sites/5/2018/08/180824_goes15_infrared_Hurricane_Lane_anim.gif)
GOES-15 Infrared Window (10.7 µm) images [click to play animation | MP4]
![GOES-15 Visible (0.63 µm) images [click to play animation | MP4]](https://cimss.ssec.wisc.edu/satellite-blog/wp-content/uploads/sites/5/2018/08/180824_goes15_visible_Lane_anim.gif)
GOES-15 Visible (0.63 µm) images [click to play animation | MP4]
![Suomi NPP VIIRS Day/Night Band (0.7 µm) images [click to enlarge]](https://cimss.ssec.wisc.edu/satellite-blog/wp-content/uploads/sites/5/2018/08/180824_suomi_npp_viirs_DatNightBand_Hurricane_Lane_anim.gif)
Suomi NPP VIIRS Day/Night Band (0.7 µm) images [click to enlarge]
===== 25 August Update =====
On the islands, the highest wind gust associated with Lane was 74 mph — and storm total rainfall amounts greater than 50 inches were recorded, with Hilo setting a record 3-day accumulation of 31.85 inches and a record 4-day accumulation of 36.76 inches. Rainfall rates on the Big Island exceeded 19 inches in 24 hours on 23 July.
![Time series of surface reports from Hilo, Hawai'i [click to enlarge]](https://cimss.ssec.wisc.edu/satellite-blog/wp-content/uploads/sites/5/2018/08/180822_180825_PHTO_SFCMG.GIF)
Time series of surface reports from Hilo, Hawai’i [click to enlarge]
![MIMIC Total Precipitable Water product during 22-25 August [click to play animation | MP4]](https://cimss.ssec.wisc.edu/satellite-blog/wp-content/uploads/sites/5/2018/08/180822_180825_mimic_tpw2_epac_anim.gif)
MIMIC Total Precipitable Water product during 22-25 August [click to play animation | MP4]
![Suomi NPP VIIRS Day/Night Band (0.7 µm) images [click to enlarge]](https://cimss.ssec.wisc.edu/satellite-blog/wp-content/uploads/sites/5/2018/08/180824_180825_suomi_npp_viirs_DayNightBand_TS_Lane_anim.gif)
Suomi NPP VIIRS Day/Night Band (0.7 µm) images [click to enlarge]
View only this post Read Less

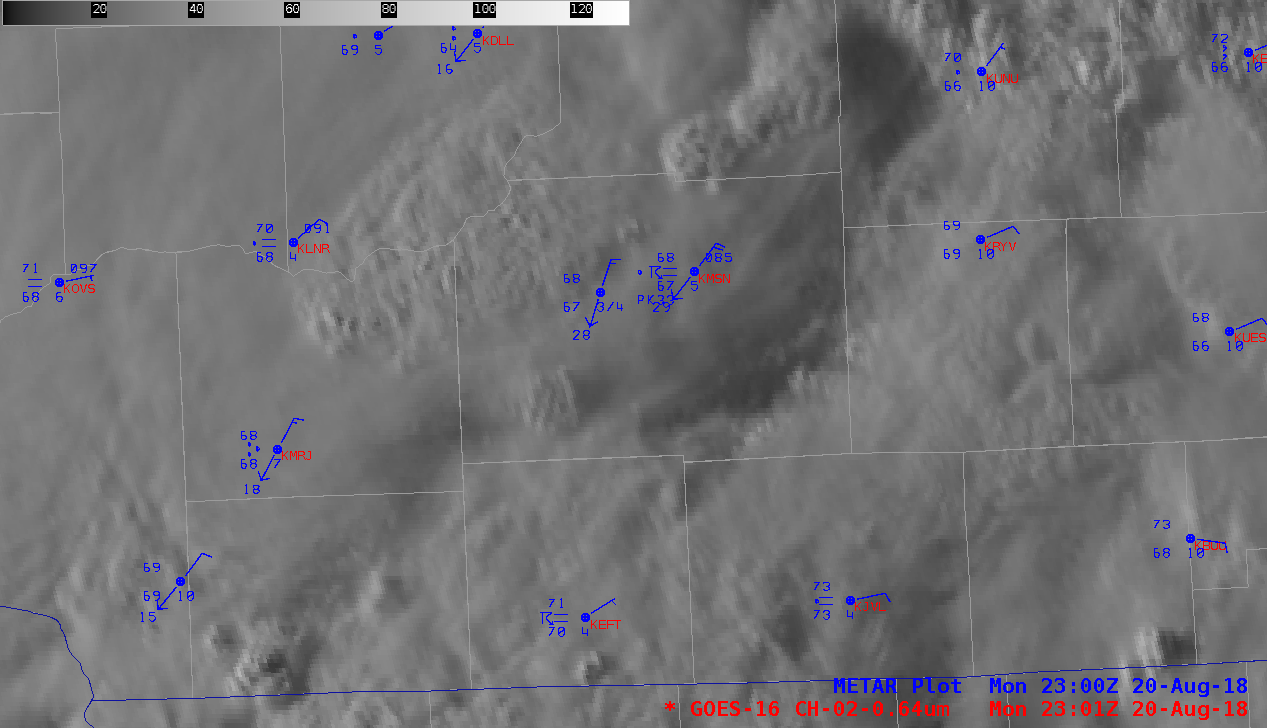
![GOES-16 Infrared images [click to play animation]](https://cimss.ssec.wisc.edu/satellite-blog/wp-content/uploads/sites/5/2018/08/msn_ir-20180820_230109.png)
![GOES-16 Mid-level Water Vapor (6.9 µm) images [click to play MP4 animation]](https://cimss.ssec.wisc.edu/satellite-blog/wp-content/uploads/sites/5/2018/08/msn_wv-20180820_165731.png)
![Composite of GOES-16 Water Vapor (6.9 µm) imagery and Total Precipitable Water product [click to play MP4 animation]](https://cimss.ssec.wisc.edu/satellite-blog/wp-content/uploads/sites/5/2018/08/msn_tpw-20180820_200732.png)
![GOES-16 AllSky Total Precipitable Water product [click to play animation | MP4]](https://cimss.ssec.wisc.edu/satellite-blog/wp-content/uploads/sites/5/2018/08/180820_21_goes16_allsky_tpw_anim.gif)
![Aqua MODIS Total Precipitable Water product [click to enlarge]](https://cimss.ssec.wisc.edu/satellite-blog/wp-content/uploads/sites/5/2018/08/MODIS_TPW_20180820_1943.png)
![Map of flood impacts for portions of the UW-Madison campus adjacent to the southwestern shoreline of Lake Mendota [click to enlarge]](https://cimss.ssec.wisc.edu/satellite-blog/wp-content/uploads/sites/5/2018/08/180821_Lake_Mendota_flood_area.jpeg)


![Shortwave Infrared (3.7 µm) images from Terra / Aqua MODIS and Suomi NPP / NOAA-20 VIIRS [click to enlarge]](https://cimss.ssec.wisc.edu/satellite-blog/wp-content/uploads/sites/5/2018/08/180817_modis_viirs_ShortwaveInfrared_BC_fires_anim.gif)
![Terra MODIS Visible (0.65 µm) and Shortwave Infrared (3.7 µm) images [click to enlarge]](https://cimss.ssec.wisc.edu/satellite-blog/wp-content/uploads/sites/5/2018/08/180817_1912utc_terra_modis_visible_shortwaveInfrared_BC_fires_anim.gif)
![NOAA-20 VIIRS Visible (0.64 µm) and Shortwave Infrared (3.74 µm) images [click to enlarge]](https://cimss.ssec.wisc.edu/satellite-blog/wp-content/uploads/sites/5/2018/08/180817_1950utc_noaa20_viirs_visible_shortwaveInfrared_BC_fires_anim.gif)
![Suomi NPP VIIRS Visible (0.64 µm) and Shortwave Infrared (3.74 µm) images at 2129 UTC [click to enlarge]](https://cimss.ssec.wisc.edu/satellite-blog/wp-content/uploads/sites/5/2018/08/180817_2129utc_suomi_npp_viirs_visible_shortwaveInfrared_BC_fires_anim.gif)
![Daily composites of Suomi NPP VIIRS True Color RGB images (with VIIRS fire detections in red), 11-17 August [click to play MP4 | Animated GIF]](https://cimss.ssec.wisc.edu/satellite-blog/wp-content/uploads/sites/5/2018/08/180817_viirs_tc.jpeg)
![Time series of surface reports from Edmonton, Alberta during the period 14-17 August [click to enlarge]](https://cimss.ssec.wisc.edu/satellite-blog/wp-content/uploads/sites/5/2018/08/180814_180817_CYEG_SFCMG.GIF)
![Plots of Spectral Response Functions for ABI Bands 5, 6 and 7 [click to enlarge]](https://cimss.ssec.wisc.edu/satellite-blog/wp-content/uploads/sites/5/2018/08/ABI_Band_5_6_7_Spectral_Response_Functions_Fires.png)
