* GOES-17 images shown here are preliminary and non-operational *Beginning at 1530 UTC on 28 August 2018, GOES-17 data and imagery became available via the GOES Rebroadcast (GRB) distribution mechanism — and beginning at 1700 UTC via the Satellite Broadcast Network (SBN) that provides data to AWIPS (above). While images are available from all 16... Read More
![AWIPS Satellite menu [click to enlarge]](https://cimss.ssec.wisc.edu/satellite-blog/wp-content/uploads/sites/5/2018/08/GOES17_awips_menu.png)
AWIPS Satellite menu [click to enlarge]
* GOES-17 images shown here are preliminary and non-operational *
Beginning at 1530 UTC on 28 August 2018, GOES-17 data and imagery became available via the GOES Rebroadcast (GRB) distribution mechanism — and beginning at 1700 UTC via the Satellite Broadcast Network (SBN) that provides data to AWIPS (above). While images are available from all 16 of the ABI spectral bands, it is important to note that ABI cooling system issues will affect the image quality from certain bands during certain times.
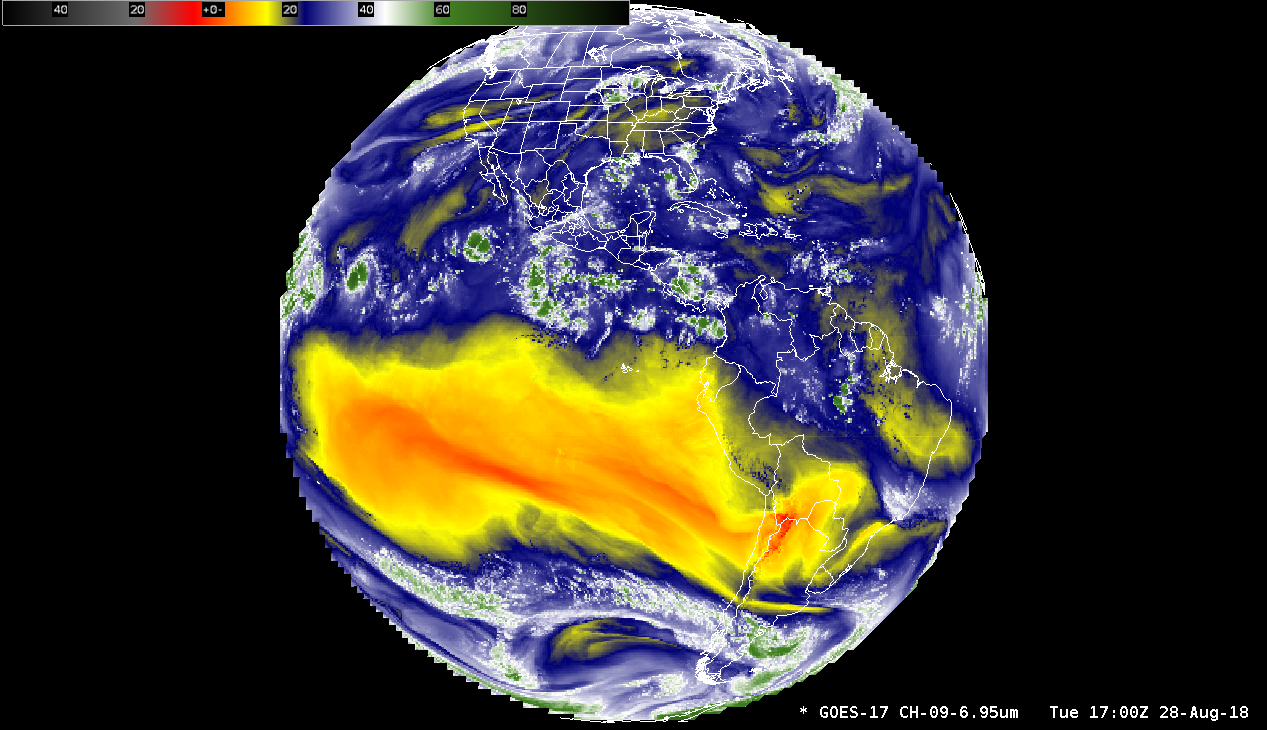
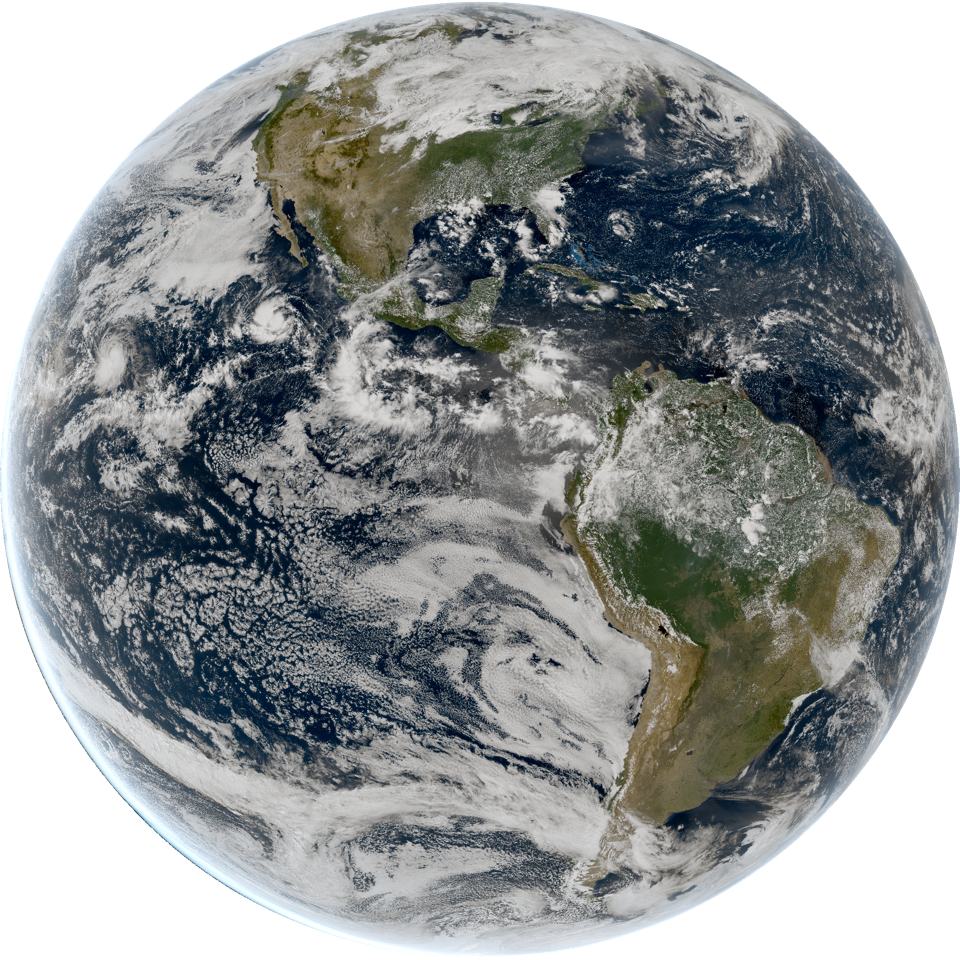
GOES-17 Mid-level Water Vapor (6.9 µm) imagery is shown below.
![GOES-17 Mid-level Water Vapor (6.9 µm) image [click to enlarge]](https://cimss.ssec.wisc.edu/satellite-blog/wp-content/uploads/sites/5/2018/08/180828_goes17_water_vapor_full_disk_anim.gif)
GOES-17 Mid-level Water Vapor (6.9 µm) image [click to enlarge]
A closer look using1-minute
Mesoscale Domain Sector GOES-17 “Red” Visible (
0.64 µm) and Shortwave Infrared (
3.9 µm) images
(below) showed ship tracks in the Pacific Ocean off the coast of Washington, Oregon and northern California. The ship tracks appear warmer in the 3.9 µm imagery because aerosols from the exhaust of ships cause a “cloud seeding effect”, which results in a higher concentration of
smaller cloud droplets compared to the surrounding unperturbed marine boundary layer clouds. These smaller cloud droplets are more effective reflectors of sunlight, resulting in a
warmer appearance
(darker orange to red enhancement) on Shortwave Infrared images.
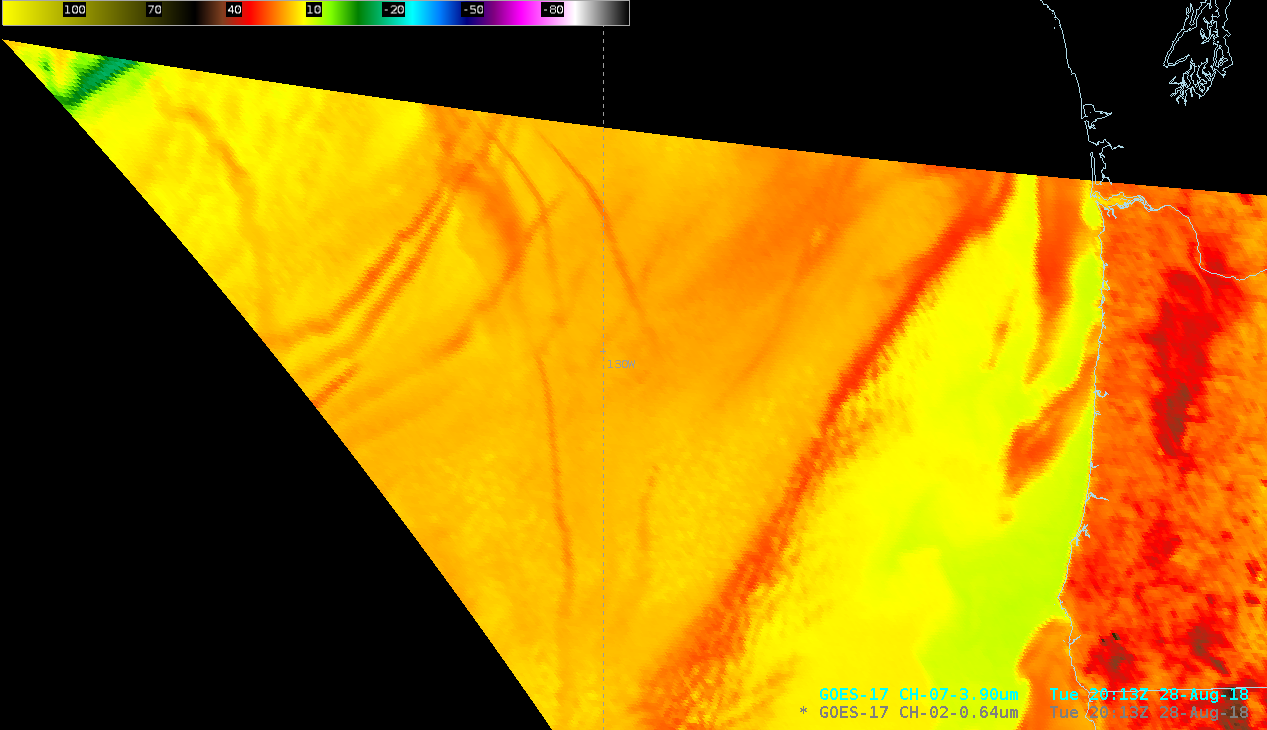
GOES-17 “Red” Visible (0.64 µm) and Shortwave Infrared (3.9 µm) images [click to play animation | MP4]
GOES-17 is currently positioned over the Equator at 89.5º West longitude during its checkout phase, but will eventually be moved to 137º West and become the operational GOES-West satellite later in 2018. The current coverage as viewed in the operational GOES-West perspective is shown below — Hawai’i and far southeastern Alaska appear in the limb of the satellite view.
![GOES-17 Mid-level Water Vapor image, viewed in the operational GOES-West perspective [click to enlarge]](https://cimss.ssec.wisc.edu/satellite-blog/wp-content/uploads/sites/5/2018/08/g17_fd_wv_west-20180828_170039.png)
GOES-17 Mid-level Water Vapor image, viewed in the operational GOES-West perspective [click to enlarge]
However, Full Disk images in AWIPS are not available at full resolution; to get the best view of Alaska, for example, one must use imagery processed by software such as McIDAS. On this particular day, the peaks of Denali and the Alaska Range extended above the low-level clouds, and could be seen on the extreme limb of GOES-17 “Red” Visible (
0.64 µm) imagery
(below).
GOES-17 “Red” Visible (0.64 µm) images, showing the peaks of Denali and the Alaska Range [click to play animation]
GOES-16
(GOES-East) is positioned at 75.2º West longitude — the western extent of its coverage is shown below. Hawai’i and Alaska (with the exception of the Alaska Panhandle) are not scanned by GOES-16.
![GOES-16 (GOES-East) Mid-level Water Vapor (6.9 µm) image [click to enlarge]](https://cimss.ssec.wisc.edu/satellite-blog/wp-content/uploads/sites/5/2018/08/g16_fd_wv_west-20180828_170036.png)
GOES-16 Mid-level Water Vapor image, viewed in the operational GOES-West perspective [click to enlarge]
View only this post
Read Less

![Terra MODIS Visible (0.65 µm) and Infrared Window (11.0 µm) images, with plots of SPC storm reports [click to enlarge]](https://cimss.ssec.wisc.edu/satellite-blog/wp-content/uploads/sites/5/2018/08/180828_1715utc_terra_modis_visible_infrared_WI_anim.gif)
![Aqua MODIS Visible (0.65 µm) and Infrared Window (11.0 µm) images, with plots of SPC storm reports [click to enlarge]](https://cimss.ssec.wisc.edu/satellite-blog/wp-content/uploads/sites/5/2018/08/180828_1855utc_aqua_modis_visible_infrared_WI_anim.gif)
![Suomi NPP VIIRS Visible (0.64 µm) and Infrared Window (11.45 µm) images, with plots of SPC storm reports [click to enlarge]](https://cimss.ssec.wisc.edu/satellite-blog/wp-content/uploads/sites/5/2018/08/180828_1945utc_suomi_npp_viirs_visible_infrared_WI_anim.gif)
![24-hour precipitation ending at 12 UTC on 28 August and 29 August [click to enlarge]](https://cimss.ssec.wisc.edu/satellite-blog/wp-content/uploads/sites/5/2018/08/180828_180829_24hour_precip_WI_anim.gif)


![Visible images from GOES-15 (0.63 µm, left), GOES-17 (0.64 µm, center) and GOES-16 (0.64 µm, right) [click to play animation | MP4]](https://cimss.ssec.wisc.edu/satellite-blog/wp-content/uploads/sites/5/2018/08/180826_goes15_goes17_goes16_visible_spc_storm_reports_SD_anim.gif)
