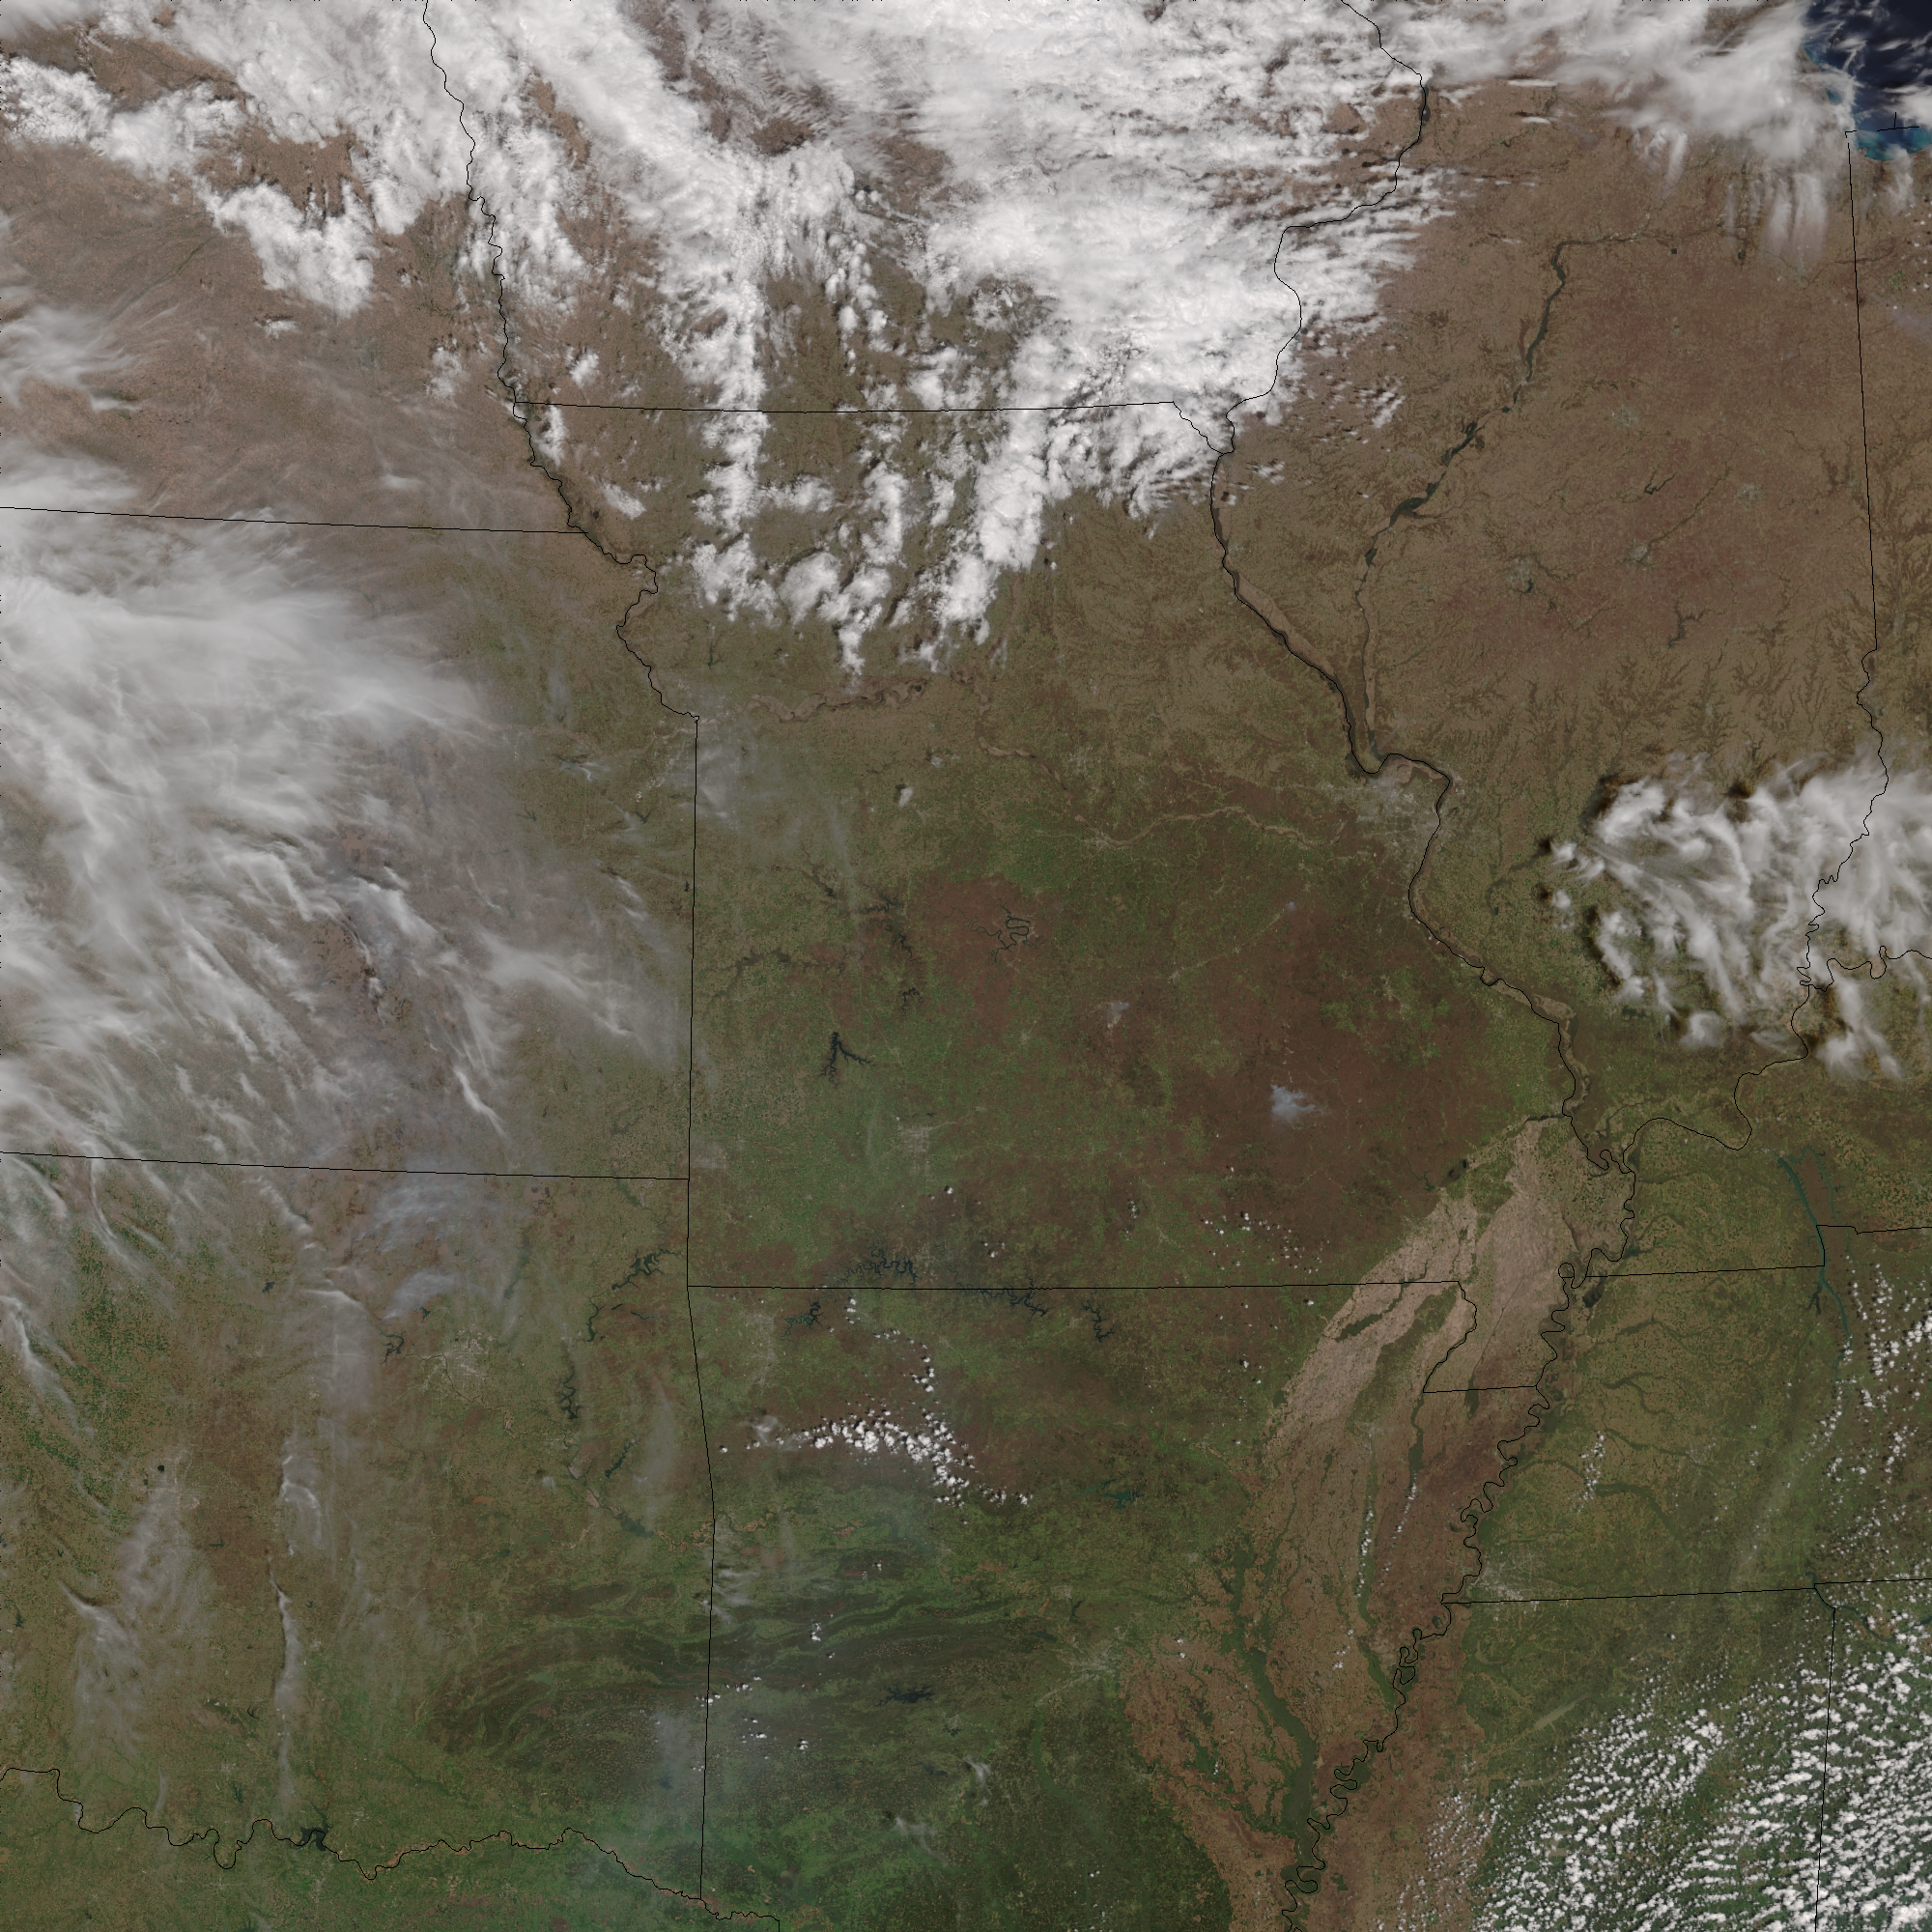
16-Panel GOES-17 Full-Disk Advanced Baseline Imager (ABI) Imagery, 0010 – 2340 UTC on 14 April 2019 (Click to play mp4 animation)
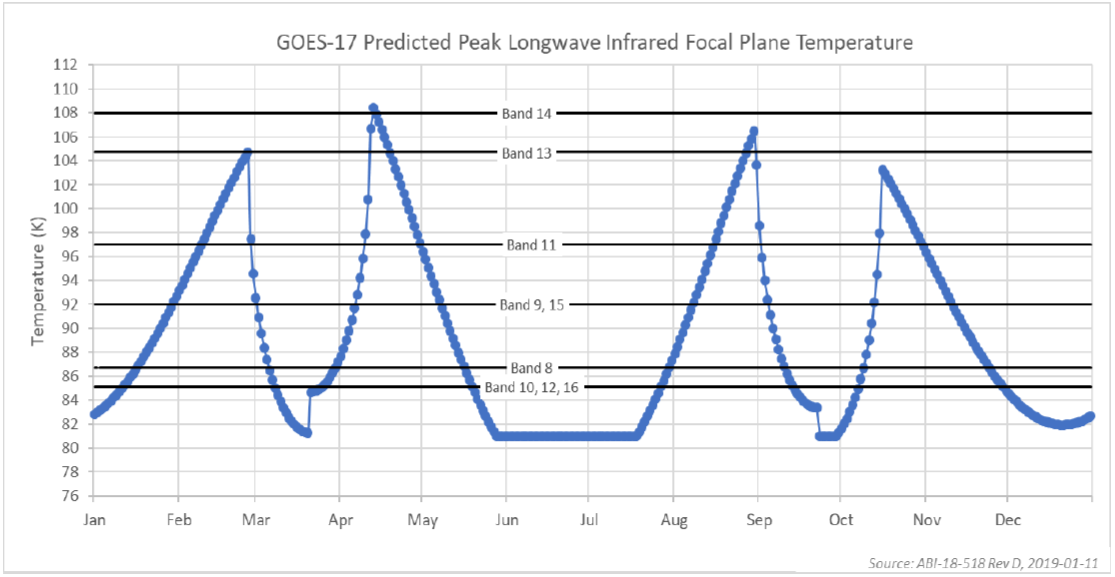
Solar illumination of the GOES-17 Advanced Baseline Imagery (ABI) was at a maximum on 14 April, so that the effects of the Loop Heat Pipe that is not operating at its designed capacity (and therefore cannot keep the ABI detectors as cold as preferred) were at their worst. (This image of the predicted Focal Plane Temperature from this blog post shows the mid-April peak to be warmest). The animation above shows that only Band 14 (11.2 µm) was able to send a useable signal during the entire night. The Band 14 data are biased, however. The image below compares GOES-16 and GOES-17 temperatures over a region on the Equator (here, from the GOES-17 perspective, and here, from the GOES-16 perspective, from this website) equidistant between the two sub-satellite points (75.2º W for GOES-East, 137.2º W for GOES-West). GOES-17 slowly cools relative to GOES-16 (assumed to be ‘truth’) before undergoing a series of cold/warm/cold oscillations relative to GOES-16. So while a useful signal is preserved, algorithms that rely on threshold temperatures, or brightness temperature difference fields (such as the 3.9 µm – 11.2 µm Brightness Temperature Difference), would likely produce unexpected results.

ABI Band 14 (11.2 µm) temperature differences, GOES-17 – GOES-16 on 14 April 2019 (Click to enlarge). Representative Band 14 images during a time largely unaffected by Loop Heat Pipe issues are shown at top.
Loop Heat Pipe issues should slowly subside over the coming weeks. ‘Predictive Calibration’ is likely to be in place by the time the (Northern Hemisphere) Autumnal Equinox arrives. This will extend the useful signal for the ABI channels. One might even conclude that this current episode will have the worst impact on useable imagery from the ABI.
View only this post Read Less
![GOES-16 "Clean" Infrared Window (10.3 µm) images, with SPC storm reports plotted in purple [click to play MP4 animation]](https://cimss.ssec.wisc.edu/satellite-blog/wp-content/uploads/sites/5/2019/04/G16_IR_NOGLM_TX_SVR_13APR2019_2019103_142824_GOES-16_0001PANEL.GIF)
![Terra MODIS Visible (0.65 µm) and Infrared Window (11.0 µm) images [click to enlarge]](https://cimss.ssec.wisc.edu/satellite-blog/wp-content/uploads/sites/5/2019/04/190413_1650uc_terra_modis_visible_infrared_spcStormReports_anim.gif)
![GOES-16 "Red" Visible (0.64 µm) images, with SPC storm reports plotted in red [click to play MP4 animation]](https://cimss.ssec.wisc.edu/satellite-blog/wp-content/uploads/sites/5/2019/04/G16_VIS_NOGLM_TX_LA_MS_SVR_13APR2019_2019103_211525_GOES-16_0001PANEL.GIF)
![GOES-16 "Clean" Infrared Window (10.3 µm) images, with SPC storm reports plotted in cyan [click to play MP4 animation]](https://cimss.ssec.wisc.edu/satellite-blog/wp-content/uploads/sites/5/2019/04/G16_IR_NOGLM_TX_LA_MS_SVR_13APR2019_2019103_211525_GOES-16_0001PANEL.GIF)
![GOES-16 "Clean" Infrared Window (10.3 µm) images, with SPC storm reports plotted in cyan [click to play MP4 animation]](https://cimss.ssec.wisc.edu/satellite-blog/wp-content/uploads/sites/5/2019/04/G16_IR_MS_AL_SVR_13APR2019_2019104_040755_GOES-16_0001PANEL.GIF)
![VIIRS Day/Night Band (0.7 µm) and Infrared Window (11.45 µm) images from Suomi NPP and NOAA-20 [click to enlarge]](https://cimss.ssec.wisc.edu/satellite-blog/wp-content/uploads/sites/5/2019/04/190414_0645utc_0734utc_viirs_dayNightBand_infraredWindow_spcStormReports_anim.gif)
![NOAA-20 VIIRS Day/Night Band (0.7 µm) image at 0825 UTC [click to enlarge]](https://cimss.ssec.wisc.edu/satellite-blog/wp-content/uploads/sites/5/2019/04/al_viirs_dnb_post_saturation_recovery-20190414_082514.png)
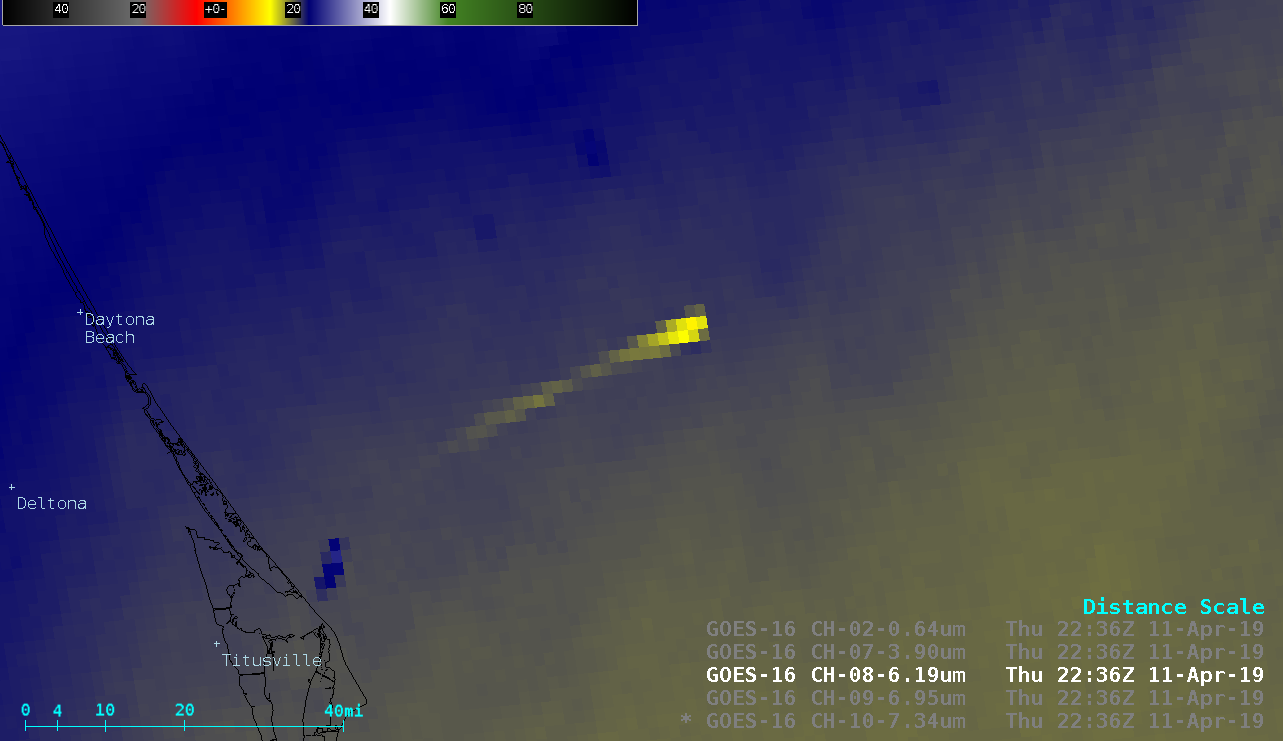
![GOES-16 Low-level Water Vapor (7.3 µm), Mid-levell Water Vapor (6.9 µm), Upper-level Water Vapor (6.2 µm), Shortwave Infrared (3.9 µm) images at 2236 UTC [click to enlarge]](https://cimss.ssec.wisc.edu/satellite-blog/wp-content/uploads/sites/5/2019/04/190411_2236utc_goes16_waterVapor_shortwaveInfrared_visible_SpaceX_rocket_thermal_condensationPlume_signatures_anim.gif)
![GOES-16 "Red" Visible (0.64 µm) images [click to enlarge]](https://cimss.ssec.wisc.edu/satellite-blog/wp-content/uploads/sites/5/2019/04/190411_goes16_visible_SpaceX_rocket_plume_signatures_anim.gif)
![Plot of 00 UTC rawinsonde data from Cape Canaveral, Florida [click to enlarge]](https://cimss.ssec.wisc.edu/satellite-blog/wp-content/uploads/sites/5/2019/04/190412_00utc_kxmr_raob.png)


