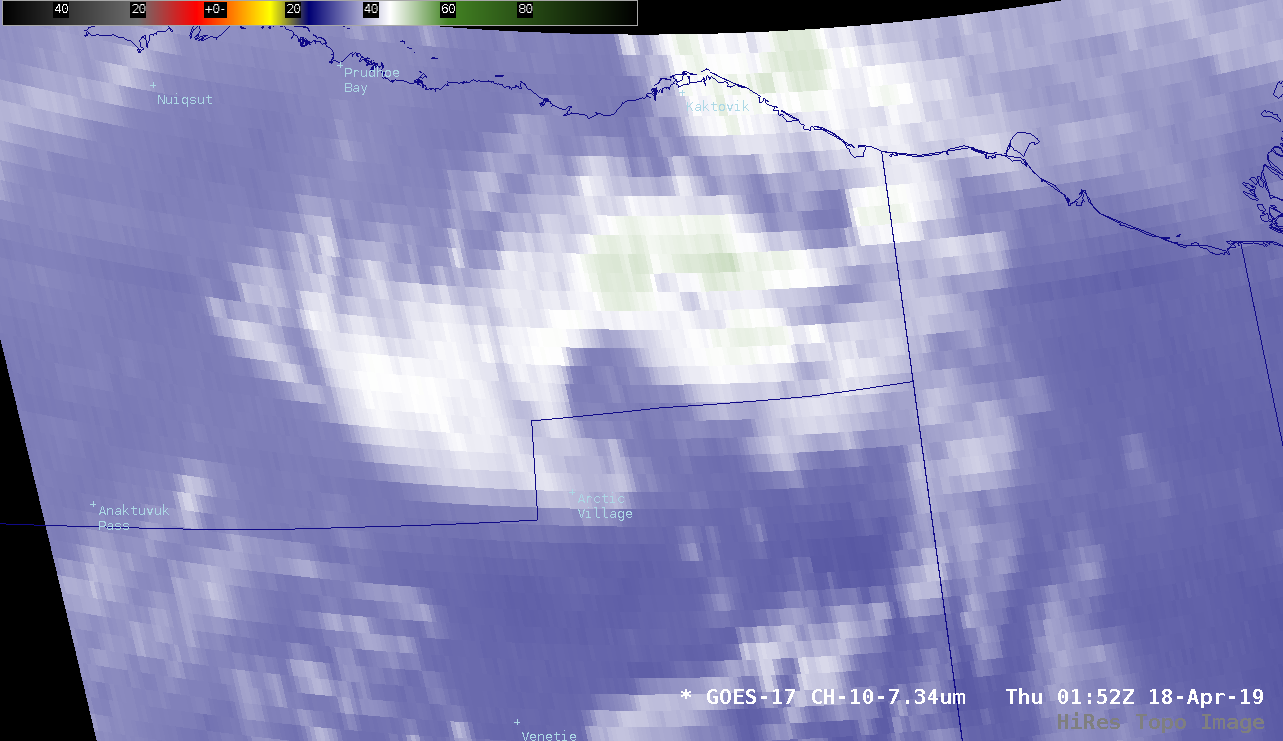
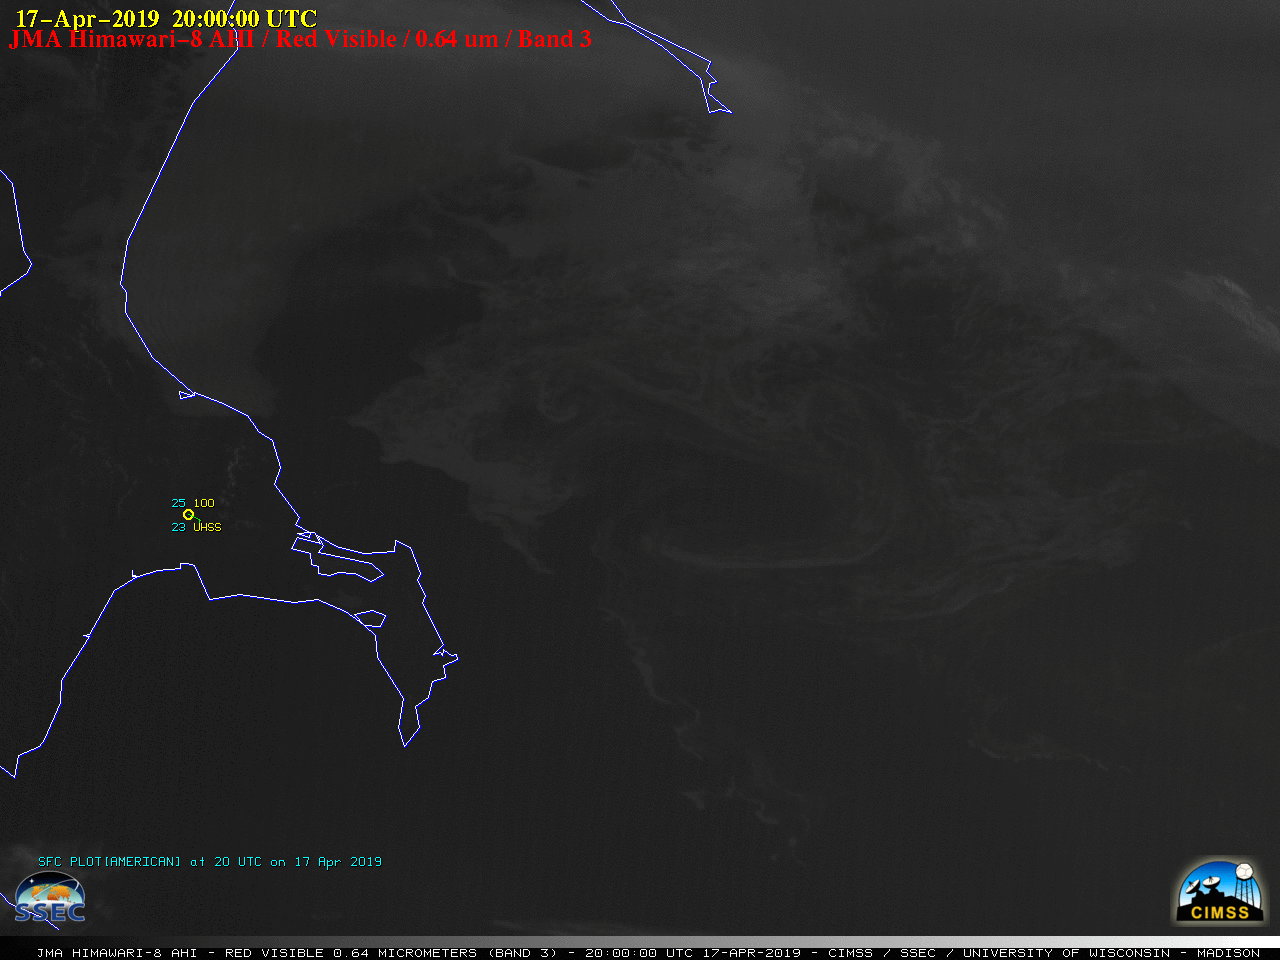
1-minute Mesoscale Domain Sector GOES-17 (GOES-West) “Red” Visible (0.64 µm) and Low-level Water Vapor (7.3 µm) images (above) showed a mesoscale disturbance that was moving northward over the eastern Brooks Range in far northeastern Alaska on 17 April 2019. The curved configuration of the associated cloud structure suggested that a closed circulation center was... Read More

GOES-17 “Red” Visible (0.64 µm) and Low-level Water Vapor (7.3 µm) images [click to play animation | MP4]
1-minute
Mesoscale Domain Sector GOES-17
(GOES-West) “Red” Visible (
0.64 µm) and Low-level Water Vapor (
7.3 µm) images
(above) showed a mesoscale disturbance that was moving northward over the eastern Brooks Range in far northeastern Alaska on 17 April 2019. The curved configuration of the associated cloud structure suggested that a closed circulation center was present (or had just recently developed) — while
surface analyses showed an area of low pressure much farther to the south along the Alaska/Yukon border, there were no features moving northward across the region shown in the GOES-17 imagery.
Light to moderate snow was reported at Arctic Village as this mesoscale disturbance moved over the area (below).
![Time series of surface weather observation data from Arctic Village [click to enlarge]](https://cimss.ssec.wisc.edu/satellite-blog/wp-content/uploads/sites/5/2019/04/190417_PARC_SFCMG.GIF)
Time series of surface weather observations from Arctic Village [click to enlarge]
375-meter resolution Suomi NPP VIIRS Day/Night Band (0.7 µm) and Infrared Window (11.45 µm) images at 2131 and 2313 UTC
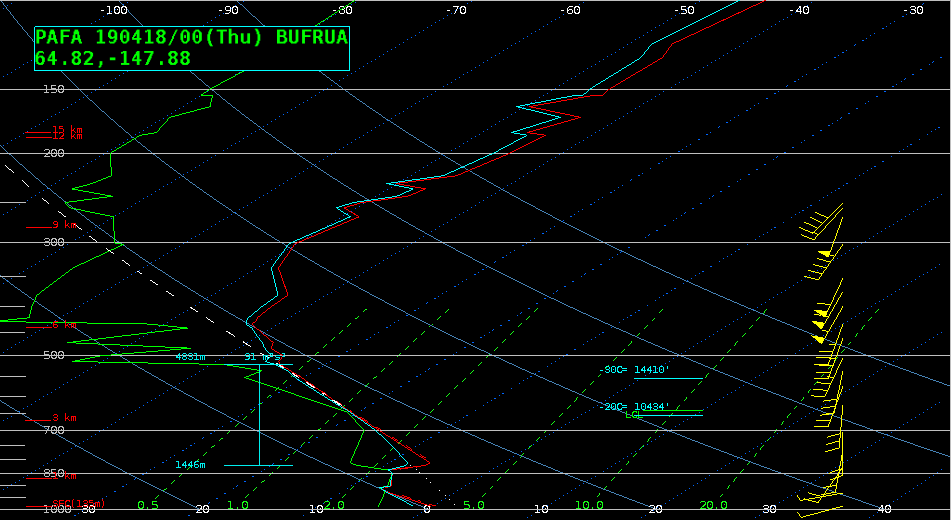
(below) provided a more detailed view of this feature, in which the clouds exhibited an appearance suggestive of embedded convection. Cloud-top infrared brightness temperatures were as cold as -50ºC just southwest of Arctic Village on the 2313 UTC image — this corresponded to an altitude of 8.5 km on the
00 UTC Fairbanks rawinsonde data.
![Suomi NPP VIIRS Day/Night Band (0.7 µm) images at 2131 and 2313 UTC [click to enlarge]](https://cimss.ssec.wisc.edu/satellite-blog/wp-content/uploads/sites/5/2019/04/190417_suomiNPP_viirs_dayNightBand_AK_anim.gif)
Suomi NPP VIIRS Day/Night Band (0.7 µm) images at 2131 and 2313 UTC [click to enlarge]
![Suomi NPP VIIRS Infrared Window (11.45 µm) images at 2131 and 2313 UTC [click to enlarge]](https://cimss.ssec.wisc.edu/satellite-blog/wp-content/uploads/sites/5/2019/04/190417_suomiNPP_viirs_infraredWindow_AK_anim.gif)
Suomi NPP VIIRS Infrared Window (11.45 µm) images at 2131 and 2313 UTC [click to enlarge]
model fields
(below) showed no clear signature of either a closed circulation or a discrete vorticity center — so satellite imagery was depicting the presence of an important feature that was not captured by numerical models. While the 18 UTC model run did show an area of light precipitation moving northward toward the region, the 00 UTC model run scaled back the areal coverage of this precipitation.
![3-km NAM 500 hPa height, wind and absolute vorticity [click to enlarge]](https://cimss.ssec.wisc.edu/satellite-blog/wp-content/uploads/sites/5/2019/04/190417_nam-hires_500hPa_vorticity_height_AK_anim.gif)
3-km NAM 500 hPa height, wind and absolute vorticity [click to enlarge]
![3-km NAM Mean Sea Level Pressure and 1-hour accumulated precipitation [click to enlarge]](https://cimss.ssec.wisc.edu/satellite-blog/wp-content/uploads/sites/5/2019/04/190417_nam-hires_1hour_precipitation_AK_anim.gif)
3-km NAM Mean Sea Level Pressure and 1-hour accumulated precipitation [click to enlarge]
View only this post
Read Less
![GOES-16 True Color RGB images [click to play animation | MP4]](https://cimss.ssec.wisc.edu/satellite-blog/wp-content/uploads/sites/5/2019/04/190418_goes16_truecolorRGB_Gulf_of_Mexico_anim.gif)
![GOES-16 Shortwave Infrared (3.9 µm) images [click to play animation | MP4]](https://cimss.ssec.wisc.edu/satellite-blog/wp-content/uploads/sites/5/2019/04/190418_goes16_shortwaveInfrared_Mexico_Central_America_fires_anim.gif)
![Fires detected by Suomi NPP VIIRS on 17 April [click to enlarge]](https://cimss.ssec.wisc.edu/satellite-blog/wp-content/uploads/sites/5/2019/04/190417_suomiNPP_viirs_fire_detections.png)
![Himawari-8 "Red" Visible (0.64 µm, left) and Near-Infrared "Snow/Ice" (1.61 µm, right) images [click to play animation | MP4]](https://cimss.ssec.wisc.edu/satellite-blog/wp-content/uploads/sites/5/2019/04/190418_himawari8_visible_snowIce_Sea_of_Okhotsk_ice_anim.gif)

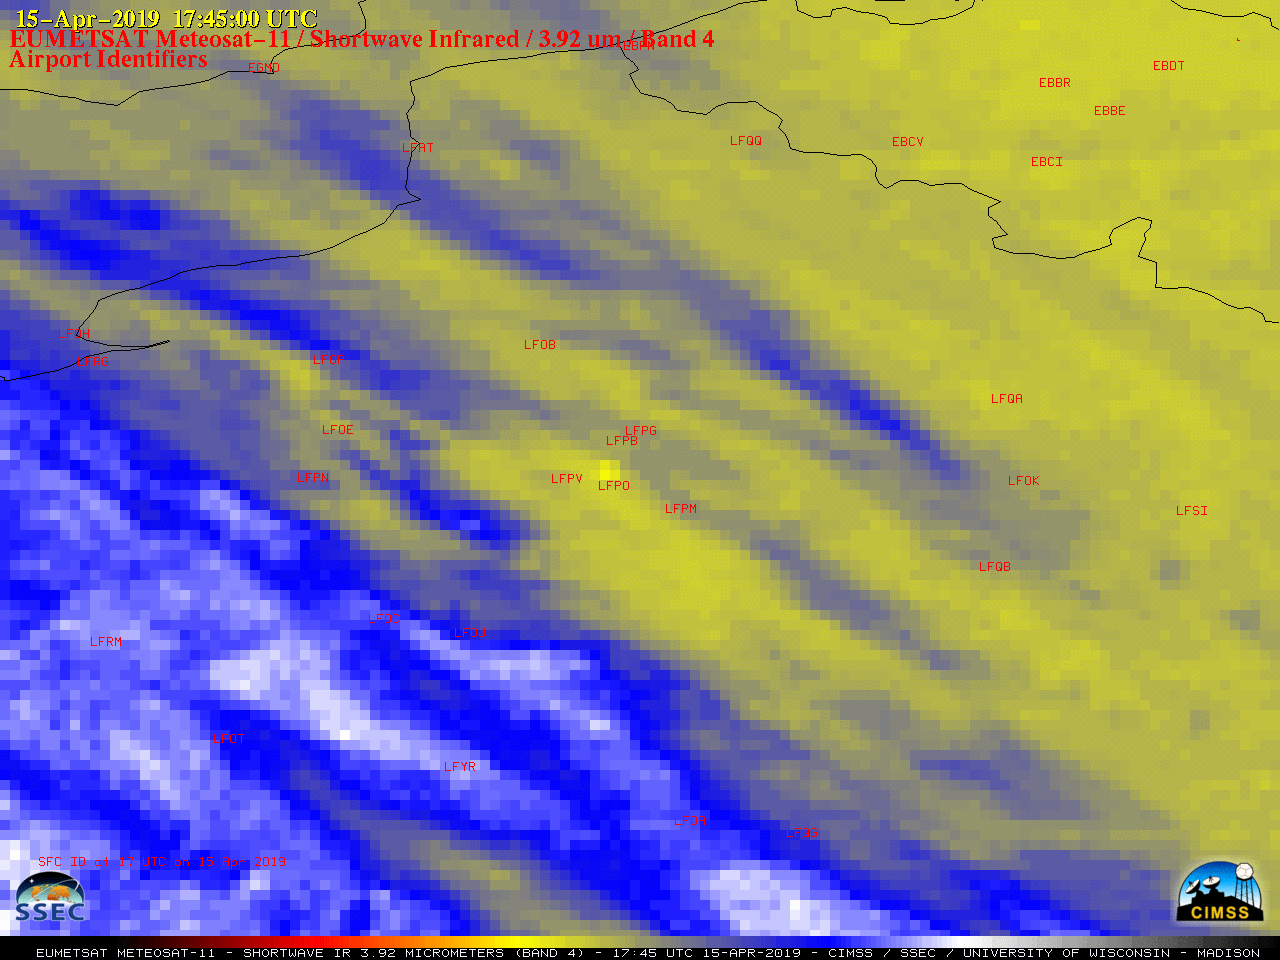
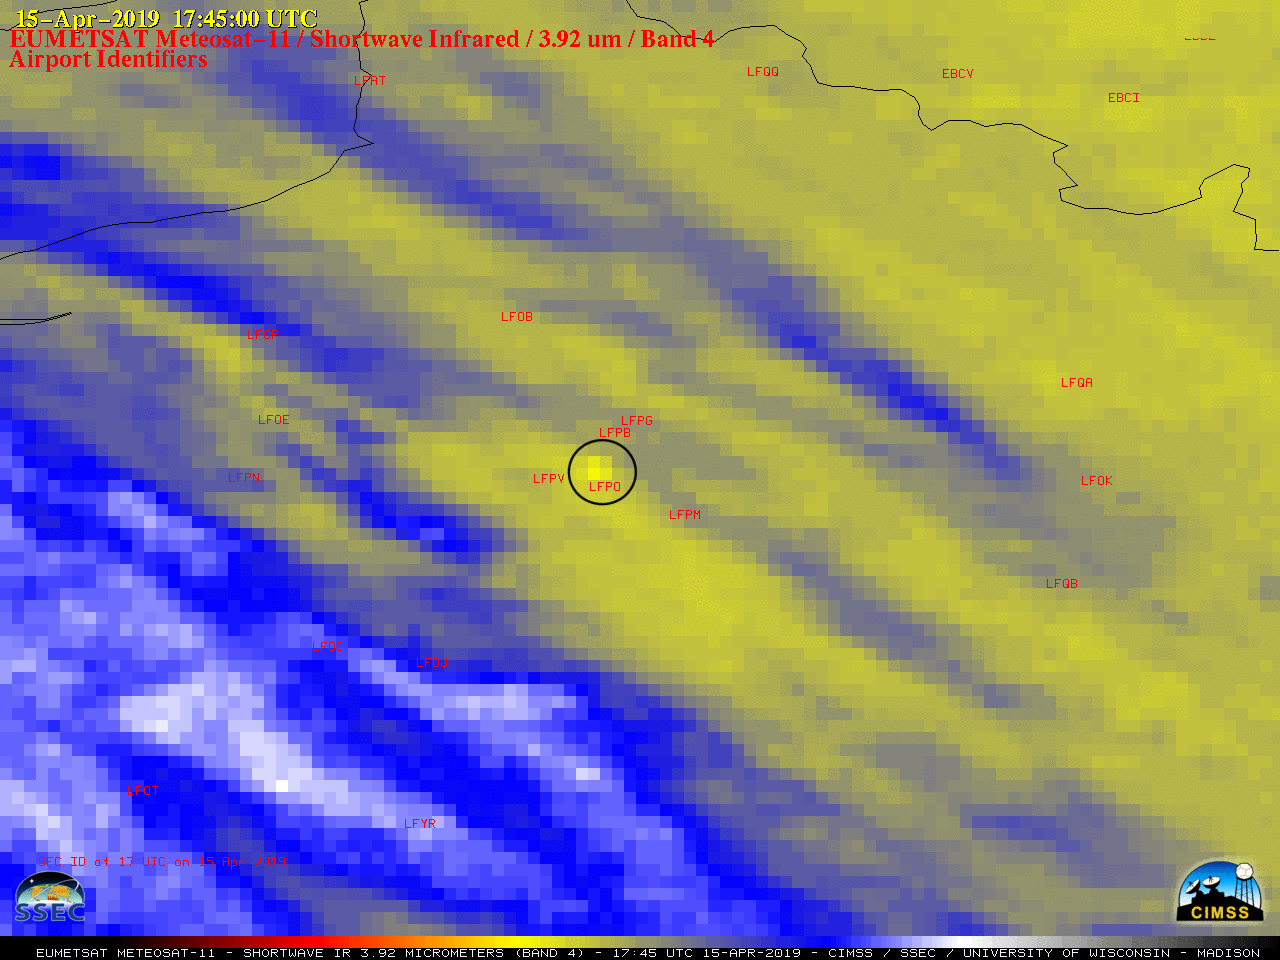
![EUMETSAT Meteosat-11 Shortwave Infrared (3.92 µm) images, with airport identifiers plotted in red [click to play animation | MP4]](https://cimss.ssec.wisc.edu/satellite-blog/wp-content/uploads/sites/5/2019/04/190415_meteosat11_shortwaveInfrared_Notre_Dame_Fire_anim.gif)
![Metop-A and Metop-C Shortwave Infrared (3.74 µm) images at 2009 and 2048 UTC [click to enlarge]](https://cimss.ssec.wisc.edu/satellite-blog/wp-content/uploads/sites/5/2019/04/190415_metop_shortwaveInfrared_Notre_Dame_Fire_anim.gif)
