
An animation that cycles through GOES-17 (GOES-West) “Red” Visible (0.64 µm), “Clean” Infrared Window (10.35 µm) and Upper-level Water Vapor (6.2 µm) images (above) showed Tropical Depression Flossie just northeast of Hawai’i on 05 August 2019. Note that (1) the exposed low-level circulation center (LLCC) was very apparent in the visible imagery, (2)... Read More
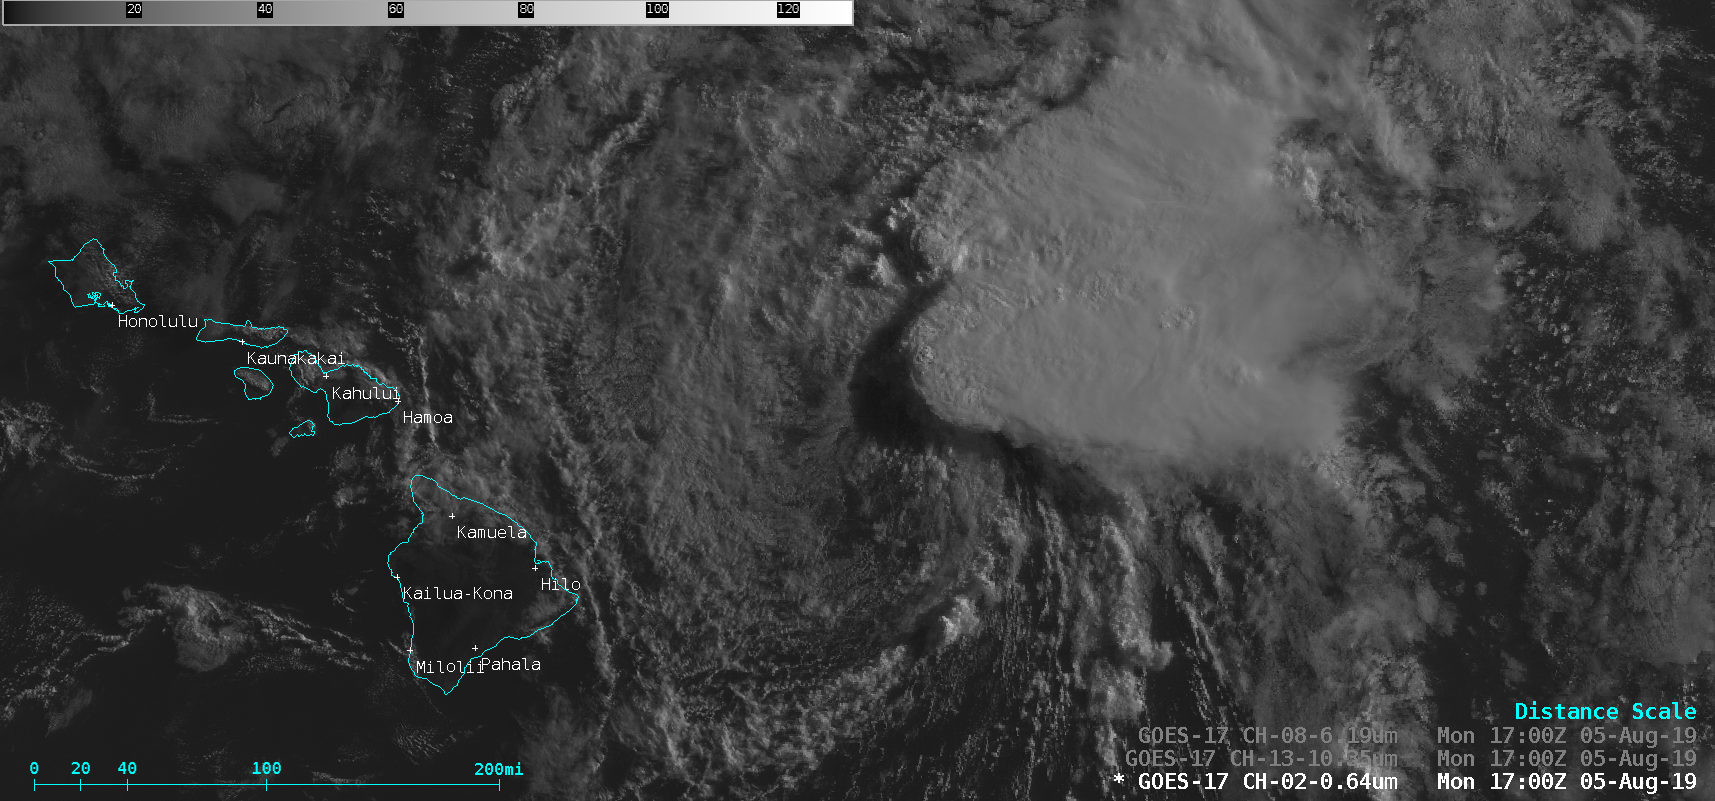
GOES-17 “Red” Visible (0.64 µm), “Clean” Infrared Window (10.35 µm) and Upper-level Water Vapor (6.2 µm) images [click to play animation | MP4]
An animation that cycles through GOES-17
(GOES-West) “Red” Visible (
0.64 µm), “Clean” Infrared Window (
10.35 µm) and Upper-level Water Vapor (
6.2 µm) images
(above) showed Tropical Depression
Flossie just northeast of Hawai’i on 05 August 2019. Note that (1) the exposed low-level circulation center (LLCC) was very apparent in the visible imagery, (2) deep convection offset to the east/northeast of the LLCC exhibited cloud-top infrared brightness temperatures as cold as -83ºC , and (3) a series of gravity waves were propagating westward away from the convection, moving toward Hawai’i.
GOES-15 Infrared imagery and deep-layer wind shear data from the CIMSS Tropical Cyclones site (below) showed that the tropical cyclone was in an environment of strong shear, which was responsible for the displacement between the exposed LLCC and the convection. In addition to the wind shear, the weakening trend of the system was also due to its motion over cold Sea Surface Temperatures and low Ocean Heat Content.
![GOES-15 Infrared Window (10.7 µm) images, with contours and streamlines of deep-layer wind shear [click to enlarge]](https://cimss.ssec.wisc.edu/satellite-blog/wp-content/uploads/sites/5/2019/08/190805_goes15_infrared_deepLayerShear_TD_Flossie_anim.gif)
GOES-15 Infrared Window (10.7 µm) images, with contours and streamlines of deep-layer wind shear at 18 UTC [click to enlarge]
View only this post
Read Less
![Visible images from GOES-17, GOES-15, GOES-14 and GOES-16, with SPC Storm Reports plotted in red [click to play animation | MP4]](https://cimss.ssec.wisc.edu/satellite-blog/wp-content/uploads/sites/5/2019/08/190803_goes17_goes15_goes14_goes16_visible_spcStormReports_ND_SD_anim.gif)
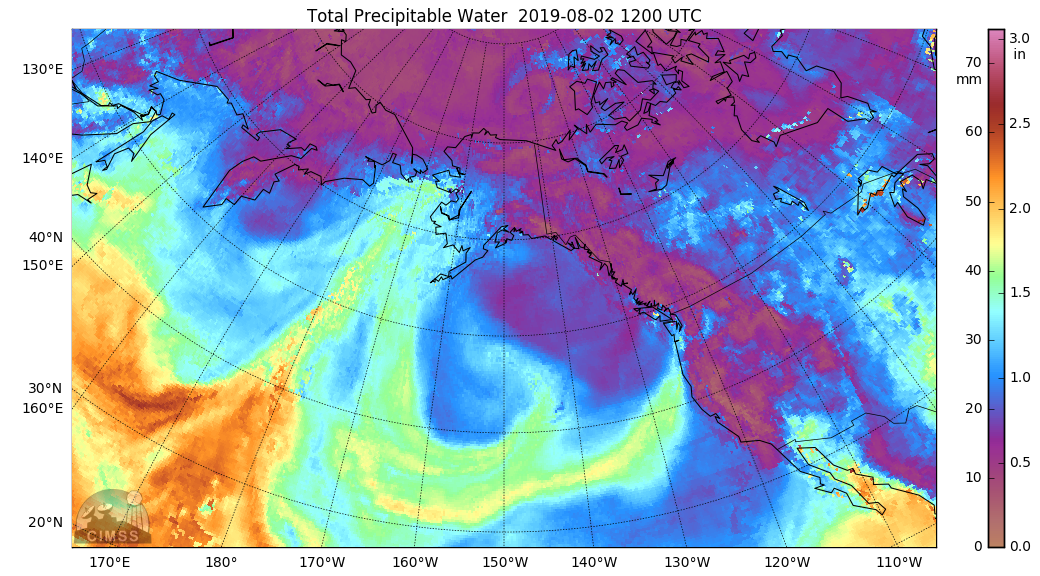
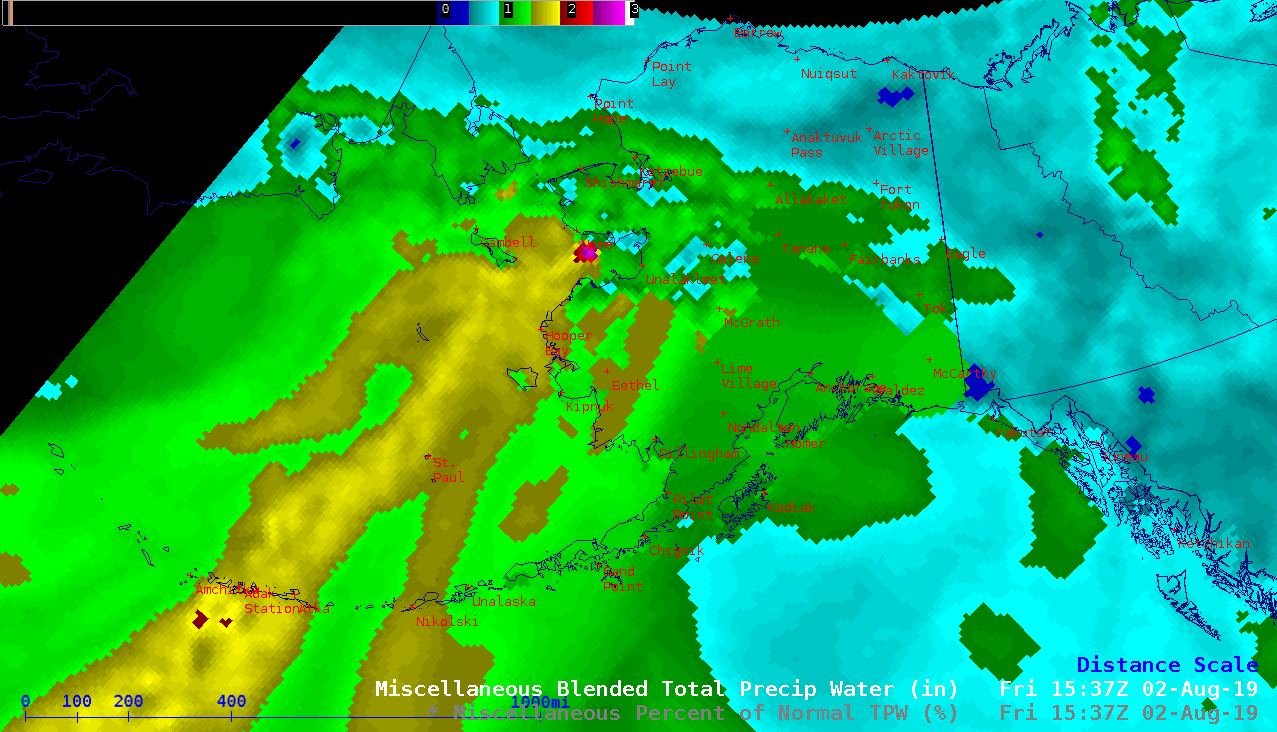
![MIMIC Total Precipitable Water product [click to play animation | MP4]](https://cimss.ssec.wisc.edu/satellite-blog/wp-content/uploads/sites/5/2019/08/190801_190803_mimicTPW_AK_anim.gif)
![Blended Total Precipitable Water and Percent of Normal [click to play animation | MP4]](https://cimss.ssec.wisc.edu/satellite-blog/wp-content/uploads/sites/5/2019/08/190731_190803_blendedTPW_percentNormalTPW_AK_anim.gif)
![Time series of surface data from Nome, Alaska [click to enlarge]](https://cimss.ssec.wisc.edu/satellite-blog/wp-content/uploads/sites/5/2019/08/190802_190803_PAOM_SFCMG.GIF)
![Plot of rawinsonde data from Nome at 12 UTC on 02 August [click to enlarge]](https://cimss.ssec.wisc.edu/satellite-blog/wp-content/uploads/sites/5/2019/08/190802_12UTC_PAOM_RAOB.GIF)
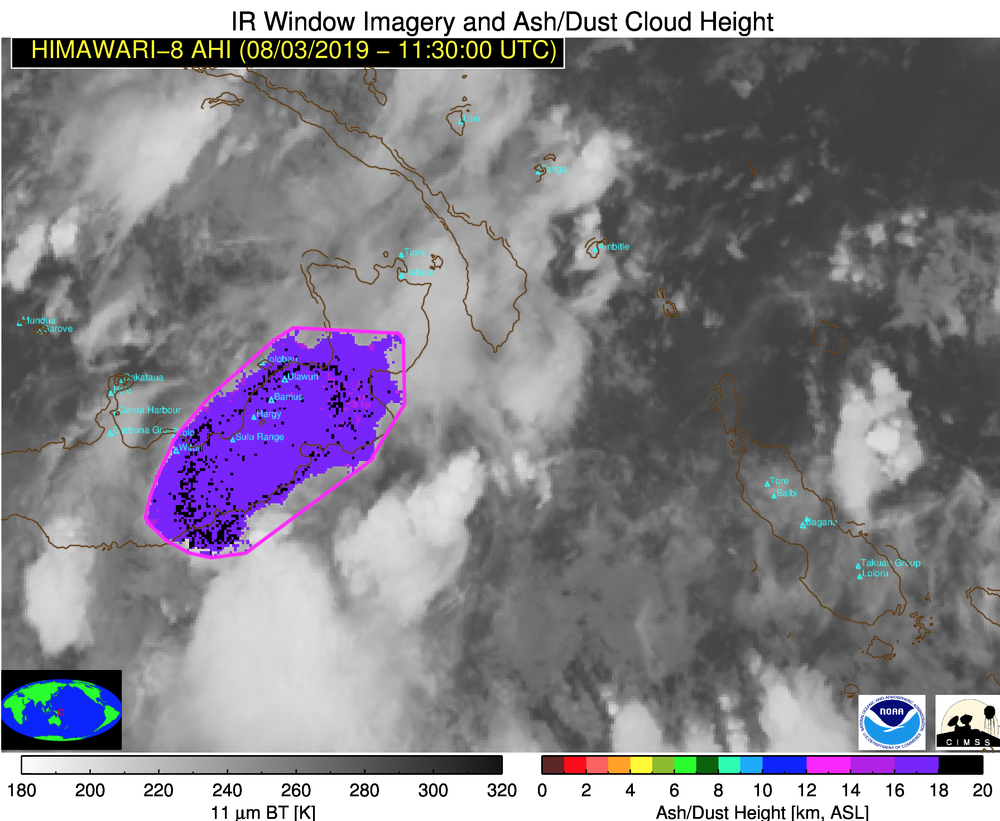
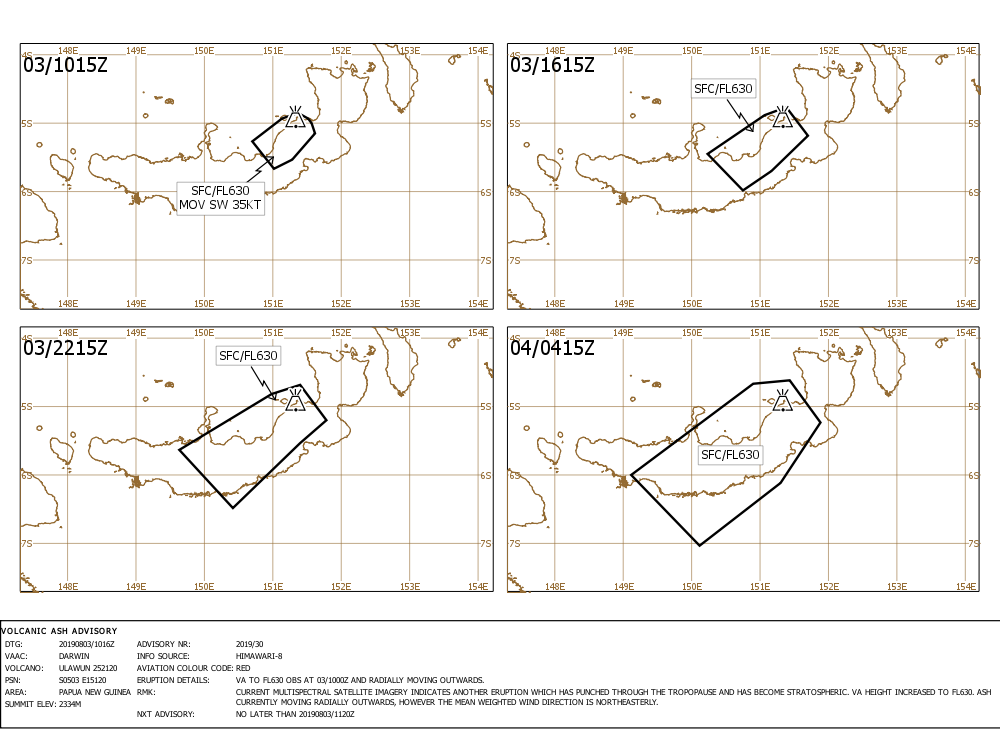
![Volcanic ash height [click to play animation | MP4]](https://cimss.ssec.wisc.edu/satellite-blog/wp-content/uploads/sites/5/2019/08/190803_himawari8_Ulawun_ash_height_anim.gif)
![Volcanic ash loading [click to play animation | MP4]](https://cimss.ssec.wisc.edu/satellite-blog/wp-content/uploads/sites/5/2019/08/190803_himawari8_Ulawun_ash_loading_anim.gif)
![Volcanic ash effective radius [click to play animation | MP4]](https://cimss.ssec.wisc.edu/satellite-blog/wp-content/uploads/sites/5/2019/08/190803_himawari8_Ulawun_ash_radius_anim.gif)
