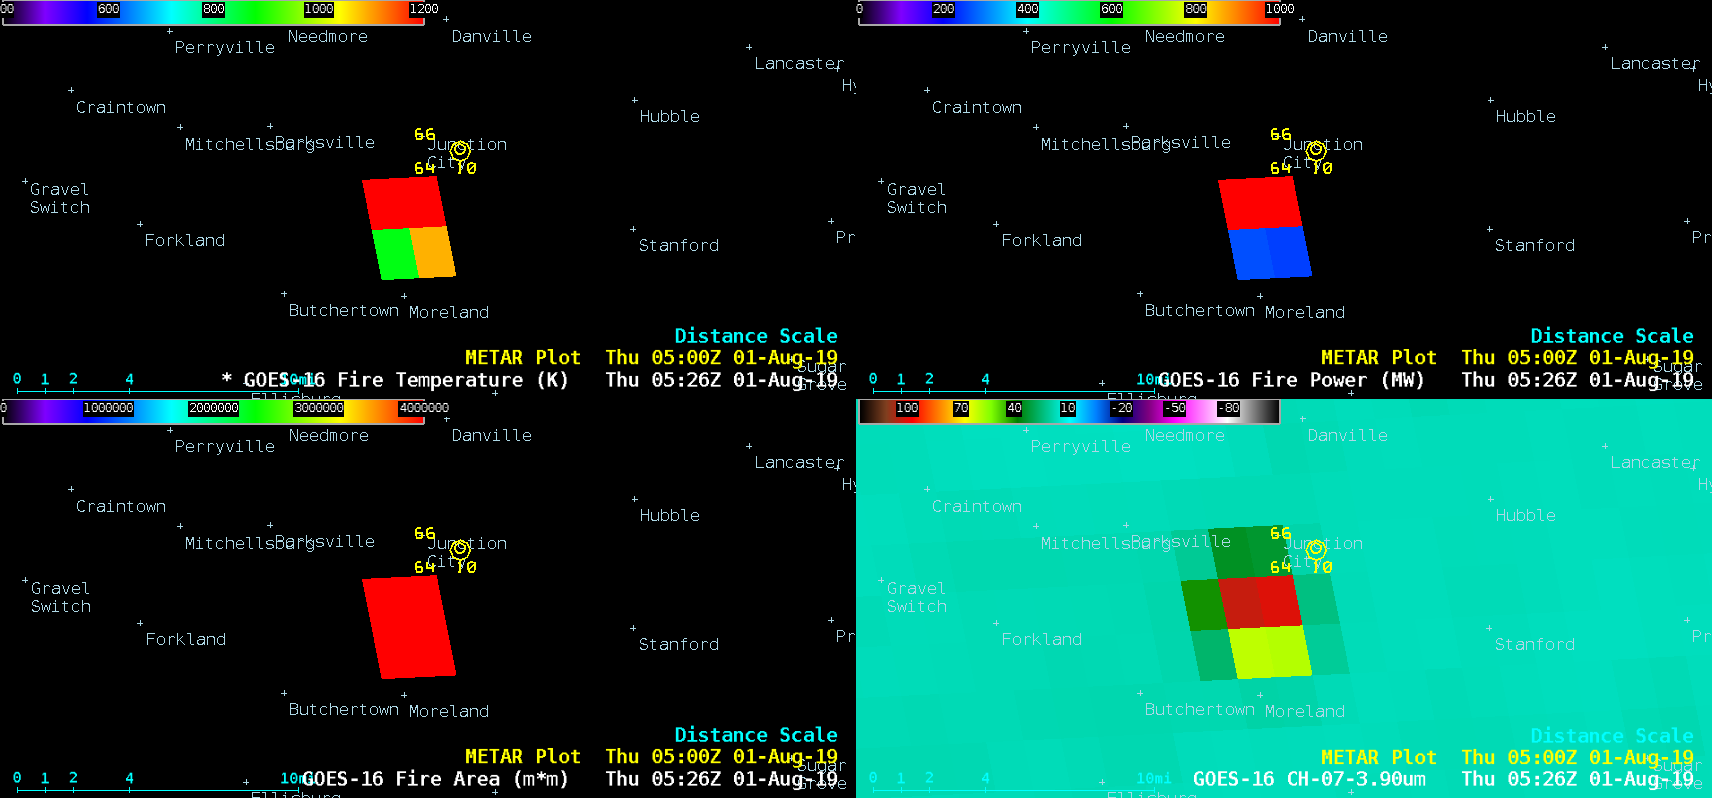
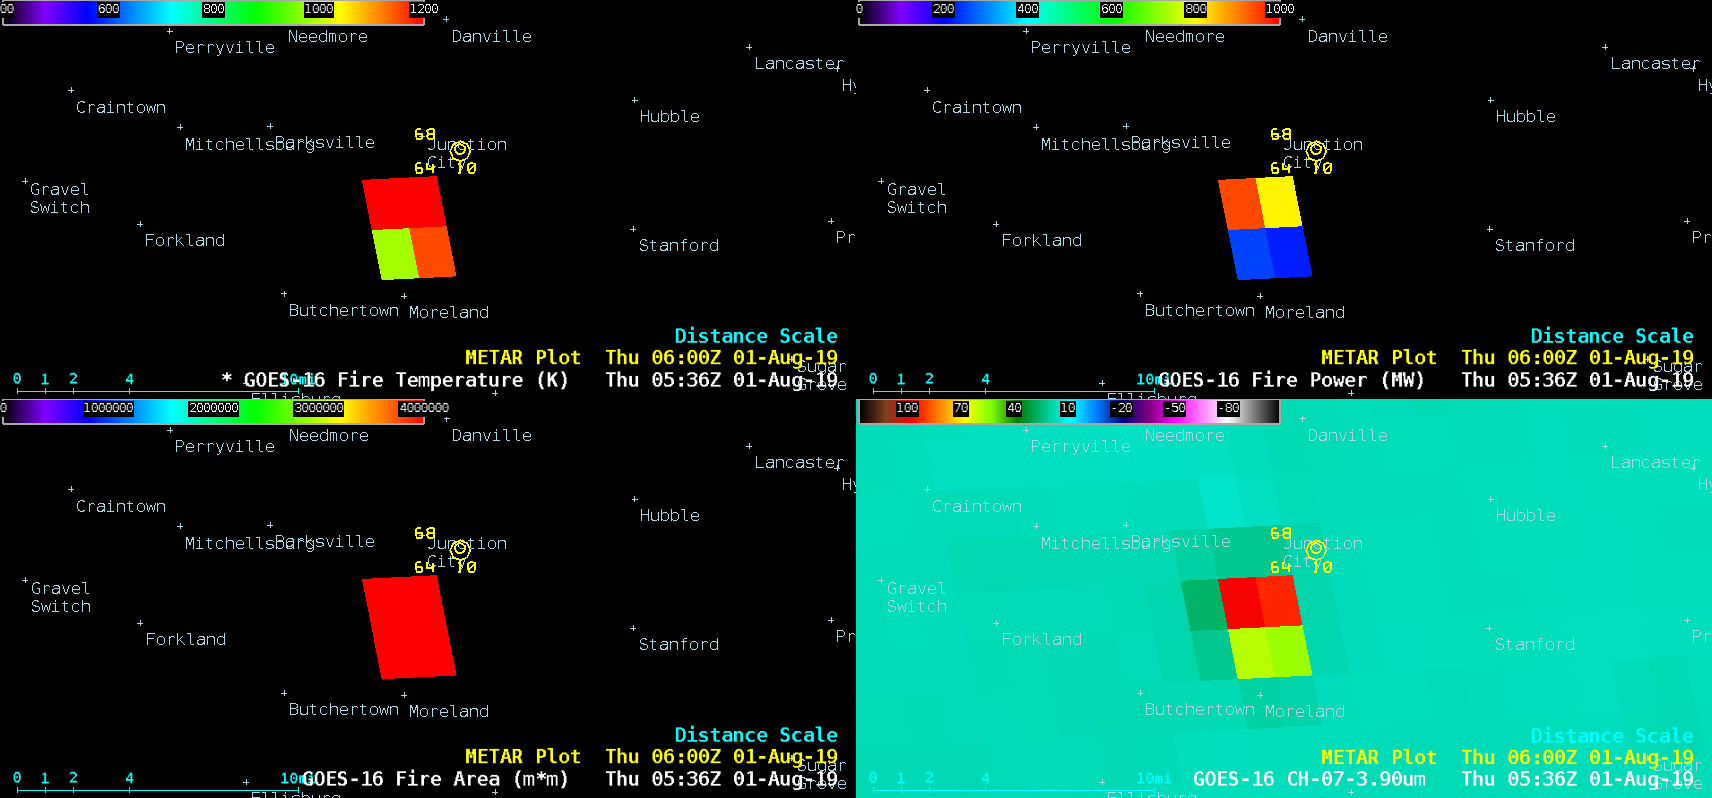
An explosion and fire along a natural gas pipeline occurred between Junction City and Moreland in central Kentucky on 01 August 2019 (media story 1 | media story 2). GOES-16 (GOES-East) Fire Temperature, Fire Power, Fire Area and Shortwave Infrared (3.9 µm) images (above) showed the thermal signature of the fire — the Fire Temperature... Read More
![GOES-16 Fire Temperature (top left), Fire Power (top right), Fire Area (bottom left) and Shortwave Infrared (3.9 µm, bottom right) [click to play animation | MP4]](https://cimss.ssec.wisc.edu/satellite-blog/wp-content/uploads/sites/5/2019/08/ky_fire-20190801_052645.png)
GOES-16 Fire Temperature (top left), Fire Power (top right), Fire Area (bottom left) and Shortwave Infrared (3.9 µm, bottom right) [click to play animation | MP4]
An explosion and fire along a natural gas pipeline occurred between Junction City and Moreland in central Kentucky on 01 August 2019 (
media story 1 |
media story 2). GOES-16
(GOES-East) Fire Temperature
, Fire Power
, Fire Area and Shortwave Infrared (
3.9 µm) images
(above) showed the thermal signature of the fire — the Fire Temperature peak of 2438.8 K occurred at
0536 UTC, with the maximum Fire Power of 1102.8 MW and the highest 3.9 µm brightness temperature of 103.6ºC occurring at
0526 UTC. More information on these GOES Fire Detection and Characterization Algorithm (FDCA) products can be found
here.
In a corresponding comparison of GOES-16 “Red” Visible (0.64 µm), Near-Infrared “Snow/Ice” (1.61 µm), Near-Infrared “Cloud Particle Size” (2.24 µm) and Shortwave Infrared (3.9 µm) images (below), thermal signatures were also seen in the Near-Infrared imagery — and a dim signature of this nighttime fire was even apparent in the Visible imagery! The surface observations from Danville Stuart Powell Field Airport are plotted in yellow; the winds were light, minimizing smoke dispersion — but note that the visibility briefly dropped from 10 miles to 7 miles at 07 UTC (possibly due to some smoke drifting over the airport).
![GOES-16 "Red" Visible (0.64 µm, top left), Near-Infrared "Snow/Ice" (1.61 µm, top right), Near-Infrared "Cloud Particle Size" (2.24 µm, bottom left) and Shortwave Infrared (3.9 µm, bottom right) [click to play animation | MP4]](https://cimss.ssec.wisc.edu/satellite-blog/wp-content/uploads/sites/5/2019/08/ky_4panel-20190801_052645.png)
GOES-16 “Red” Visible (0.64 µm, top left), Near-Infrared “Snow/Ice” (1.61 µm, top right), Near-Infrared “Cloud Particle Size” (2.24 µm, bottom left) and Shortwave Infrared (3.9 µm, bottom right) [click to play animation | MP4]
In a comparison of the 4-panel image sets at 0526 UTC
(below), the higher spatial resolution of the 0.64 µm
(0.5 km*) and 1.61 µm
(1 km*) images helped to refine the actual location of the fire. [*at satellite sub-point]
![GOES-16 4-panel images at 0526 UTC [click to enlarge]](https://cimss.ssec.wisc.edu/satellite-blog/wp-content/uploads/sites/5/2019/08/190801_0526utc_goes16_KY_4panels_anim.gif)
GOES-16 4-panel images at 0526 UTC [click to enlarge]
With the higher spatial resolution of Suomi NPP VIIRS and Aqua MODIS Shortwave Infrared imagery, the size and location of the fire’s thermal signature was more accurate when compared to GOES-16
(below). For example, even during the later stage of the fire at 0737 UTC, the VIIRS Shortwave Infrared brightness temperature was 32.0ºC, compared to only 17.9ºC with GOES-16.
![Suomi NPP VIIRS Shortwave Infrared (3.74 µm, top left), GOES-16 Shortwave Infrared (3.9 µm, top right), Aqua MODIS Shortwave Infrared (3.7 µm, bottom left) and GOES-16 Shortwave Infrared (3.9 µm, bottom right) images [click to enlarge]](https://cimss.ssec.wisc.edu/satellite-blog/wp-content/uploads/sites/5/2019/08/ky_viirs_modis_vs_goes_swir-20190801_065125.png)
Suomi NPP VIIRS Shortwave Infrared (3.74 µm, top left), GOES-16 Shortwave Infrared (3.9 µm, top right), Aqua MODIS Shortwave Infrared (3.7 µm, bottom left) and GOES-16 Shortwave Infrared (3.9 µm, bottom right) images [click to enlarge]
The bright glow of the fire was also evident in a Suomi NPP VIIRS Day/Night Band (0.7 µm) image at 0651 UTC
(below).
![Suomi NPP VIIRS Day/Night Band (0.7 µm) and Shortwave Infrared (3.74 µm) images [click to enlarge]](https://cimss.ssec.wisc.edu/satellite-blog/wp-content/uploads/sites/5/2019/08/190801_0651utc_suomiNPP_viirs_dayNightBand_shortwaveInfrared_KY_fire_anim.gif)
Suomi NPP VIIRS Day/Night Band (0.7 µm) and Shortwave Infrared (3.74 µm) images, with city names and highways [click to enlarge]
A thermal signature of the fire
(darker red to black pixels) was also seen in GOES-14 Shortwave Infrared (3.9 µm) images
(below).
![GOES-14 Shortwave Infrared (3.9 µm) images [click to enlarge]](https://cimss.ssec.wisc.edu/satellite-blog/wp-content/uploads/sites/5/2019/08/190801_goes14_shortwaveInfrared_KY_fire_v2_anim.gif)
GOES-14 Shortwave Infrared (3.9 µm) images [click to enlarge]
View only this post
Read Less
![GOES-16 Fire Temperature (top left), Fire Power (top right), Fire Area (bottom left) and Shortwave Infrared (3.9 µm, bottom right) [click to play animation | MP4]](https://cimss.ssec.wisc.edu/satellite-blog/wp-content/uploads/sites/5/2019/08/190801_goes16_fireTemperature_firePower_fireArea_shortwaveInfrared_KY_fire_anim.gif)
![GOES-16 "Red" Visible (0.64 µm, top left), Near-Infrared "Snow/Ice" (1.61 µm, top right), Near-Infrared "Cloud Particle Size" (2.24 µm, bottom left) and Shortwave Infrared (3.9 µm, bottom right) [click to play animation | MP4]](https://cimss.ssec.wisc.edu/satellite-blog/wp-content/uploads/sites/5/2019/08/190801_goes16_visible_nearInfrared_shortwaveInfrared_KY_fire_anim.gif)
![GOES-14 Visible (0.63 µm) images [click to enlarge]](https://cimss.ssec.wisc.edu/satellite-blog/wp-content/uploads/sites/5/2019/07/190731_goes14_visible_FullDisk_anim.gif)
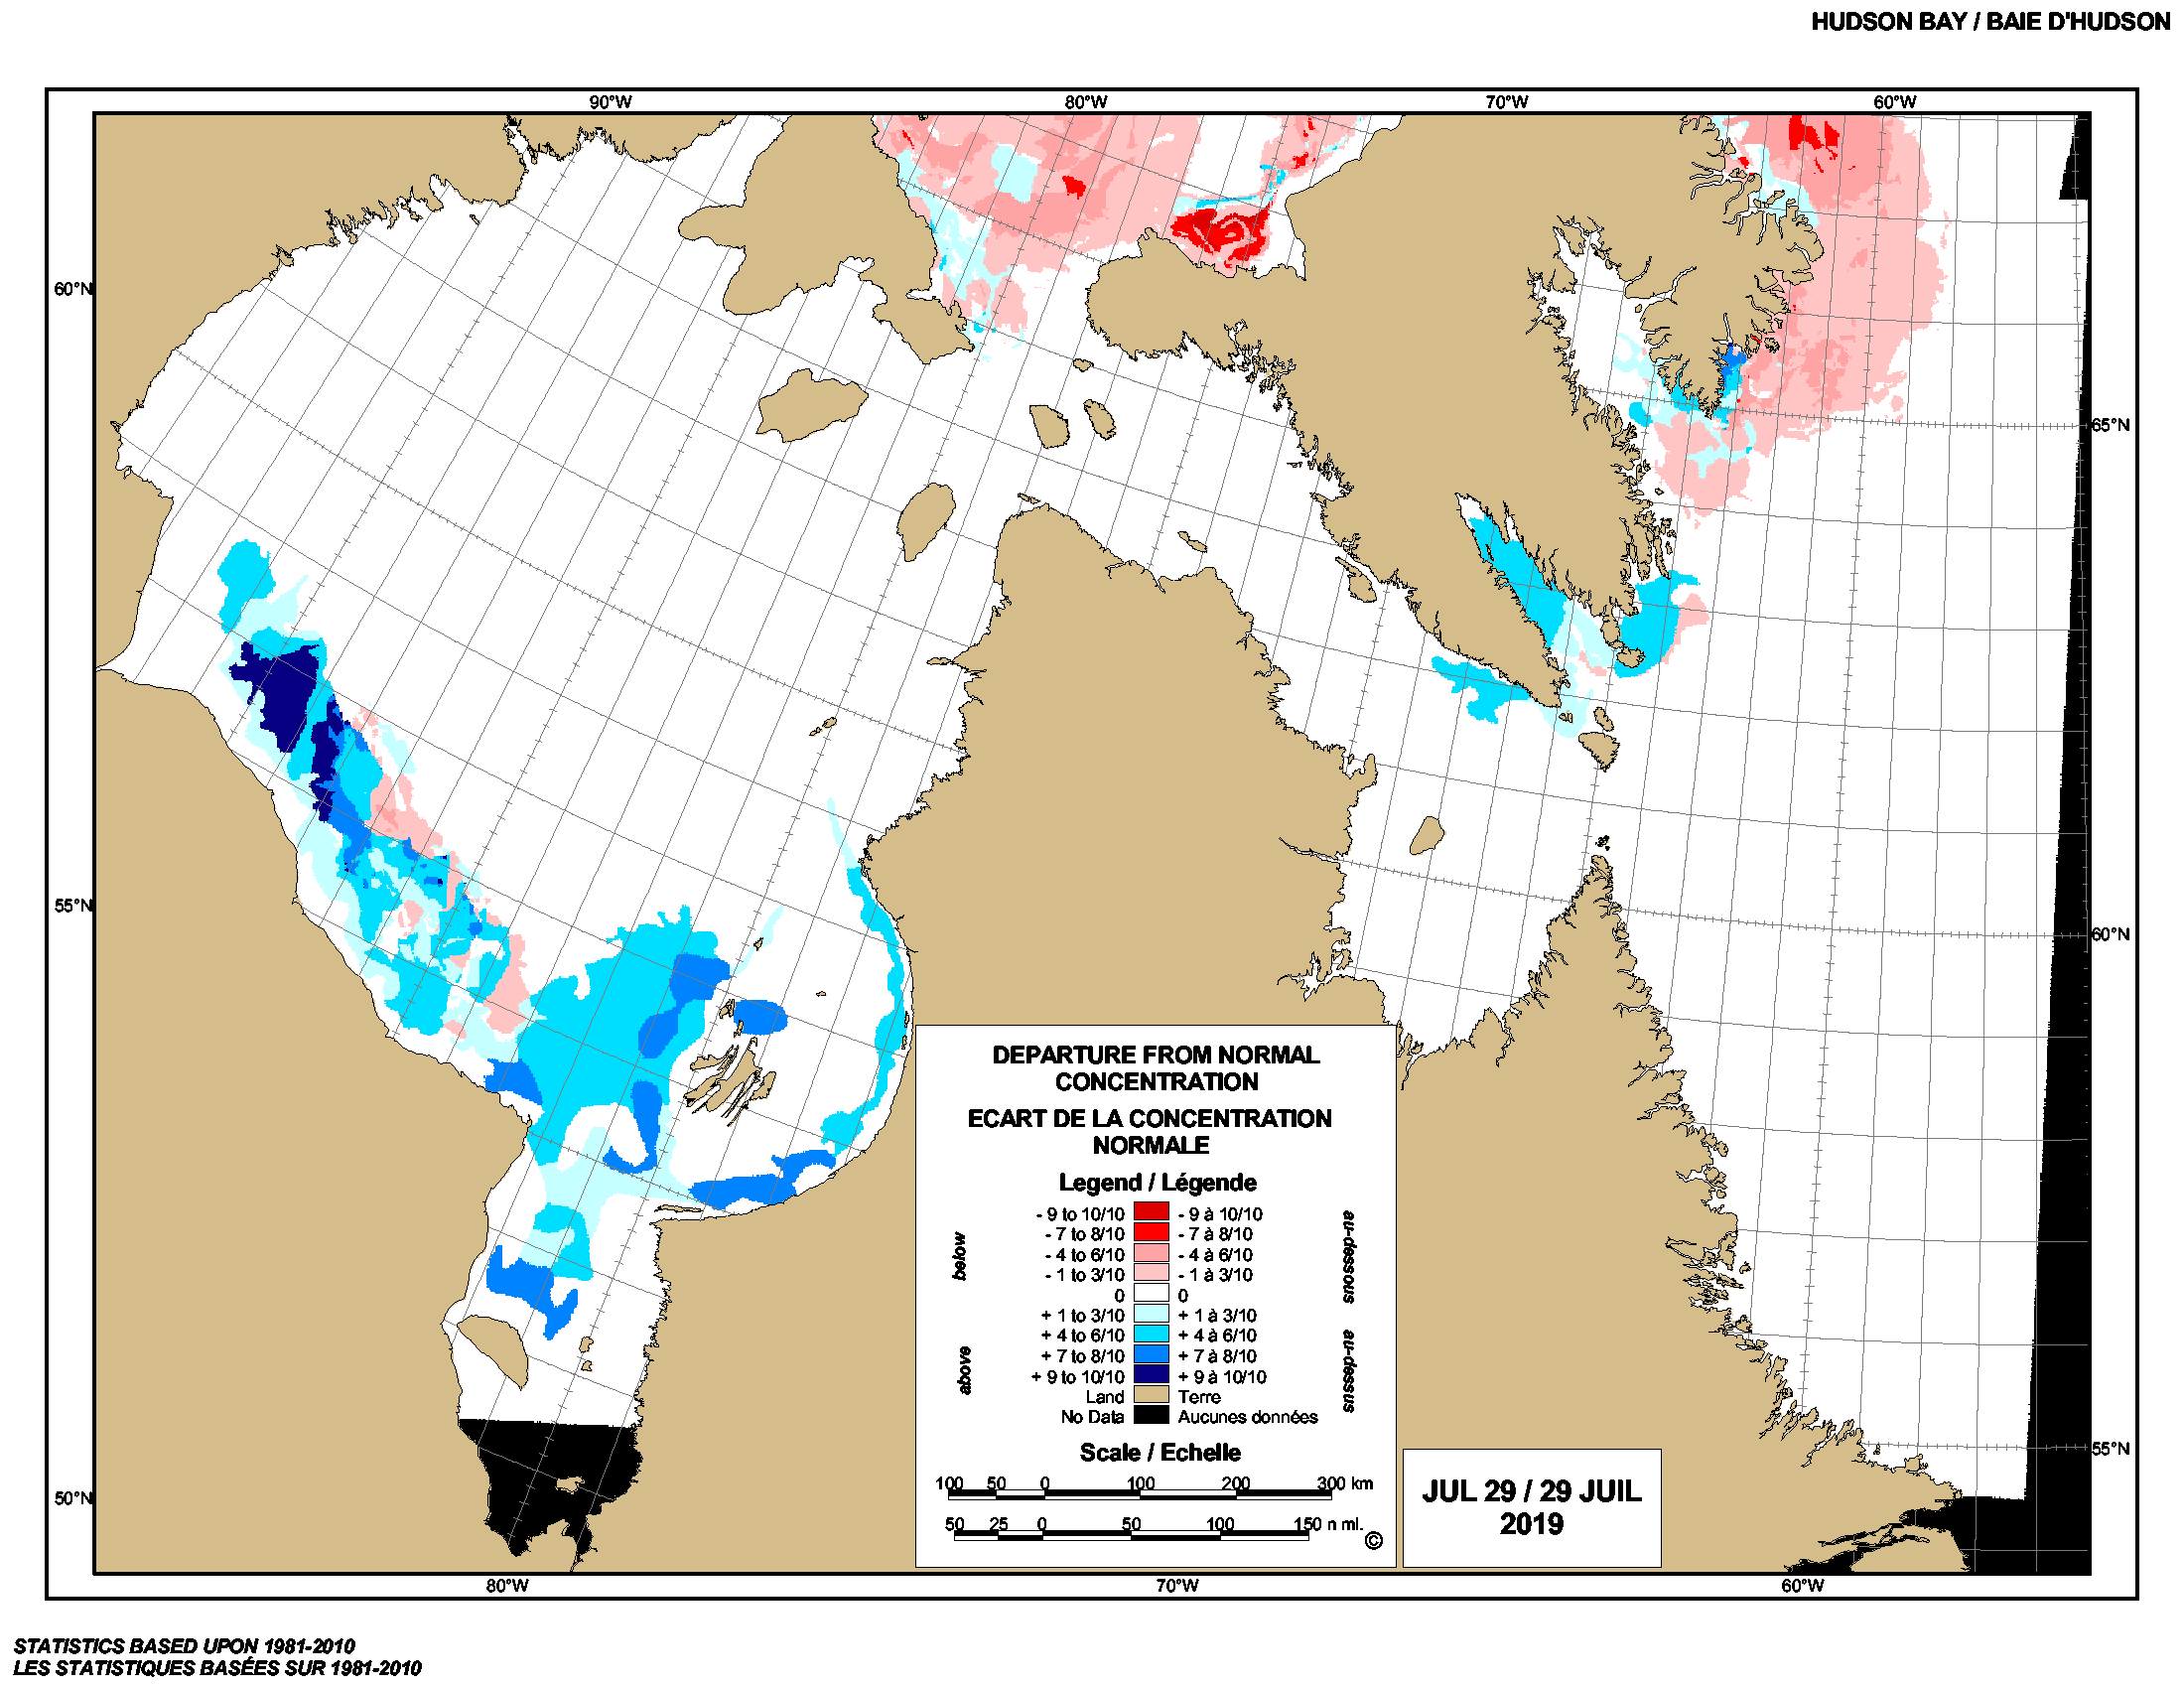
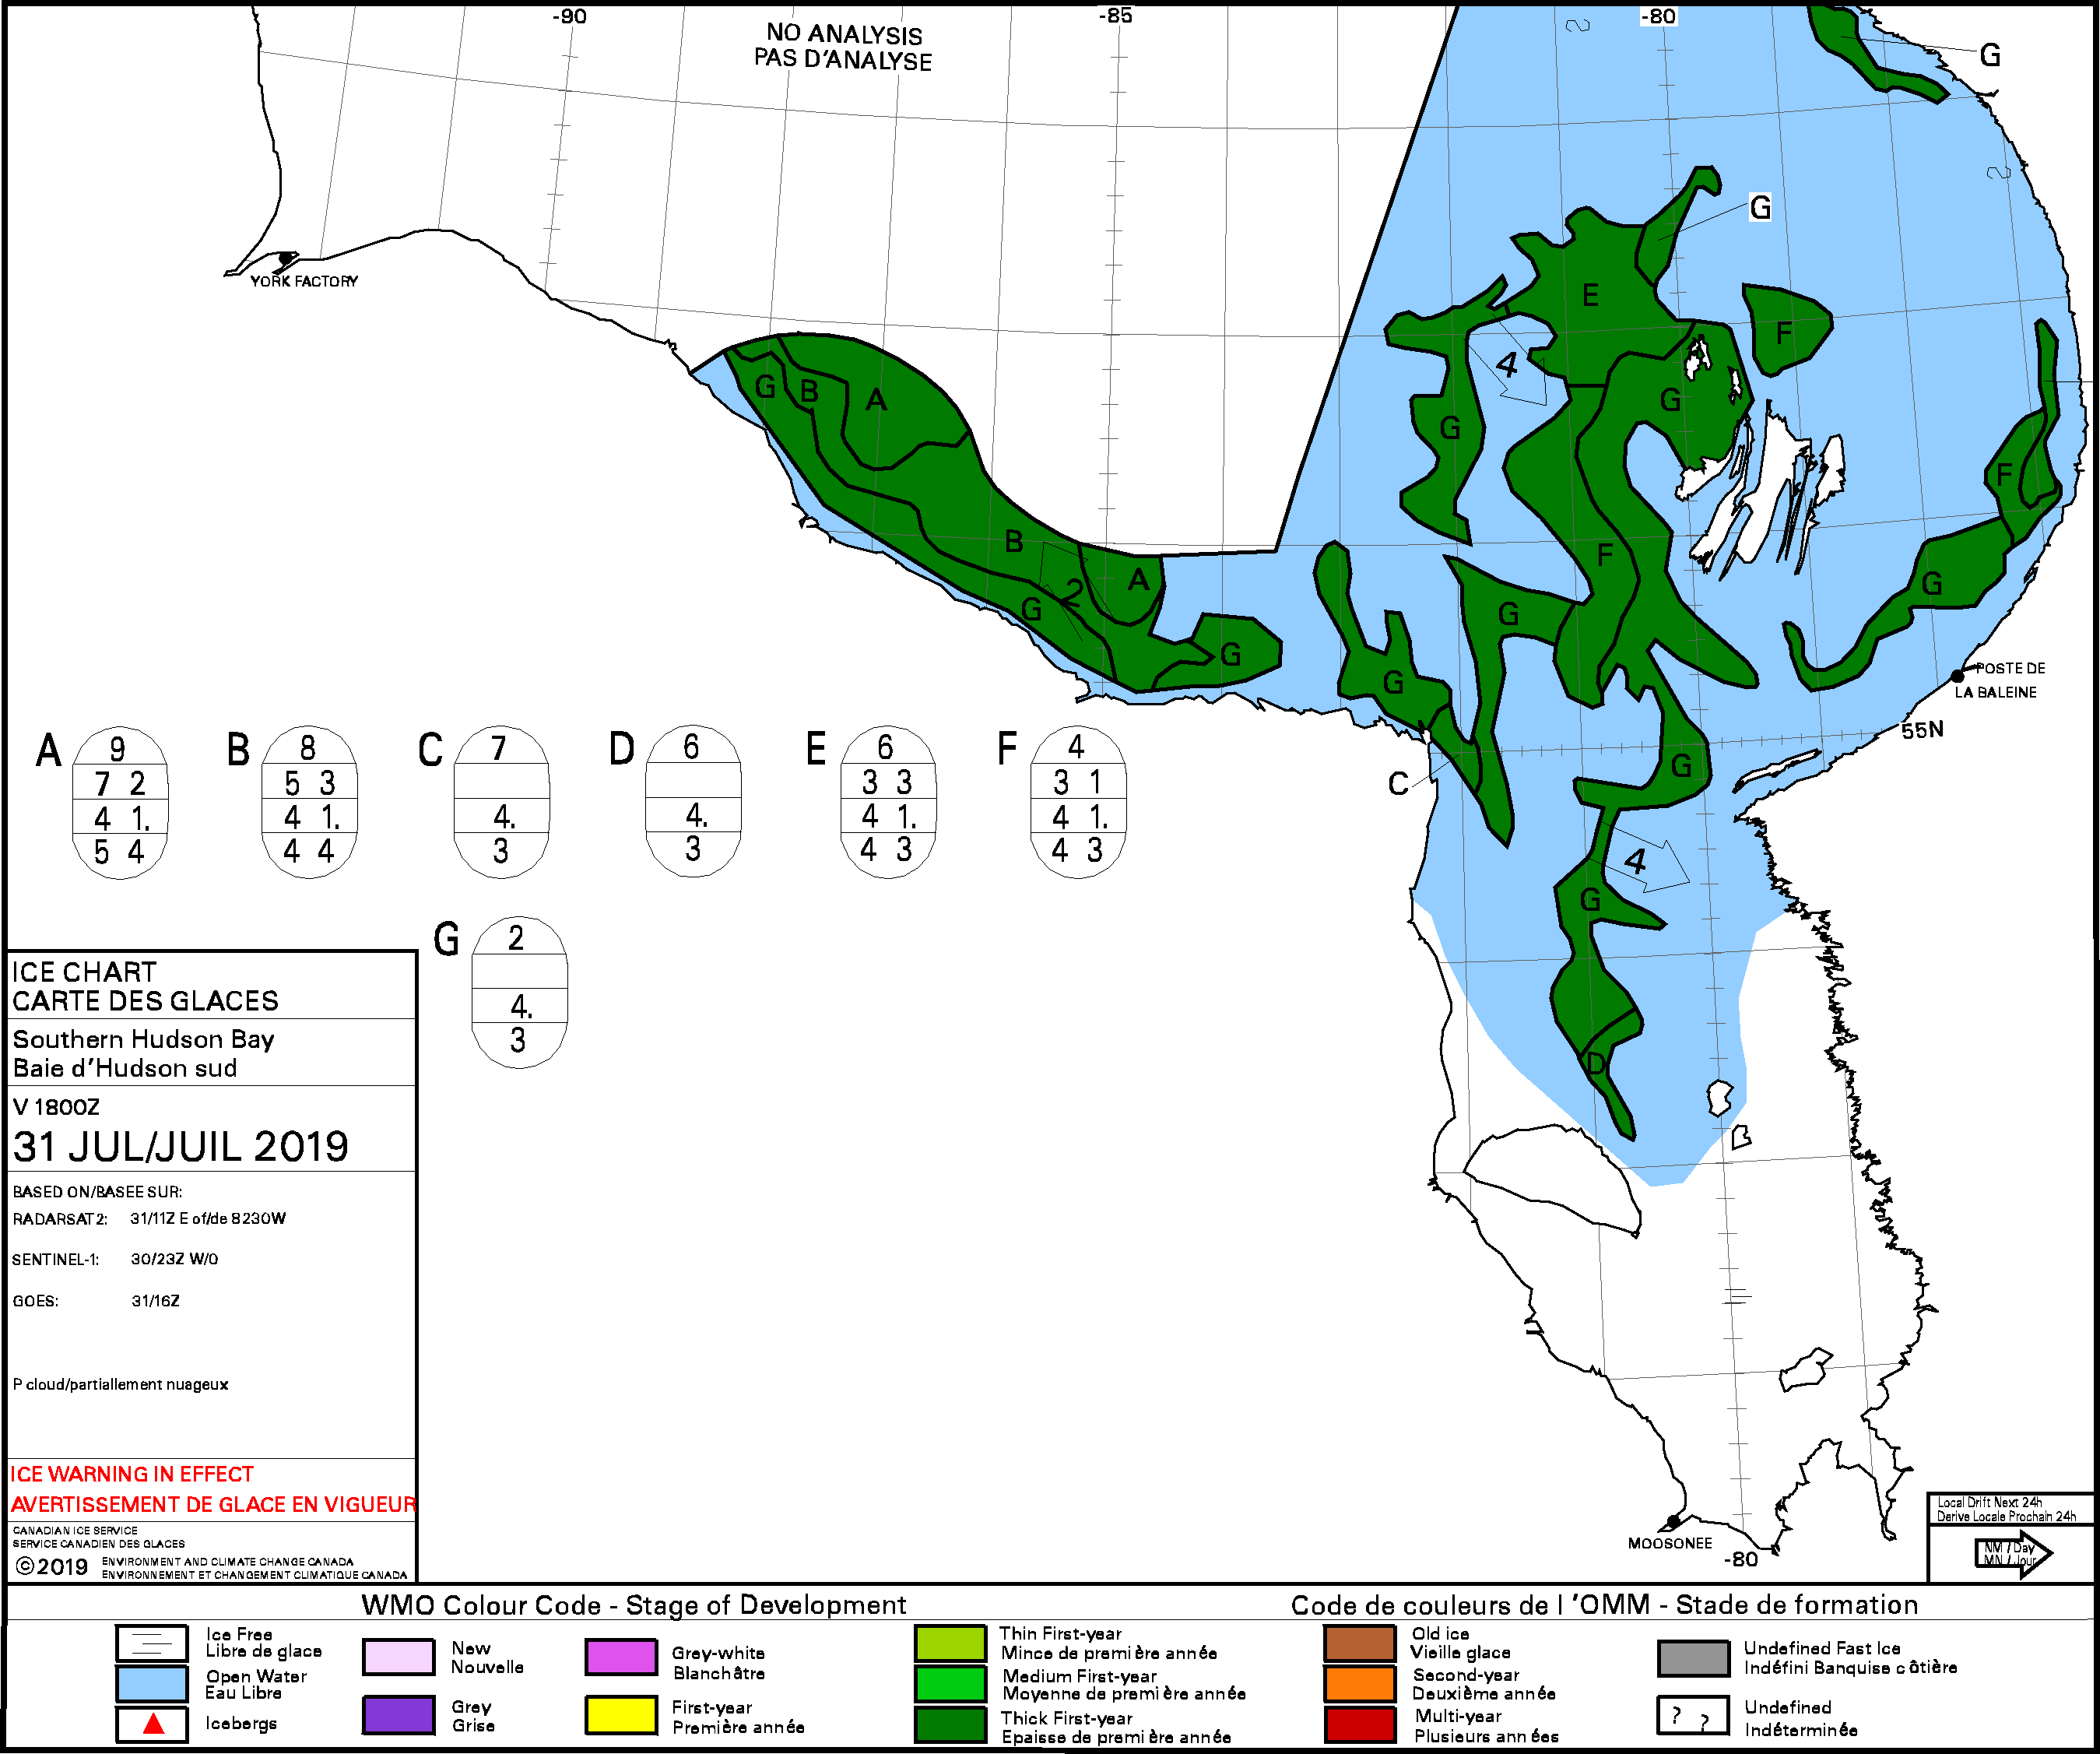
![GOES-14 Visible (0.63 µm) images [click to enlarge]](https://cimss.ssec.wisc.edu/satellite-blog/wp-content/uploads/sites/5/2019/07/190731_goes14_visible_Hudson_Bay_ice_anim.gif)

![Advanced Dvorak Technique (ADT) plot for Hurricane Erick [click to enlarge]](https://cimss.ssec.wisc.edu/satellite-blog/wp-content/uploads/sites/5/2019/07/erick_adt.gif)
![NOAA-20 VIIRS Infrared Window (11.45 µm) image [click to enlarge]](https://cimss.ssec.wisc.edu/satellite-blog/wp-content/uploads/sites/5/2019/07/190730_10utc_noaa20_viirs_infraredWindow_Erick.png)

![Time series of surface data from Sexton Summit [click to enlarge]](https://cimss.ssec.wisc.edu/satellite-blog/wp-content/uploads/sites/5/2019/07/190726_KSXT_SFCMG.GIF)
![Time series of surface data from Rogue Valley International Airport in Medford [click to enlarge]](https://cimss.ssec.wisc.edu/satellite-blog/wp-content/uploads/sites/5/2019/07/190726_KMFR_SFCMG.GIF)
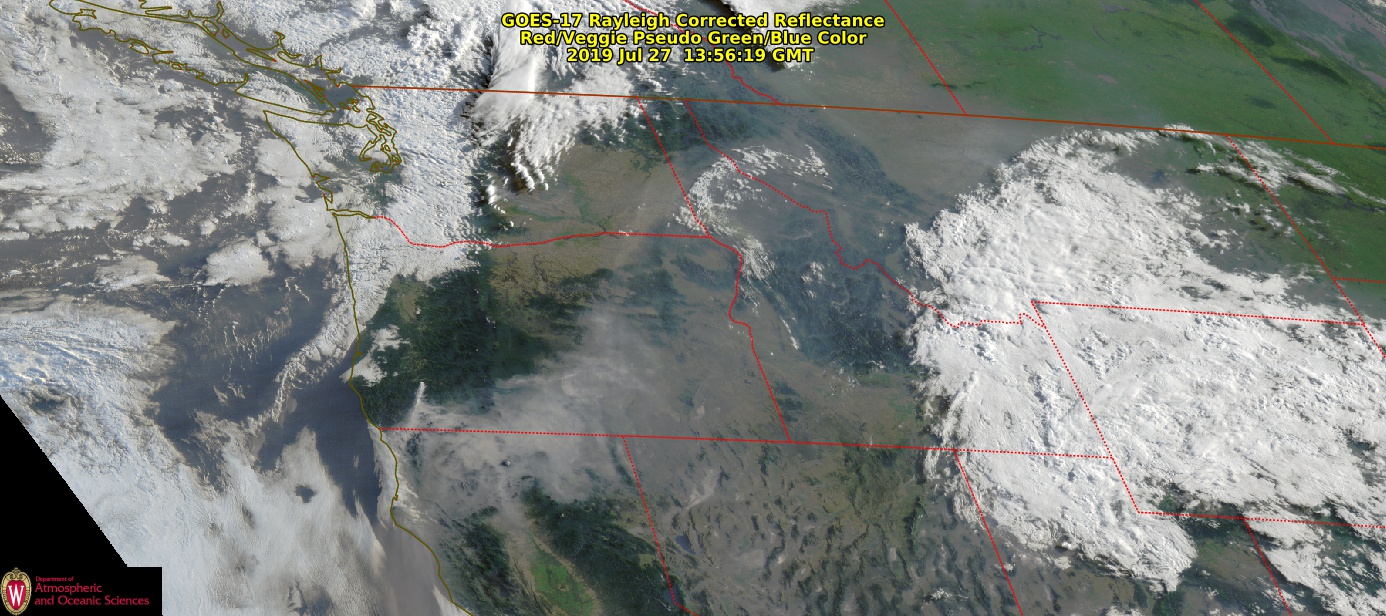
![GOES-17 True Color RGB images [click to play animation | MP4]](https://cimss.ssec.wisc.edu/satellite-blog/wp-content/uploads/sites/5/2019/07/190727_goes17_truecolor_NW_US_anim.gif)
![GOES-17 True Color RGB images [click to play animation | MP4]](https://cimss.ssec.wisc.edu/satellite-blog/wp-content/uploads/sites/5/2019/07/190727_goes17_truecolor_SW_US_anim.gif)
