
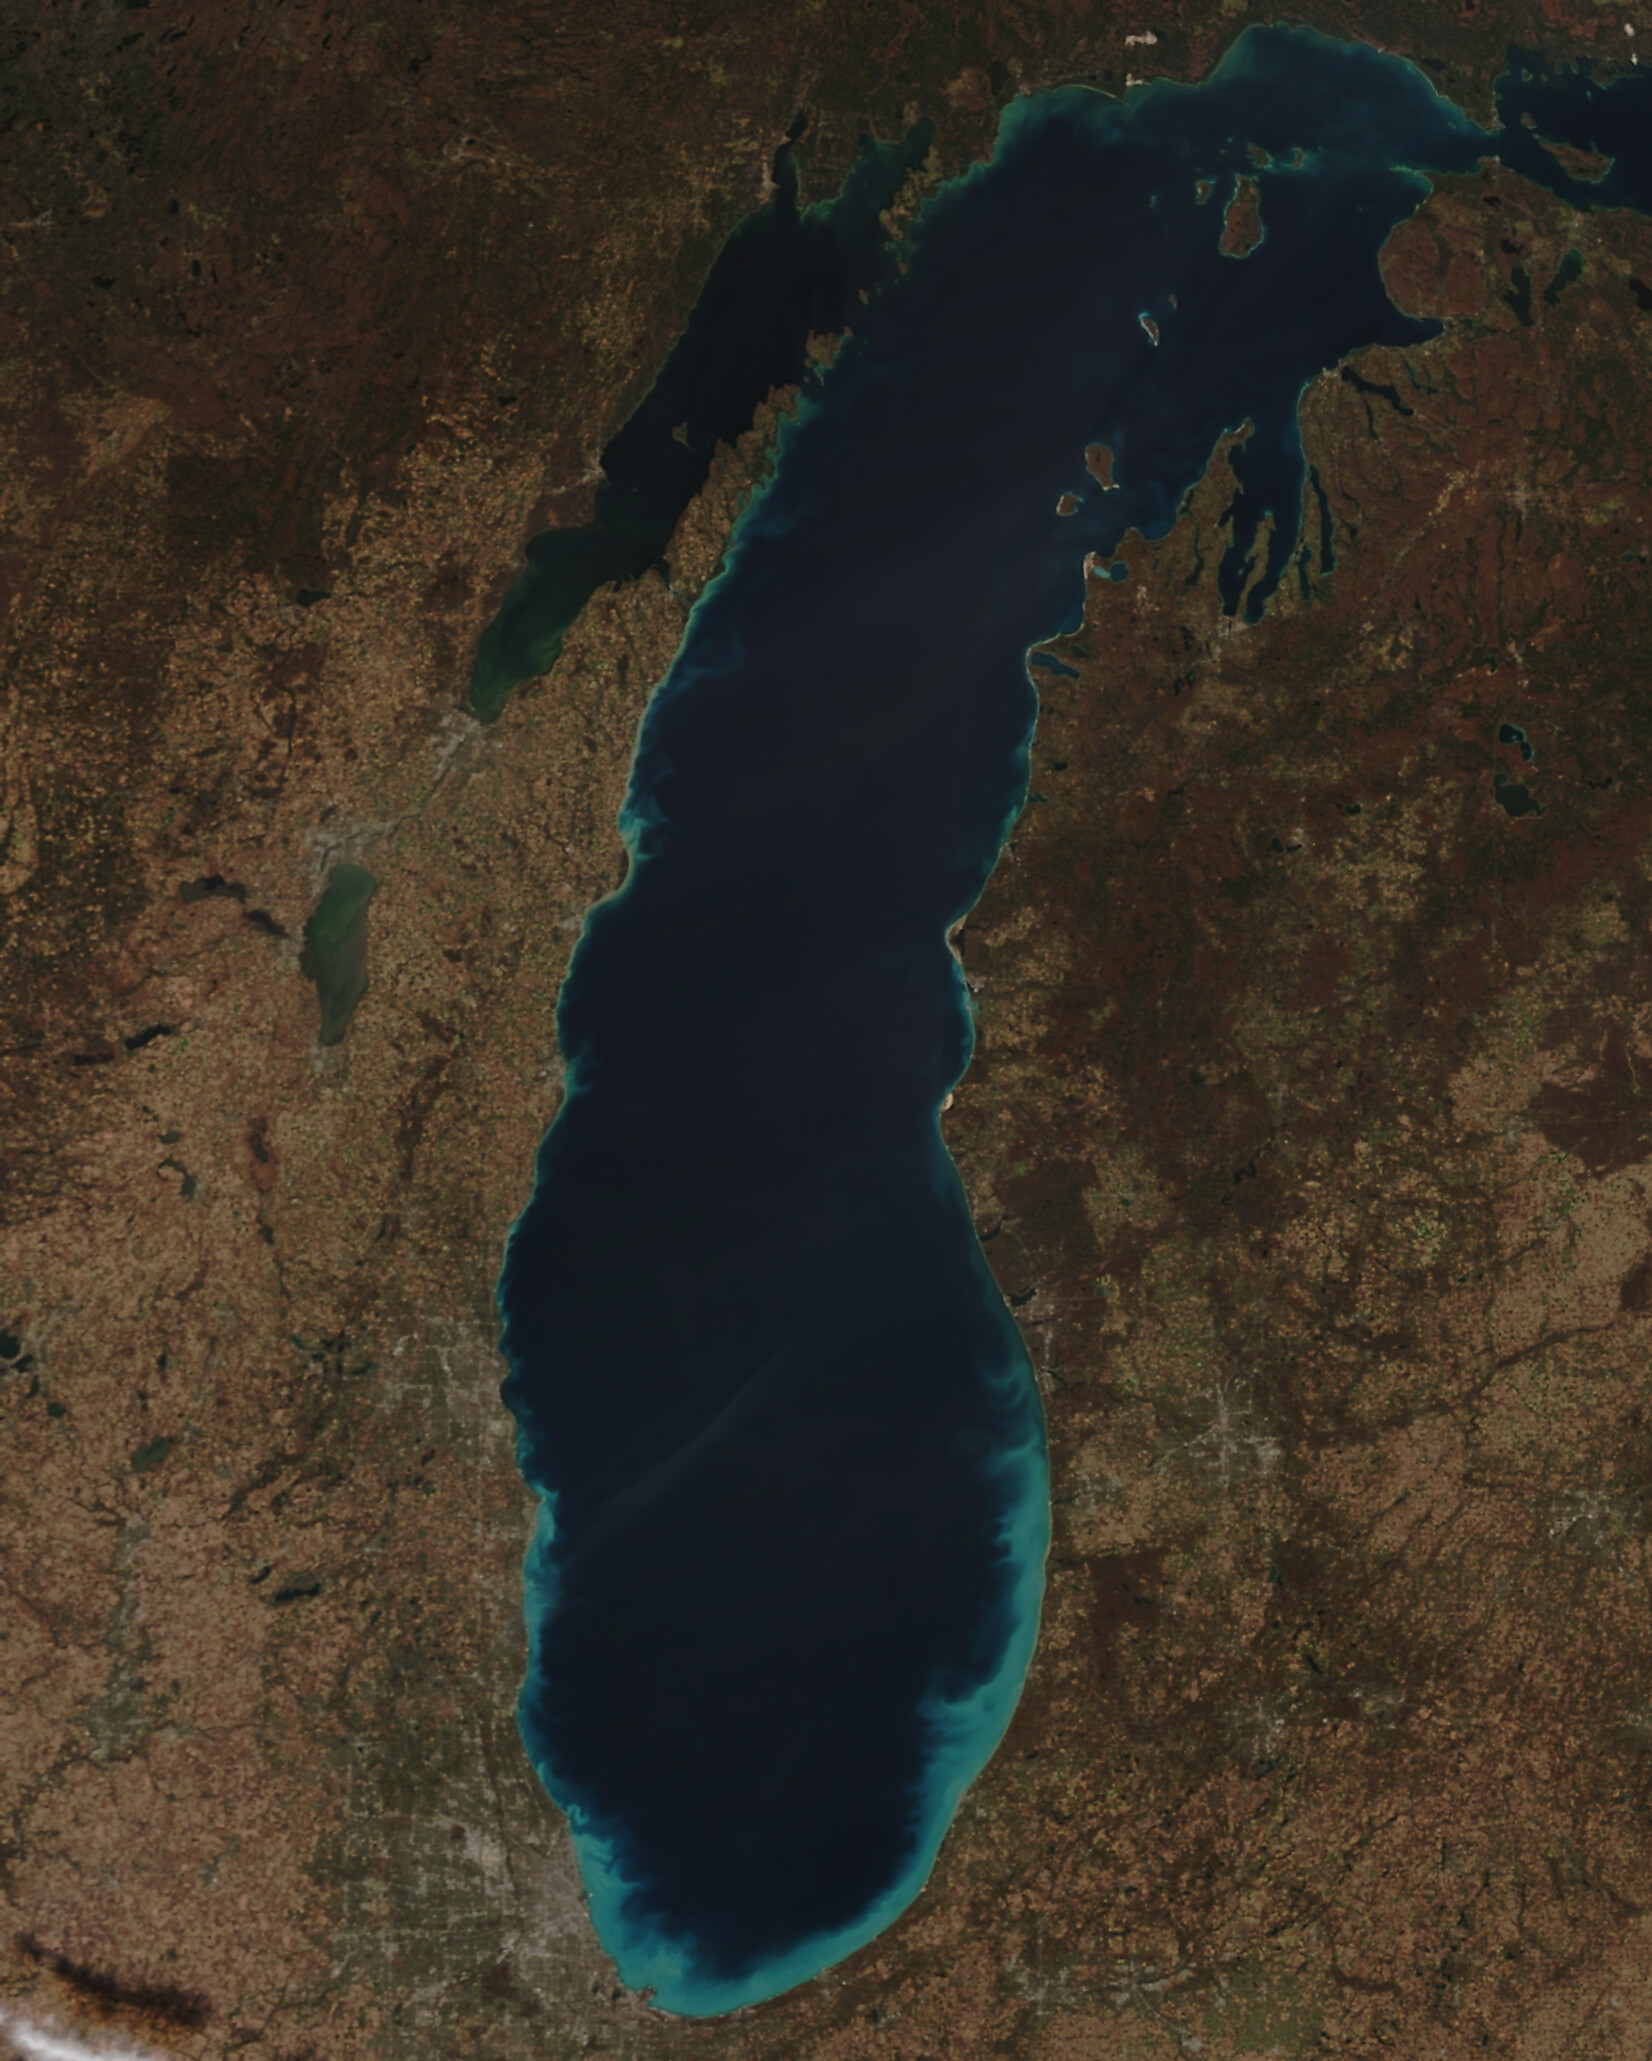
VIIRS True Color Imagery from Suomi-NPP (1729 UTC) and NOAA-20 (1818 UTC) on 4 November 2020 over the pre-defined Great Lakes domain (click to enlarge)
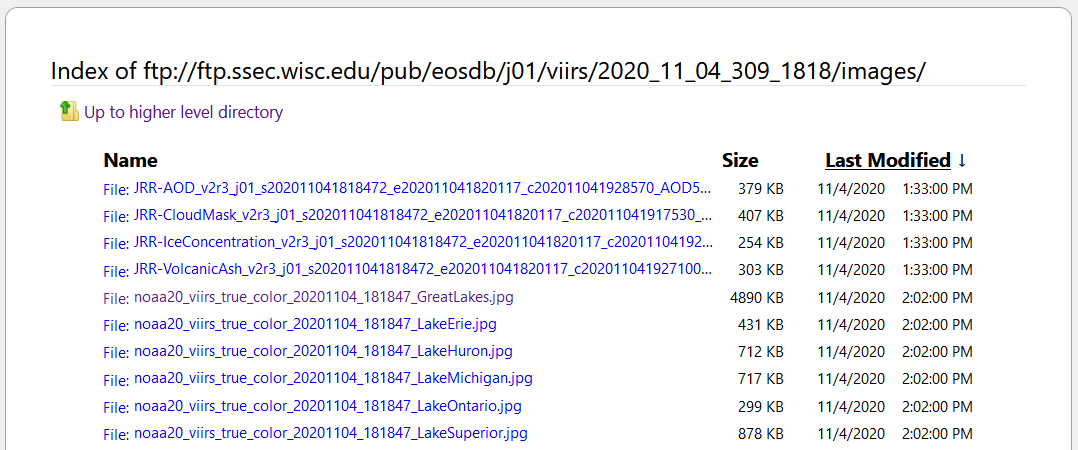
The CIMSS Direct Broadcast site is now routinely creating True-Color imagery over 6 different domains: The Great Lakes, and each of the 5 individual lakes: Superior, Huron, Michigan, Erie, Ontario (Click on each image to see the domain). File name examples are shown here. Suomi NPP and NOAA-20 are in similar orbits, about 50 minutes apart, so it’s common to be able to create an animation, as shown below with Lake Erie. Note that the colors in the toggle below, and in the Basin-wide toggle above, can show differences because of view angles. In particular, the slanted view angle over Lakes Michigan and Superior in the 1729 UTC Suomi-NPP image in the toggle above allows for the true-color imagery to show a thin layer of smoke over portions the those lakes.

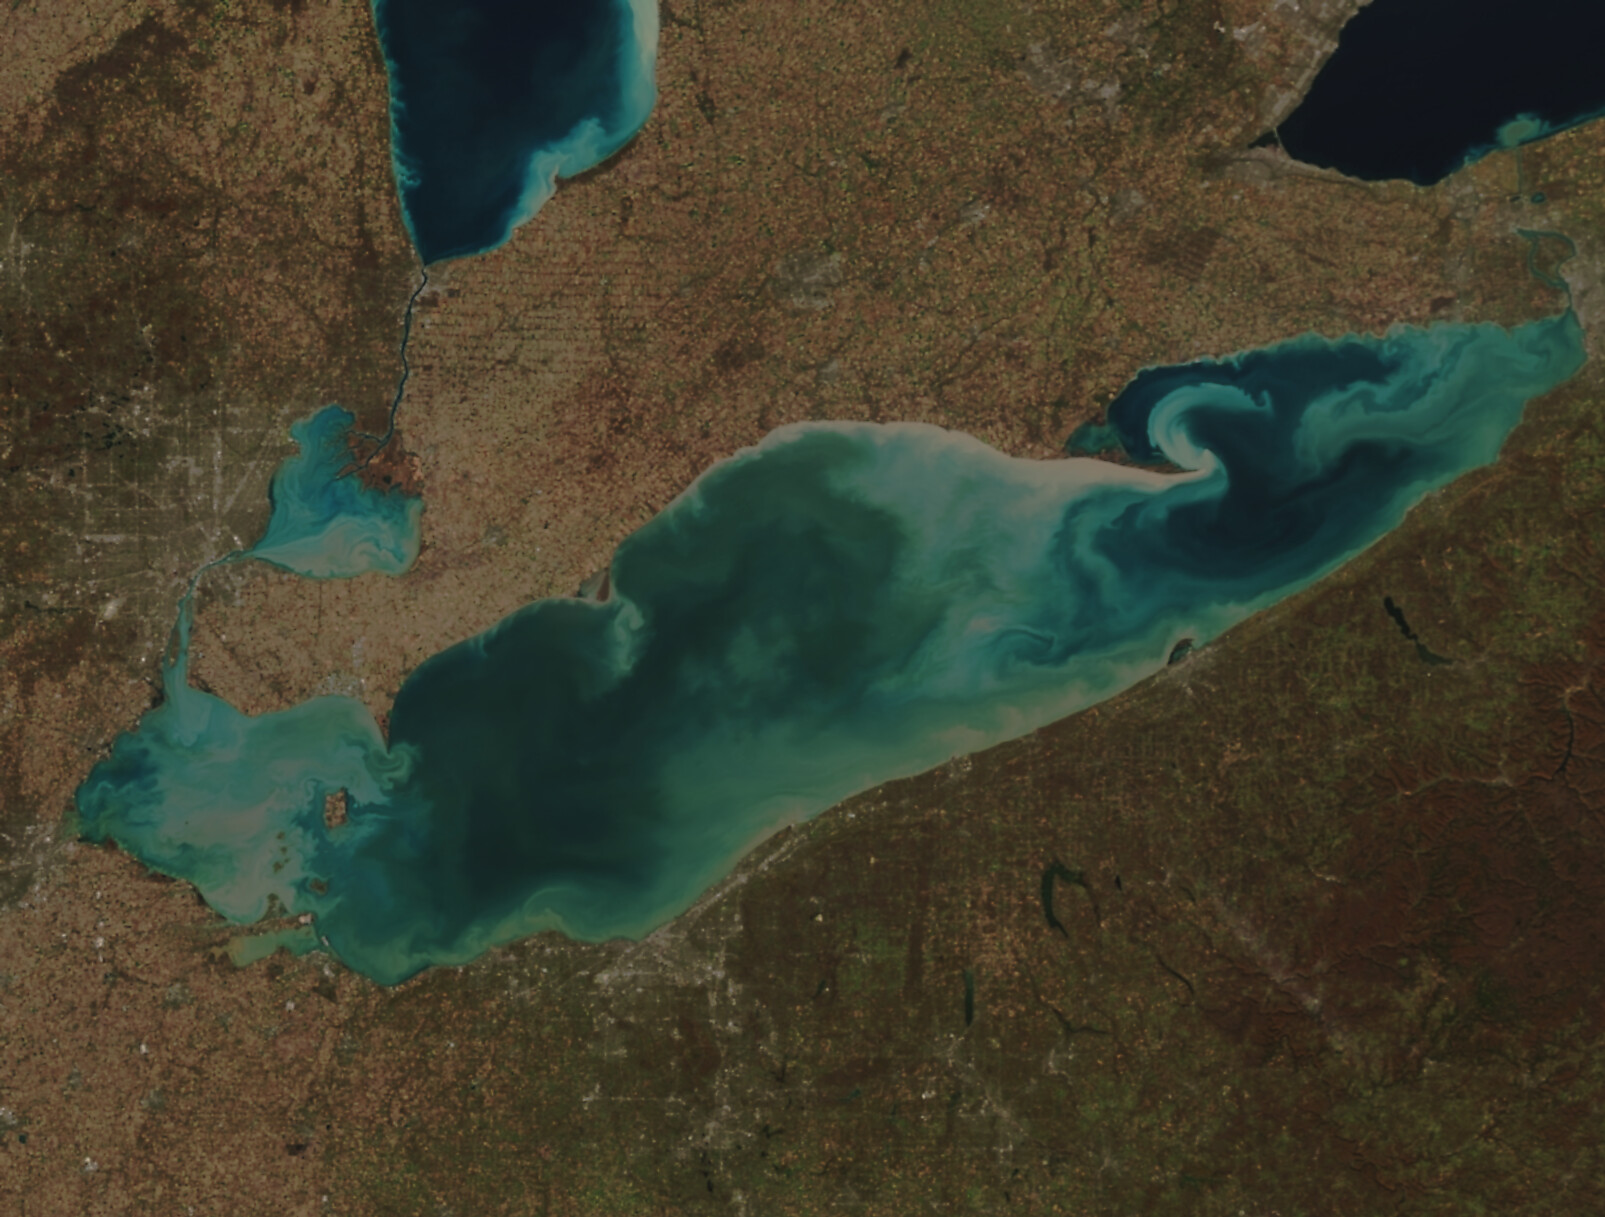
VIIRS True Color Imagery from Suomi-NPP (1729 UTC) and NOAA-20 (1818 UTC) on 4 November 2020 over the pre-defined Lake Erie domain (click to enlarge)
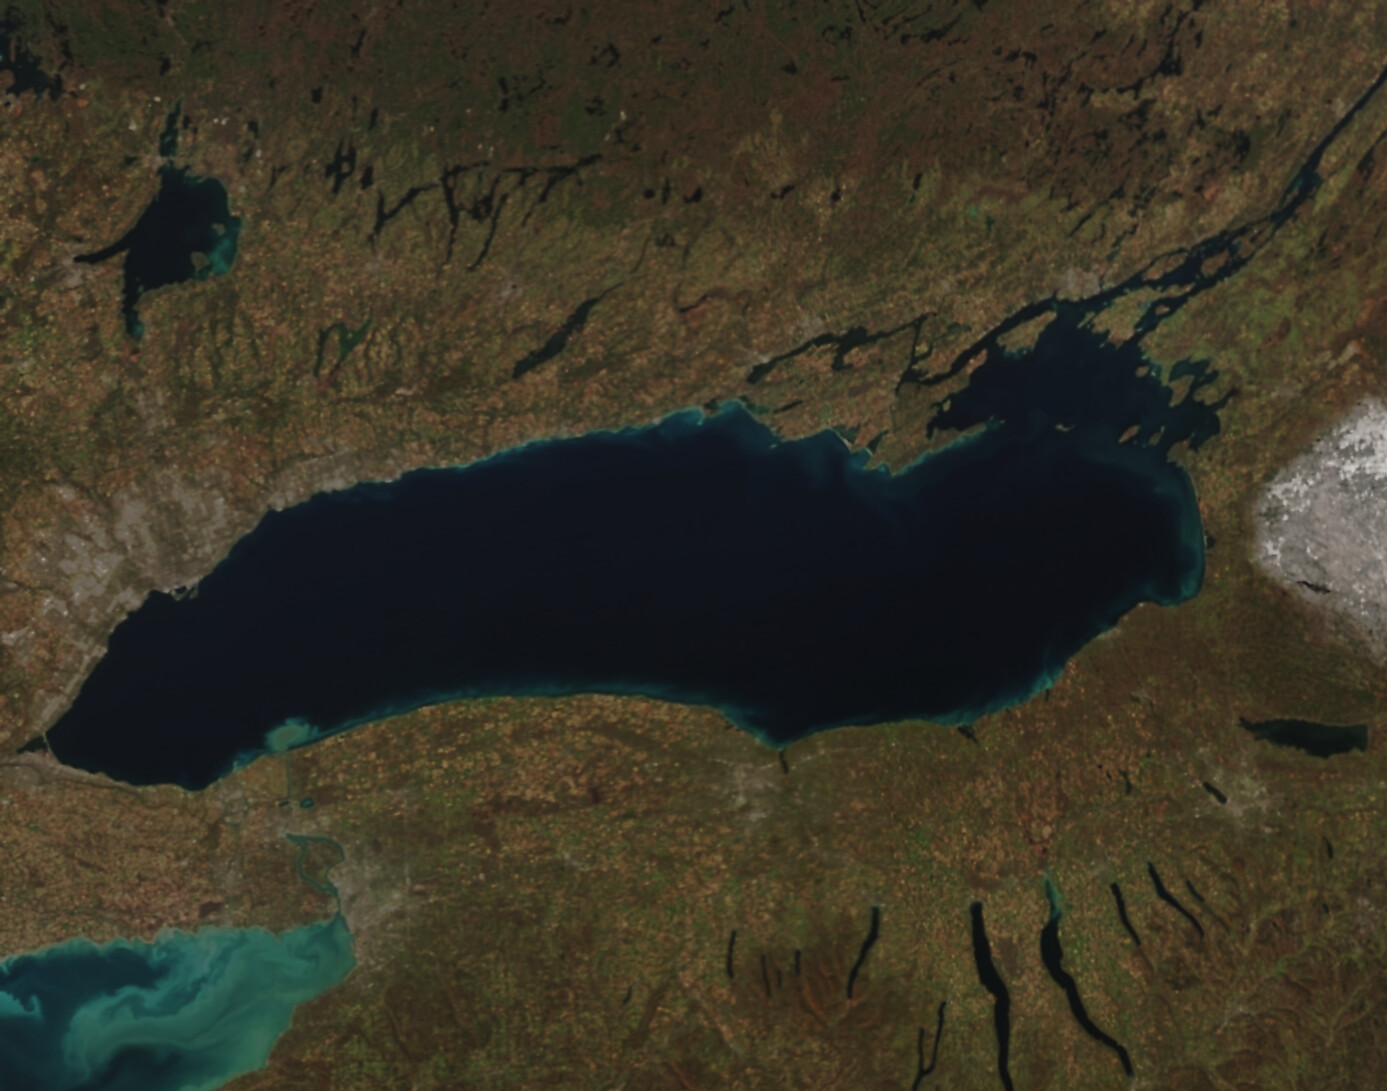
If NOAA-20 or Suomi-NPP only samples part of the lake, then a partial image is created, as shown below from NOAA-20 pass viewing Lake Ontario at 1639 UTC on 4 November. (NOAA-20 viewed the entirety of Lake Ontario at 1818 UTC).
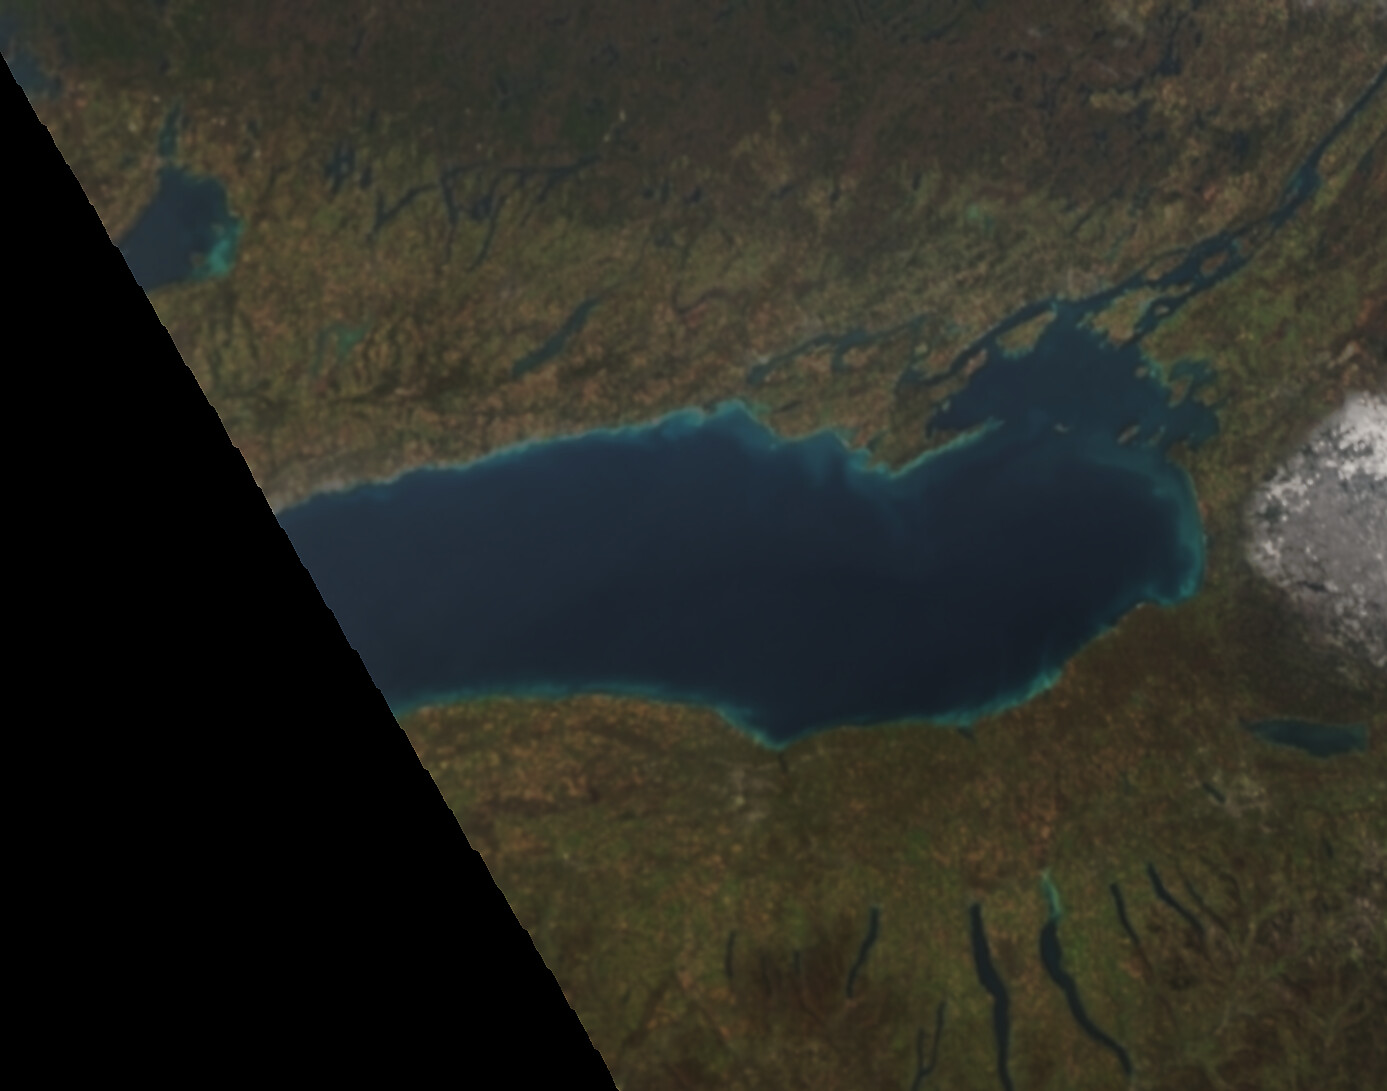
VIIRS True Color Imagery from NOAA-20 (1639 UTC) on 4 November 2020 over the pre-defined Lake Ontario domain (click to enlarge)
View only this post Read Less
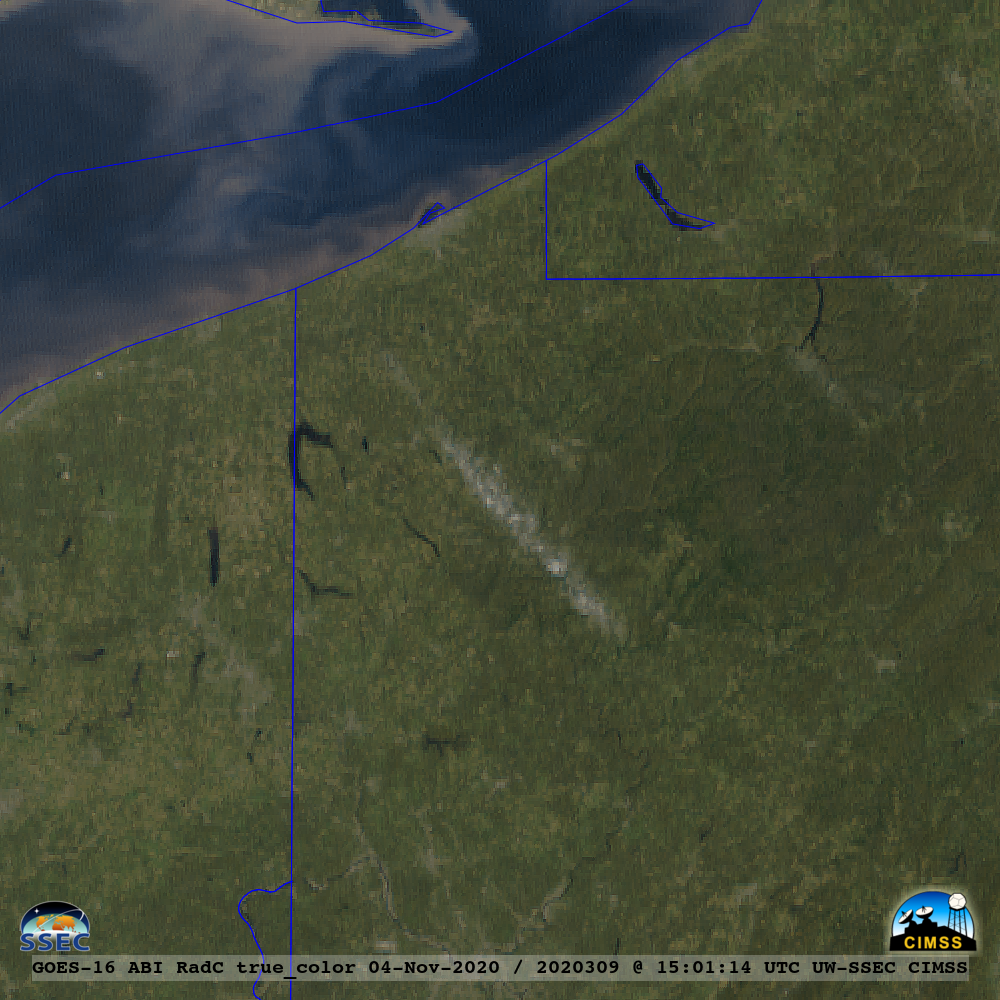
![GOES-16 “Red” Visible (0.64 µm) images [click to play animation | MP4]](https://cimss.ssec.wisc.edu/satellite-blog/images/2020/11/201104_goes16_visible_PA_lakeEffectSnowBand_anim.gif)
![NOAA-20 VIIRS Sea Surface Temperature product [click to enlarge]](https://cimss.ssec.wisc.edu/satellite-blog/images/2020/11/lake_erie_sst-20201104_181850.png)
![GOES-16 True Color images [click to play animation | MP4]](https://cimss.ssec.wisc.edu/satellite-blog/images/2020/11/201103_201104_goes16_trueColorRGB_PA_lakeEffectSnowBand_anim.gif)
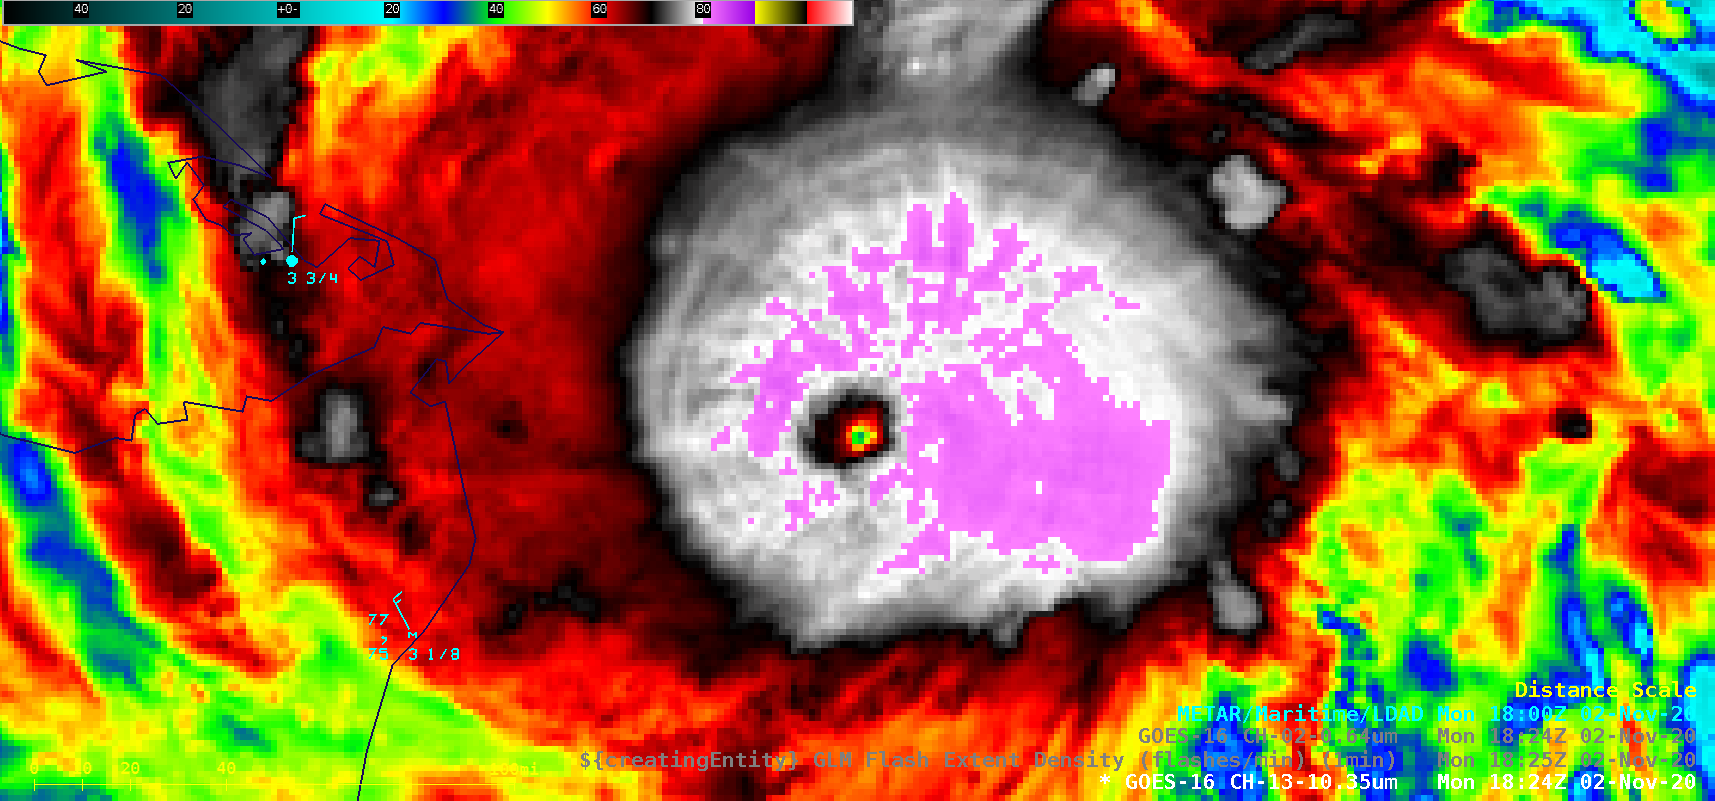
![GOES-16 “Clean” Infrared Window (10.35 µm) images (with and without an overlay of GLM Flash Extent Density) and “Red” Visible (0.64 µm) images [click to play animation | MP4]](https://cimss.ssec.wisc.edu/satellite-blog/images/2020/11/201102_goes16_infrared_glmFlashExtentDensity_visible_Hurricane_Eta_anim.gif)
![GOES-16 Longwave Infrared (11.2 µm) images, with contours of 18 UTC deep-layer wind shear [click to enlarge]](https://cimss.ssec.wisc.edu/satellite-blog/images/2020/11/201102_goes16_infrared_shear_Eta_anim.gif)
![GOES-16 Infrared - Water Vapor Difference images [click to enlarge]](https://cimss.ssec.wisc.edu/satellite-blog/images/2020/11/201102_goes16_irwvdiff_Eta_anim.gif)
![NOAA-20 VIIRS Day/Night Band (0.7 µm) and Infrared Window (11.45 µm) images (credit: William Straka, CIMSS) [click to enlarge]](https://cimss.ssec.wisc.edu/satellite-blog/images/2020/11/201103_0729utc_noaa20_viirs_dayNightBand_infraredWindow_Hurricane_Eta_anim.gif)
![GOES-16 “Clean” Infrared Window (10.35 µm) and “Red” Visible (0.64 µm) images [click to play animation | MP4]](https://cimss.ssec.wisc.edu/satellite-blog/images/2020/11/201103_goes16_infrared_visible_Hurricane_Eta_anim.gif)
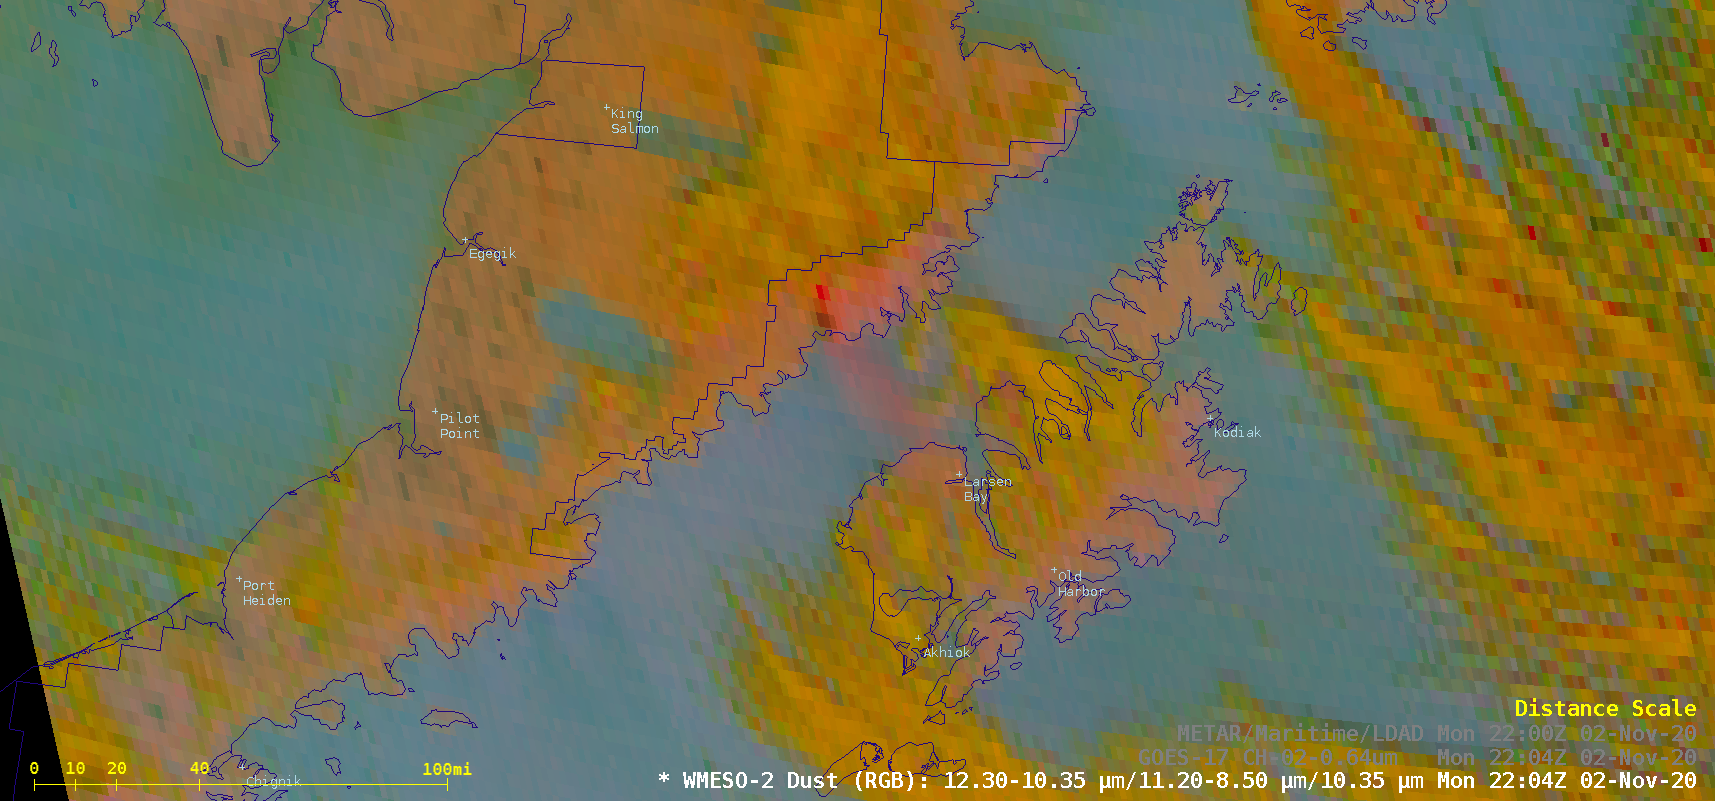
![GOES-17 Dust RGB and “Red” Visible (0.64 µm) images [click to play animation | MP4]](https://cimss.ssec.wisc.edu/satellite-blog/images/2020/11/201102_goes17_dustRGB_visible_Novarupta_resuspended_ash_AK_anim.gif)
![VIIRS True Color RGB images from NOAA-20 and Suomi NPP [click to enlarge]](https://cimss.ssec.wisc.edu/satellite-blog/images/2020/11/201102_noaa20_suomiNPP_viirs_truecolor_AK_anim.gif)
