After making landfall as a Category 1 Hurricane along Mexico’s Yucatan Peninsula a day earlier, a weakened Tropical Storm Zeta (NHC advisories) began to slowly re-intensify as it moved northward across the Gulf of Mexico after sunset on 27 October 2020 — 1-minute Mesoscale Domain Sector GOES-16 (GOES-East) “Clean” Infrared Window (10.35 µm) images with an overlay of... Read More
![GOES-16 “Clean” Infrared Window (10.35 µm) images, with an overlay of GLM Flash Extent Density [click to play animation | MP4]](https://cimss.ssec.wisc.edu/satellite-blog/images/2020/10/zeta_glm-20201028_020026.png)
GOES-16 “Clean” Infrared Window (10.35 µm) images, with an overlay of GLM Flash Extent Density [click to play animation | MP4]
After making landfall as a Category 1 Hurricane along Mexico’s Yucatan Peninsula a day earlier, a weakened Tropical Storm Zeta (
NHC advisories) began to slowly re-intensify as it moved northward across the Gulf of Mexico after sunset on 27 October 2020 — 1-minute
Mesoscale Domain Sector GOES-16
(GOES-East) “Clean” Infrared Window (
10.35 µm) images with an overlay of
GLM Flash Extent Density (above) displayed increasing organization, with the gradual emergence of a ragged eye. Zeta once again reached hurricane intensity at
0600 UTC on 28 October.
===== 28 October Update =====
![NOAA-20 VIIRS Day/Night Band (0.7 µm) and Infrared Window (11.45 µm) images at 0739 UTC (credit: William Straka, CIMSS) [click to enlarge]](https://cimss.ssec.wisc.edu/satellite-blog/images/2020/10/201028_0739utc_noaa20_dayNightBand_infraredWindow_Hurricane_Zeta_anim.gif)
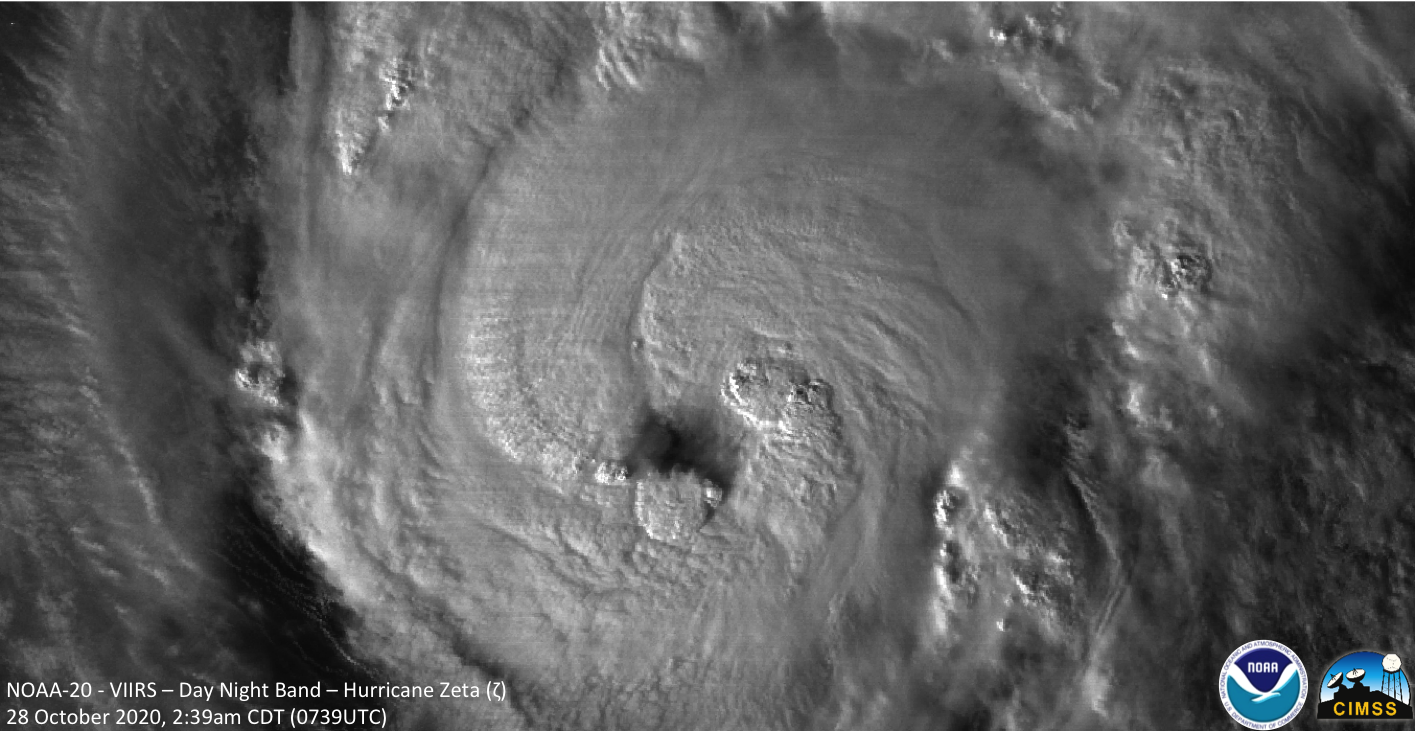
NOAA-20 VIIRS Day/Night Band (0.7 µm) and Infrared Window (11.45 µm) images at 0739 UTC (credit: William Straka, CIMSS) [click to enlarge]
In a toggle between NOAA-20 VIIRS Day/Night Band (0.7 µm) and Infrared Window (11.45 µm) images at 0739 UTC
(above), the coldest cloud-top infrared brightness temperature just east-northeast of the eye was -96ºC. Ample illumination from the Moon (in the Waxing Gibbous phase, at 91% of Full) helped to highlight the “visible image at night” utility of the Day/Night Band.
![GOES-16 “Clean” Infrared Window (10.35 µm) images (with and without an overlay of GLM Flash Extent Density) and “Red” Visible (0.64 µm) images [click to play animation | MP4]](https://cimss.ssec.wisc.edu/satellite-blog/images/2020/10/zeta_ir-20201028_210026.png)
GOES-16 “Clean” Infrared Window (10.35 µm) images (with and without an overlay of GLM Flash Extent Density) and “Red” Visible (0.64 µm) images [click to play animation | MP4]
Zeta experienced a period of rapid intensification during the day on 28 October (
ADT |
SATCON) — 1-minute GOES-16 Infrared images (with and without an overlay of GLM Flash Extent Density) and Visible images
(above) showed a trend of increasing organization and the emergence of a fairly well-defined eye. Periodic lightning activity within the inner eyewall region began after 1800 UTC (when Zeta was upgraded to a Category 2 hurricane), along with overshooting tops exhibiting cloud-top infrared brightness temperatures as cold as -90ºC. The hurricane made landfall along the coast of Louisiana around 2100 UTC.
![GOES-16 Longwave Infrared (11.2 µm) images, with contours of 20 UTC deep-layer wind shear [click to enlarge]](https://cimss.ssec.wisc.edu/satellite-blog/images/2020/10/201028_goes16_infrared_20utc_shear_Zeta_anim.gif)
GOES-16 Longwave Infrared (11.2 µm) images, with contours of 20 UTC deep-layer wind shear [click to enlarge]
Zeta was intensifying in spite of the fact that it was moving across
progressively colder water, and approaching an atmospheric environment that was more hostile in terms of increasing
deep-layer wind shear (above) — however, these factors were likely offset by a broad and well-defined upper level outflow channel north of the hurricane, shown by 6.2 µm
Derived Motion Winds with velocities around 100 knots over Arkansas
(below).
![GOES-16 Upper-level Water Vapor (6.2 µm) images, with plots of Derived Motion Winds [click to play animation | MP4]](https://cimss.ssec.wisc.edu/satellite-blog/images/2020/10/zeta_wv-20201028_201615.png)
GOES-16 Upper-level Water Vapor (6.2 µm) images, with plots of Derived Motion Winds [click to play animation | MP4]
===== 29 October Update =====
![GOES-16 True Color RGB images [click to play animation | MP4]](https://cimss.ssec.wisc.edu/satellite-blog/images/2020/10/GOES-16_ABI_RadC_true_color_2020303_150115Z.png)
GOES-16 True Color RGB images [click to play animation | MP4]
On the day after Zeta’s landfall, GOES-16 True Color Red-Green-Blue (RGB) images created using
Geo2Grid (above) showed an increase in turbidity within the shallow shelf waters off the Texas and Louisiana coasts. Also of note were the patches of fresh snow cover across portions of New Mexico, Texas and Oklahoma — areas having less snow depth experienced melting during the day.
A higher-resolution view of the nearshore turbidity was provided by 250-meter resolution Terra MODIS True Color RGB imagery from the MODIS Today site (below). Vigorous mixing of the water by the strong winds of Zeta stirred up a great deal of sediment.
![Terra MODIS True Color RGB image [click to enlarge]](https://cimss.ssec.wisc.edu/satellite-blog/images/2020/10/201029_terra_modis_truecolor_Gulf_Coast.png)
Terra MODIS True Color RGB image [click to enlarge]
View only this post
Read Less


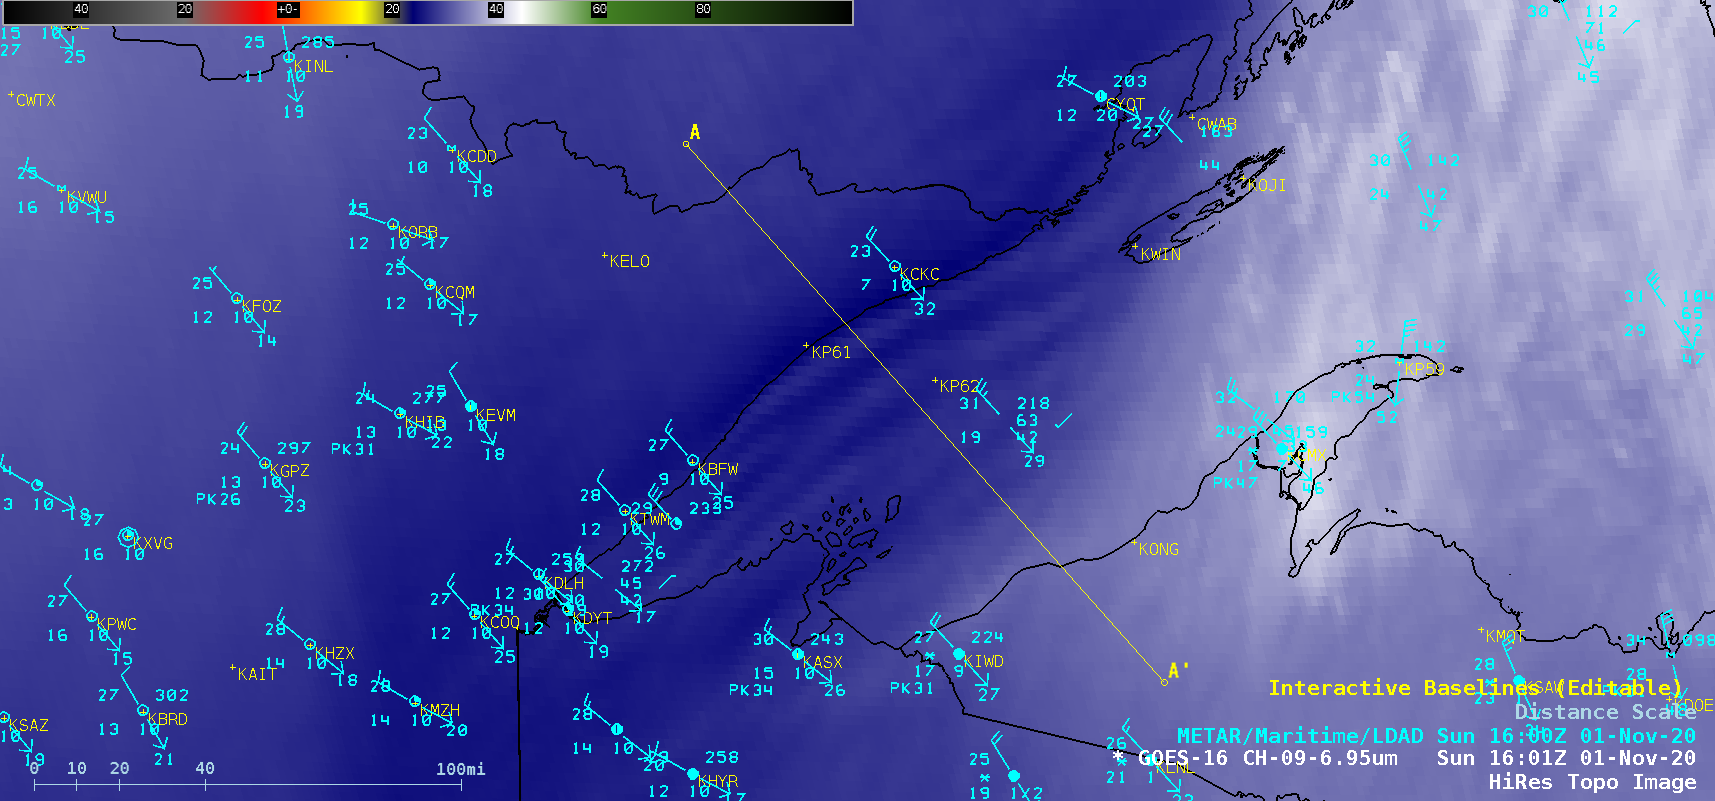
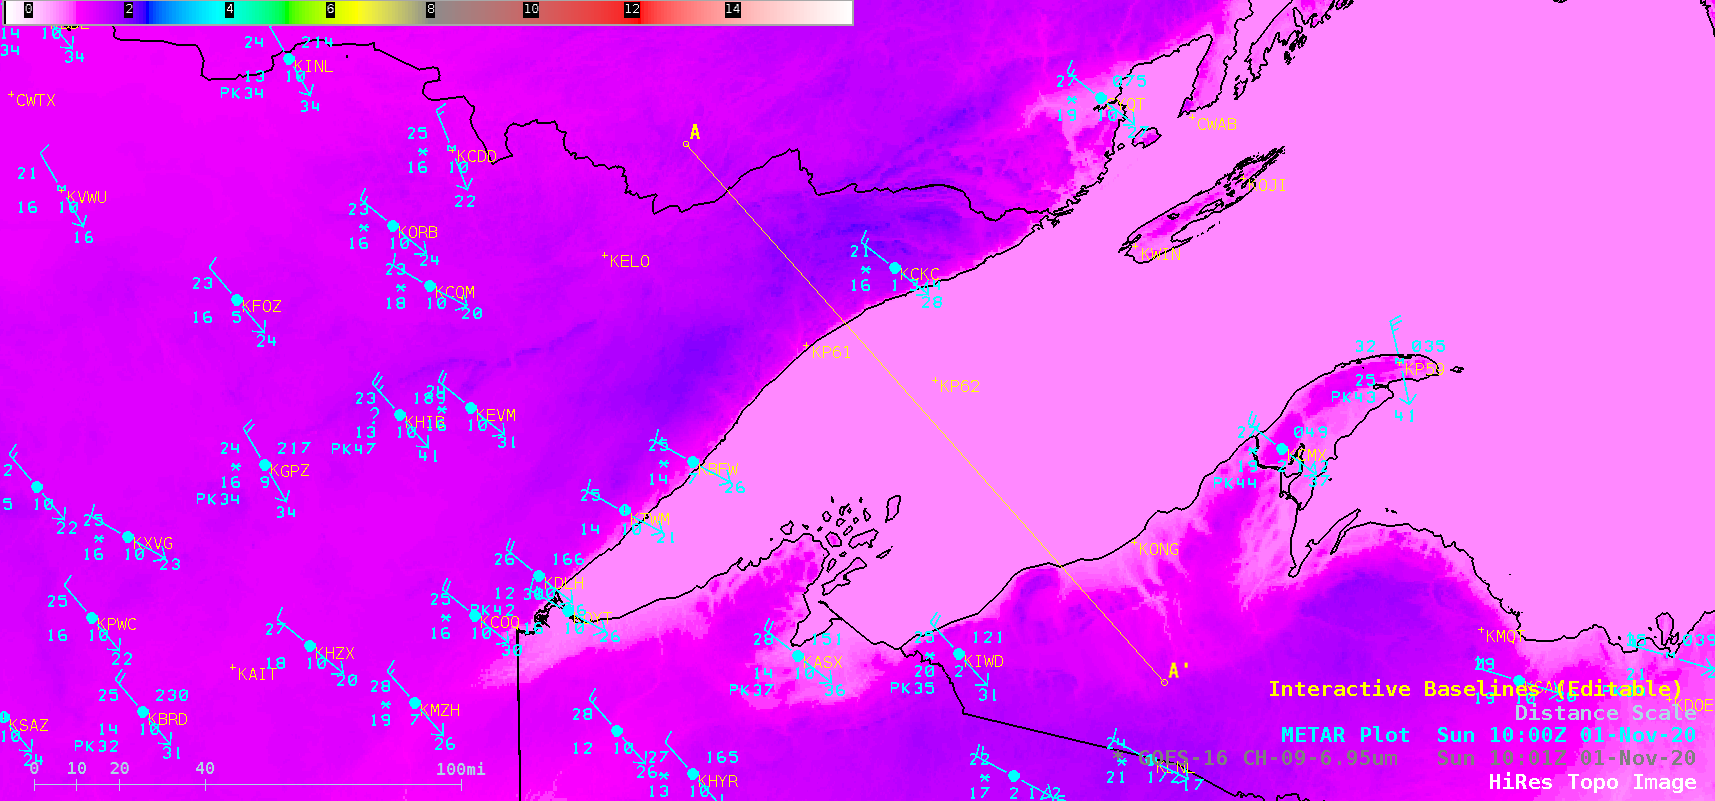
![GOES-16 Mid-level Water Vapor (6.9 µm) images [click to play animation | MP4]](https://cimss.ssec.wisc.edu/satellite-blog/images/2020/11/201101_goes16_waterVapor_Lake_Superior_standing_waves_anim.gif)
![Cross sections of NAM40 model fields [click to enlarge]](https://cimss.ssec.wisc.edu/satellite-blog/images/2020/11/201101_nam40crossSections_Lake_Superior_anim.gif)
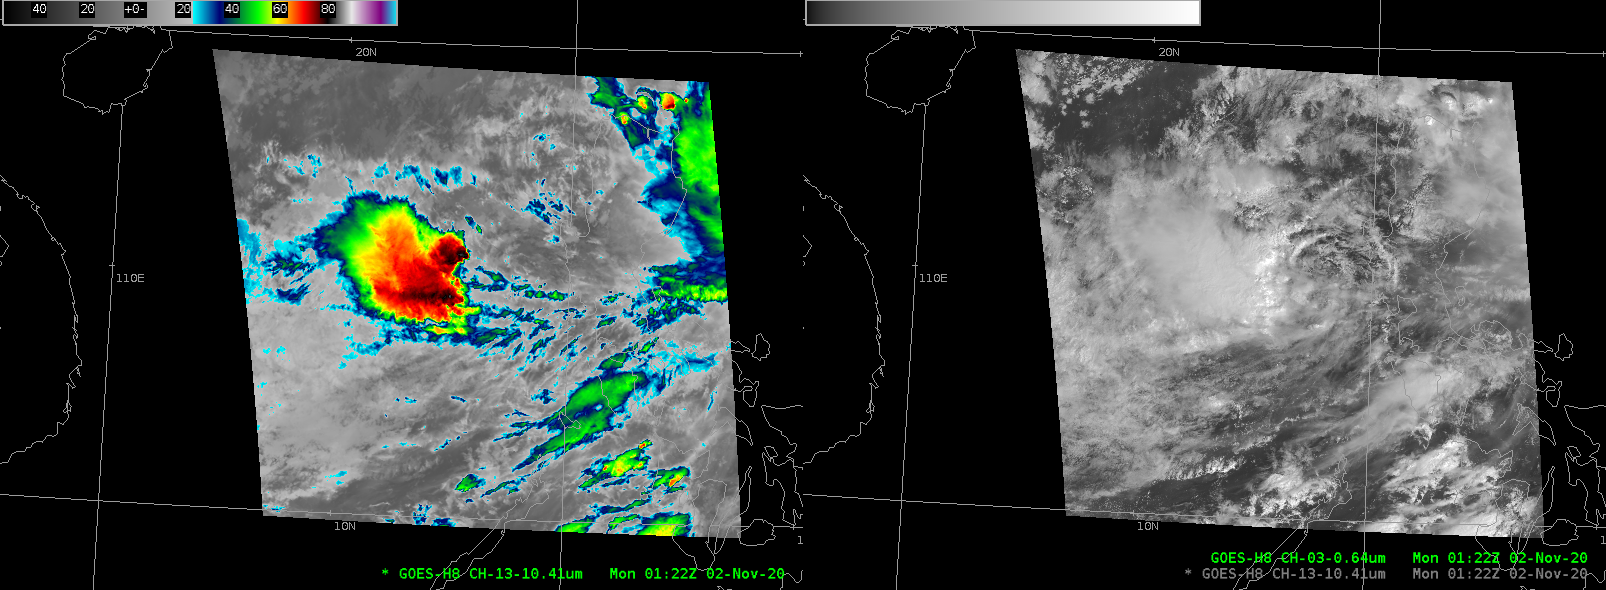
![JMA Himawari-8 "Clean" Infrared Window (10.4 µm) images [click to play animation | MP4]](https://cimss.ssec.wisc.edu/satellite-blog/images/2020/10/201030_himawari8_infrared_Typhoon_Goni_anim.gif)
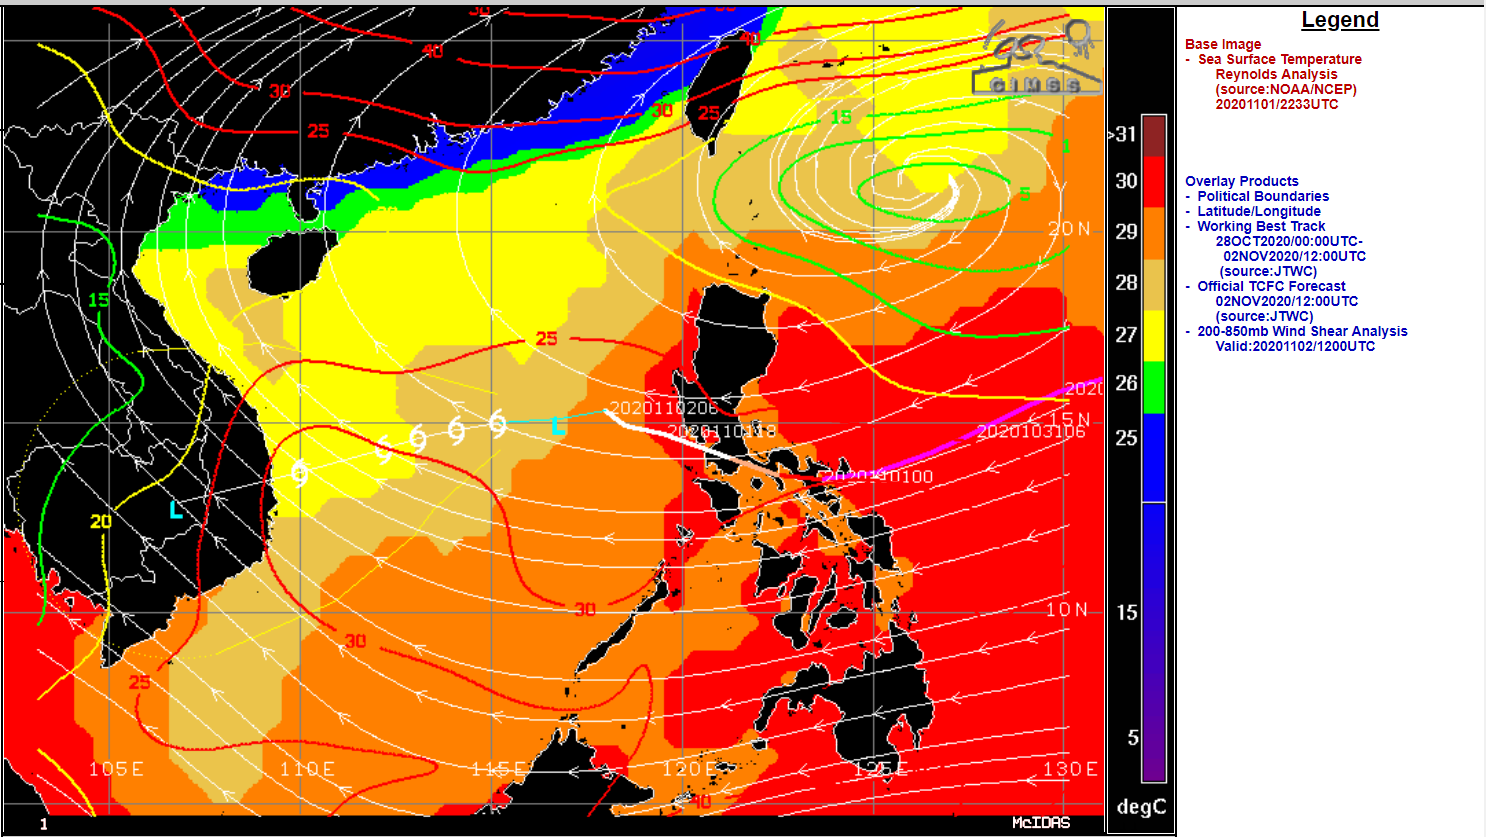
![Himawari-8 Longwave Infrared (11.2 µm) images, with contours of 0i0 UTC deep-layer wind shear [click to enlarge]](https://cimss.ssec.wisc.edu/satellite-blog/images/2020/10/201030_himawari8_infrared_shear_Goni_anim.gif)
![JMA Himawari-8 "Clean" Infrared Window (10.4 µm) images [click to play animation | MP4]](https://cimss.ssec.wisc.edu/satellite-blog/images/2020/10/201031_himawari8_infrared_SuperTyphoon_Goni_anim.gif)
![Himawari-8 Water Vapor images, with contours of deep-layer wind shear [click to enlarge]](https://cimss.ssec.wisc.edu/satellite-blog/images/2020/10/201031_himawari8_waterVapor_shear_Goni_anim.gif)
![DMSP-16 SSMIS Microwave image at 2032 UTC [click to enlarge]](https://cimss.ssec.wisc.edu/satellite-blog/images/2020/10/201031_2032utc_dmsp16_ssmis_microwave_Goni.gif)
![NOAA-20 VIIRS Infrared Window (11.45 ) image [click to enlarge]](https://cimss.ssec.wisc.edu/satellite-blog/images/2020/10/201031_16utc_noaa20_infrared_Typhon_Goni_anim.gif)
![GOES-16 “Clean” Infrared Window (10.35 µm) images, with an overlay of GLM Flash Extent Density [click to play animation | MP4]](https://cimss.ssec.wisc.edu/satellite-blog/images/2020/10/201027_goes16_infrared_glmFlashExtentDensity_Hurricane_Zeta_anim.gif)
![GOES-16 “Clean” Infrared Window (10.35 µm) images (with and without an overlay of GLM Flash Extent Density) and “Red” Visible (0.64 µm) images [click to play animation | MP4]](https://cimss.ssec.wisc.edu/satellite-blog/images/2020/10/201028_goes16_infrared_glmFlashExtentDensity_visible_Hurricane_Zeta_anim.gif)
![GOES-16 Upper-level Water Vapor (6.2 µm) images, with plots of Derived Motion Winds [click to play animation | MP4]](https://cimss.ssec.wisc.edu/satellite-blog/images/2020/10/201028_goes16_waterVapor_derivedMotionWinds_Zeta_anim.gif)
![GOES-16 True Color RGB images [click to play animation | MP4]](https://cimss.ssec.wisc.edu/satellite-blog/images/2020/10/201029_goes16_trueColorRGB_post_Zeta_snowCover_turbidity_anim.gif)
