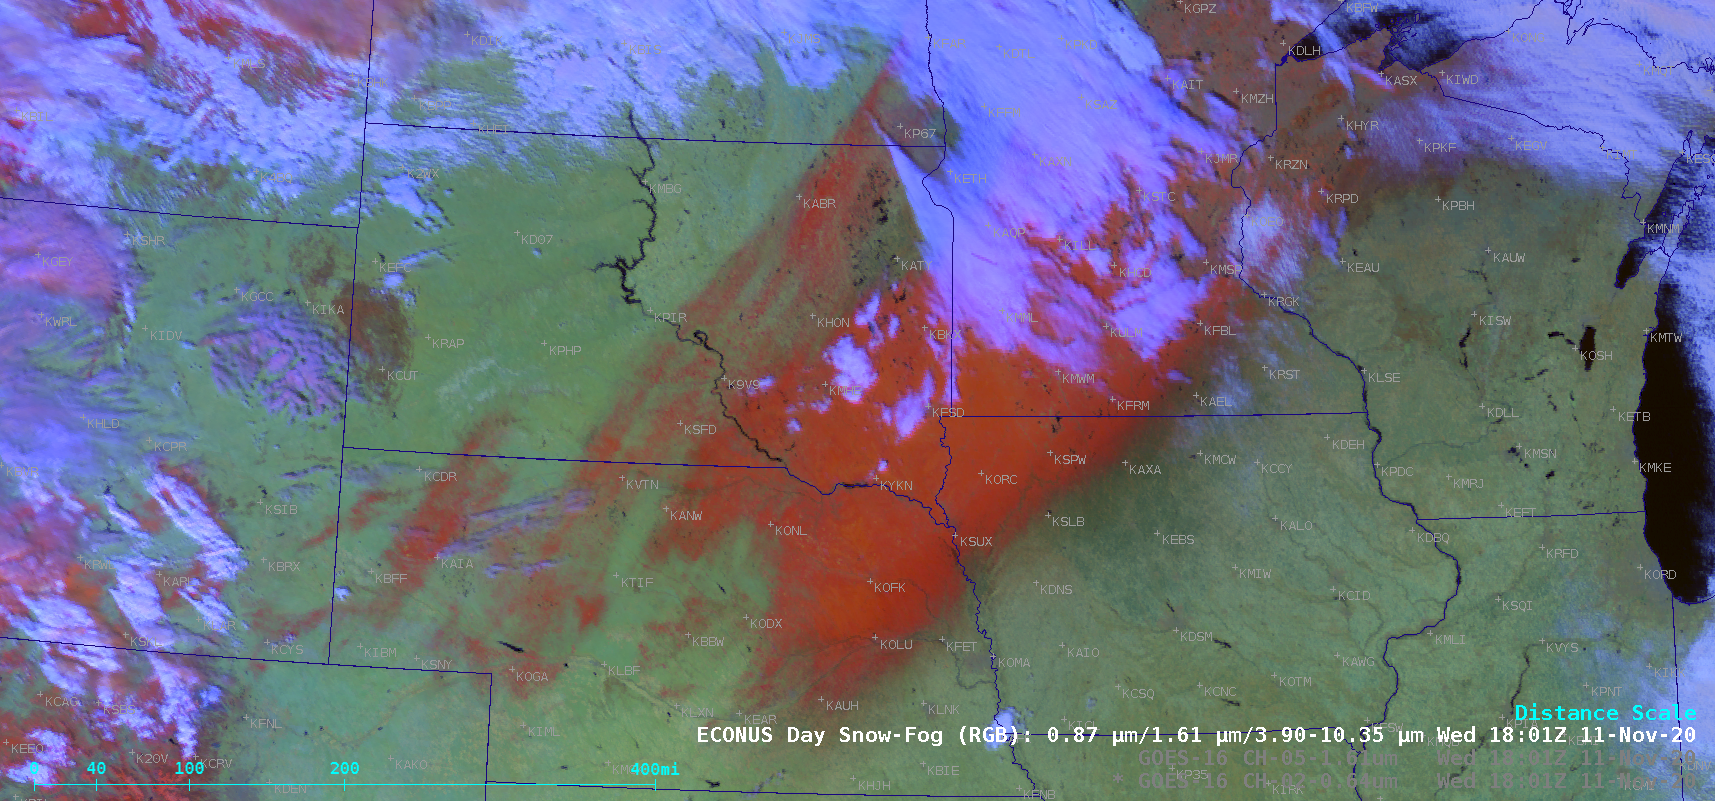
GOES-16 (GOES-East) “Red” Visible (0.64 µm), Near-Infrared “Snow/Ice” (1.61 µm) and Day Snow-Fog Red-Green-Blue (RGB) images (above) showed a broad swath of fresh snow cover across parts of Nebraska, South Dakota, Iowa, Minnesota, Wisconsin and Upper Michigan on 11 November 2020. The band of heavy snow developed northwest of an intensifying midlatitude cyclone on the... Read More

GOES-16 “Red” Visible (0.64 µm), Near-Infrared “Snow/Ice” (1.61 µm) and Day Snow-Fog RGB images [click to play animation | MP4]
GOES-16
(GOES-East) “Red” Visible (
0.64 µm), Near-Infrared “Snow/Ice” (
1.61 µm) and
Day Snow-Fog Red-Green-Blue (RGB) images
(above) showed a broad swath of fresh snow cover across parts of Nebraska, South Dakota, Iowa, Minnesota, Wisconsin and Upper Michigan on
11 November 2020. The band of heavy snow developed northwest of an intensifying midlatitude cyclone on the previous day (
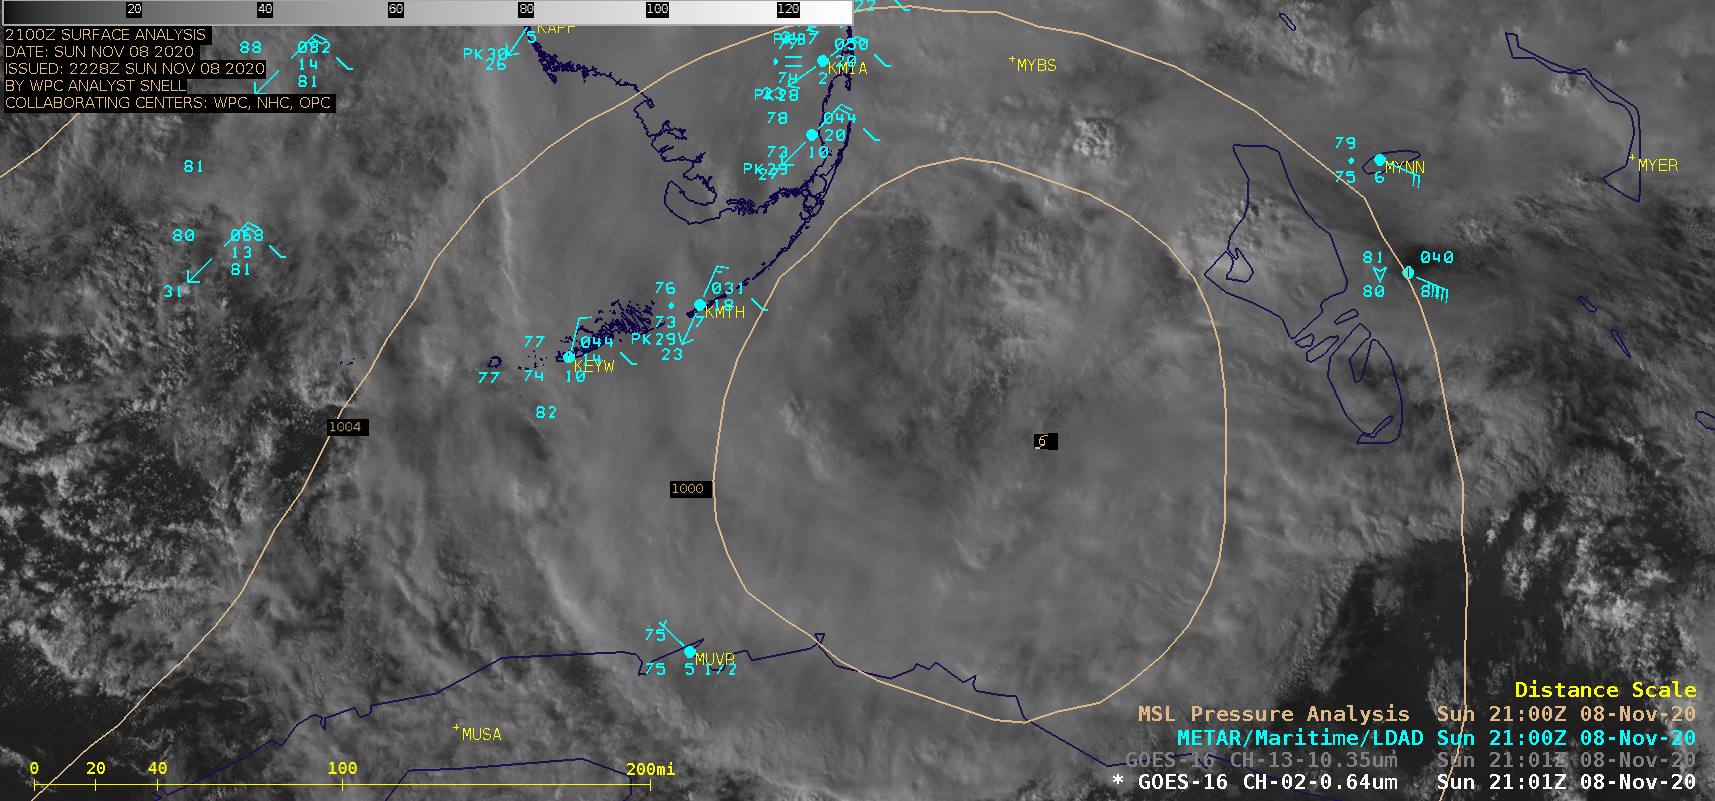
surface analyses) — storm total snowfall amounts included 11 inches in Nebraska, 11 inches in Minnesota, 8 inches in South Dakota, 7.5 inches in Iowa and 6.8 inches in Wisconsin.
![GOES-16 “Red” Visible (0.64 µm), Near-Infrared "Snow/Ice" (1.61 µm) and Day Snow-Fog RGB images at 1501 UTC [click to enlarge]](https://cimss.ssec.wisc.edu/satellite-blog/images/2020/11/201111_1501utc_goes16_visible_snowIce_daySnowFogRGB_Upper_Midwest_snow_cover_anim.gif)
GOES-16 “Red” Visible (0.64 µm), Near-Infrared “Snow/Ice” (1.61 µm) and Day Snow-Fog RGB images at 1501 UTC [click to enlarge]
In a comparison of images at 1501 UTC
(above), note the darker shades of gray/black on the 1.61 µm image and the darker shades of red on the RGB image along the southeastern edge of the heavy snow band — this highlighted areas where a significant
accrual of ice resulted from freezing rain/drizzle. As seen in a plot of
ABI Spectral Response Functions
(below), snow and ice are efficient
absorbers of radiation (and therefore exhibit a low
relectance) at the 1.61 µm wavelength, making them appear
darker on the Snow/Ice and RGB images — and since ice absorbs more strongly than snow, it appears as the darkest shades of gray/black (1.61 µm) or red (RGB).
![Plots of Spectral Response Function for ABI Bands 1-5 [click to enlarge]](https://cimss.ssec.wisc.edu/satellite-blog/wp-content/uploads/sites/5/2019/01/ABI_Bands1-5_SRF.jpg)
Plots of Spectral Response Function for ABI Bands 1-5 (credit: Mat Gunshor, CIMSS) [click to enlarge]
View only this post
Read Less

![Suomi NPP VIIRS Infrared Window (11.45 µm) and Day/Night Band (0.7 µm) images at 0734 UTC [click to enlarge]](https://cimss.ssec.wisc.edu/satellite-blog/images/2020/11/201110_0734utc_suomiNPP_viirs_infraredWindow_dayNightBand_TS_Eta_anim.gif)
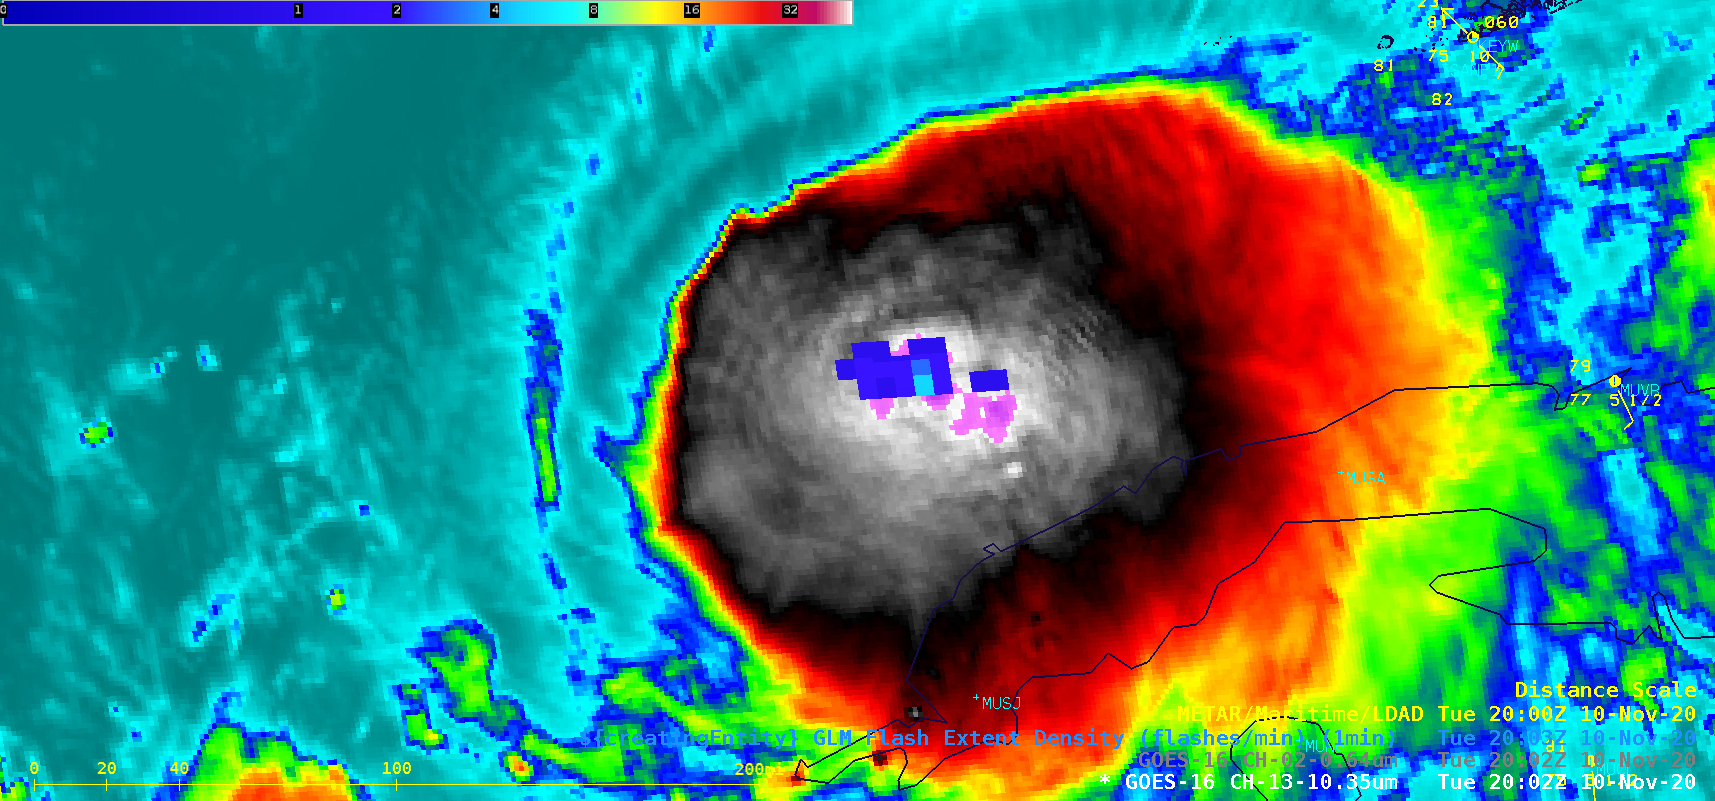
![GOES-16 “Clean” Infrared Window (10.35 µm) images (with and without an overlay of GLM Flash Extent Density) and “Red” Visible (0.64 µm) images [click to play MP4 animation]](https://cimss.ssec.wisc.edu/satellite-blog/images/2020/11/eta_glm-20201110_200250.png)
![GOES-16 “Red” Visible (0.64 µm) images [click to play animation | MP4]](https://cimss.ssec.wisc.edu/satellite-blog/images/2020/11/201111_goes16_visible_Hurricane_Eta_anim.gif)
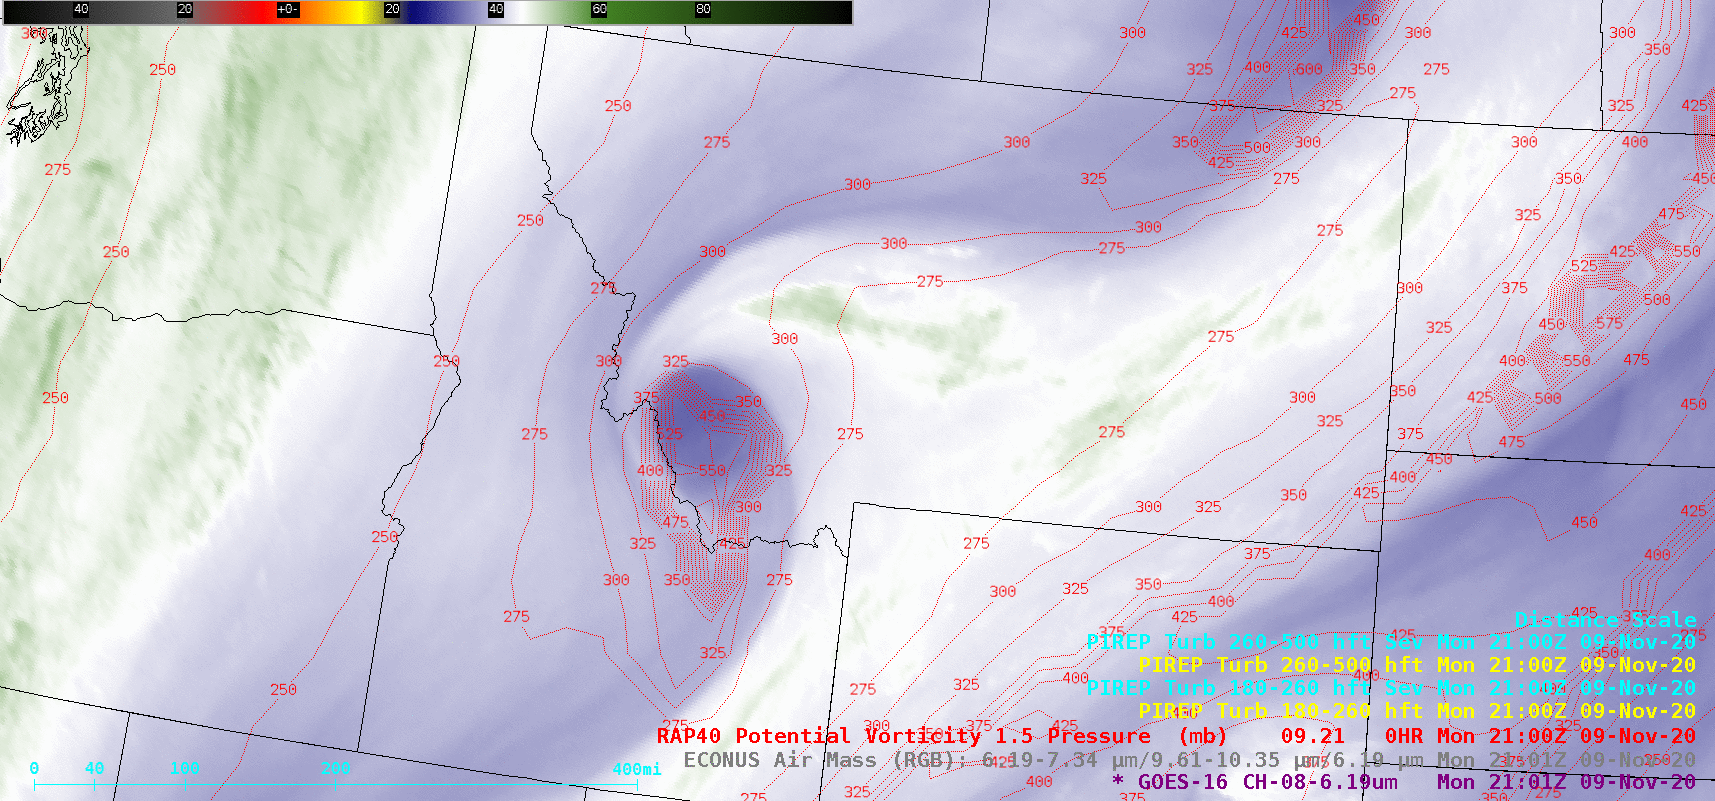
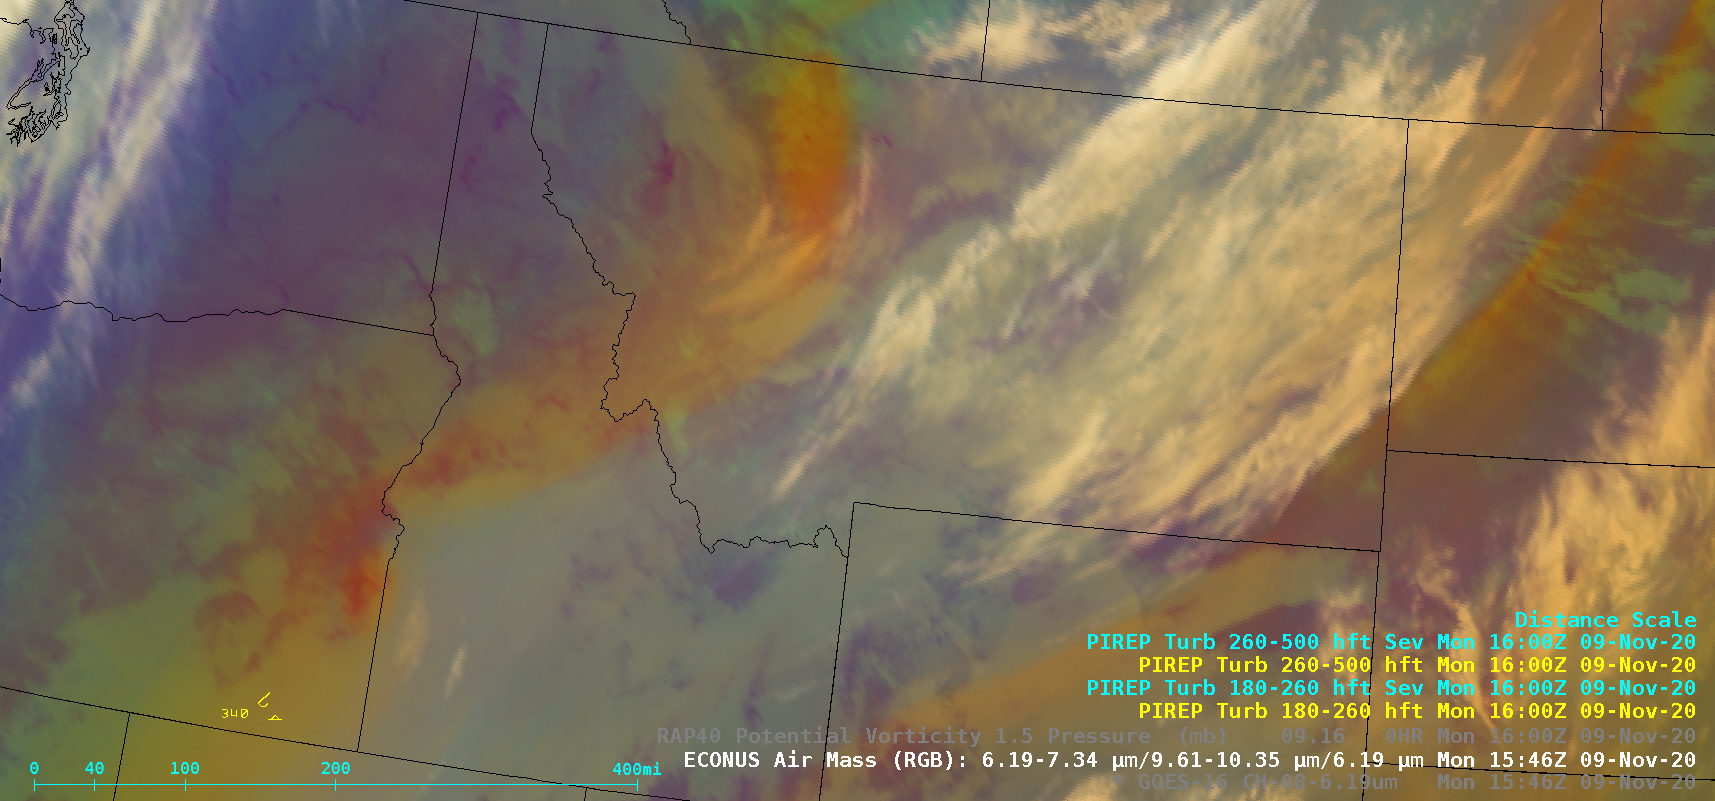
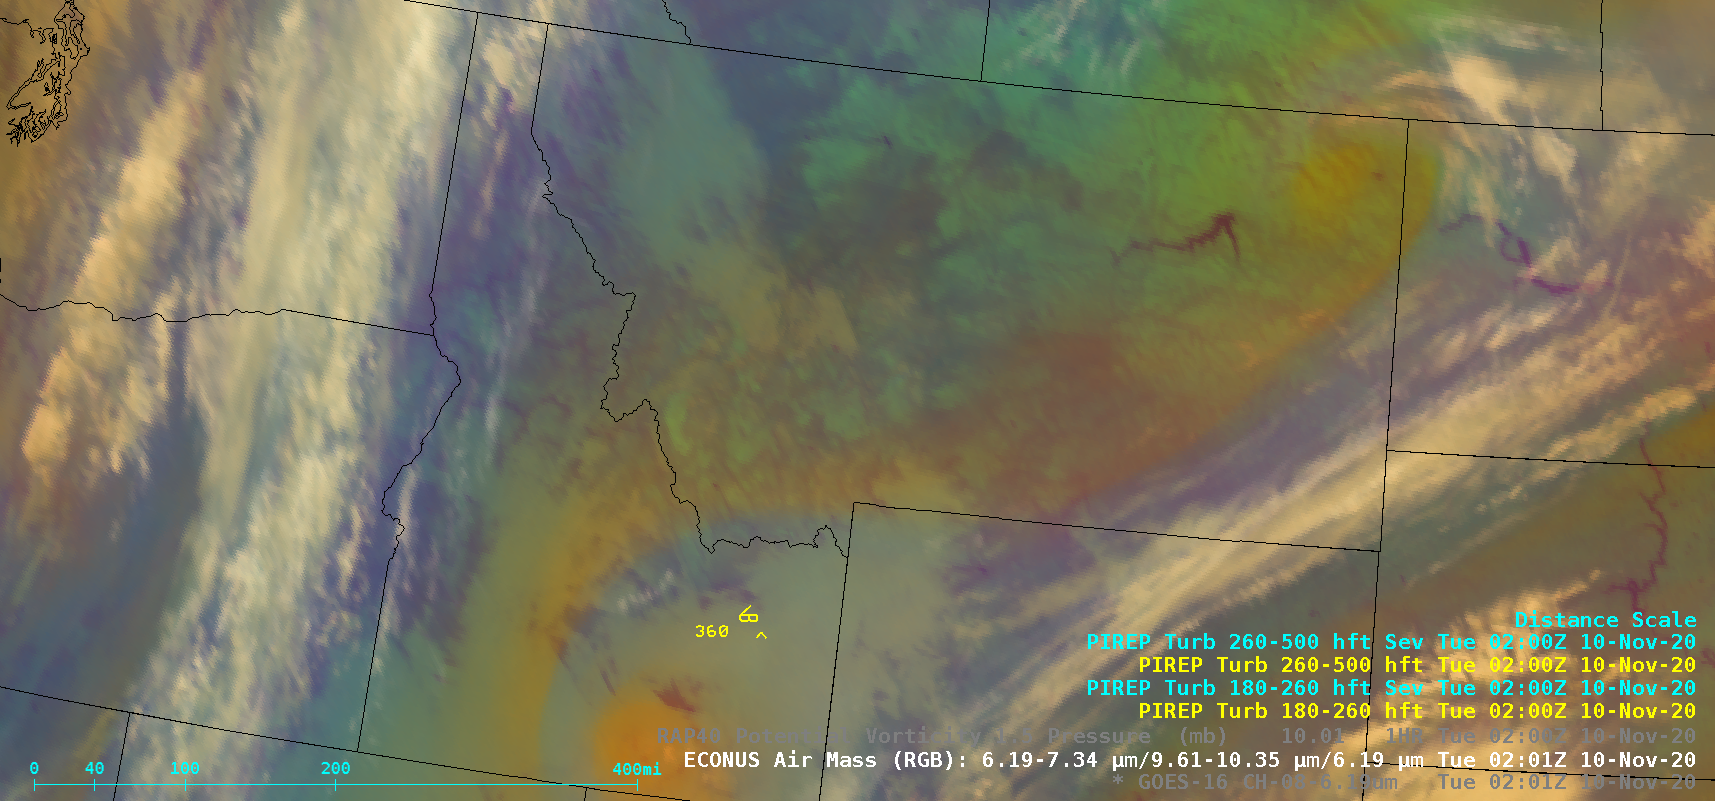
![GOES-16 Upper-level Water Vapor (6.2 µm) and Air Mass RGB images [click to play animation | MP4]](https://cimss.ssec.wisc.edu/satellite-blog/images/2020/11/201109_goes16_waterVapor_airmassRGB_Western_US_pv_anomalies_anim.gif)
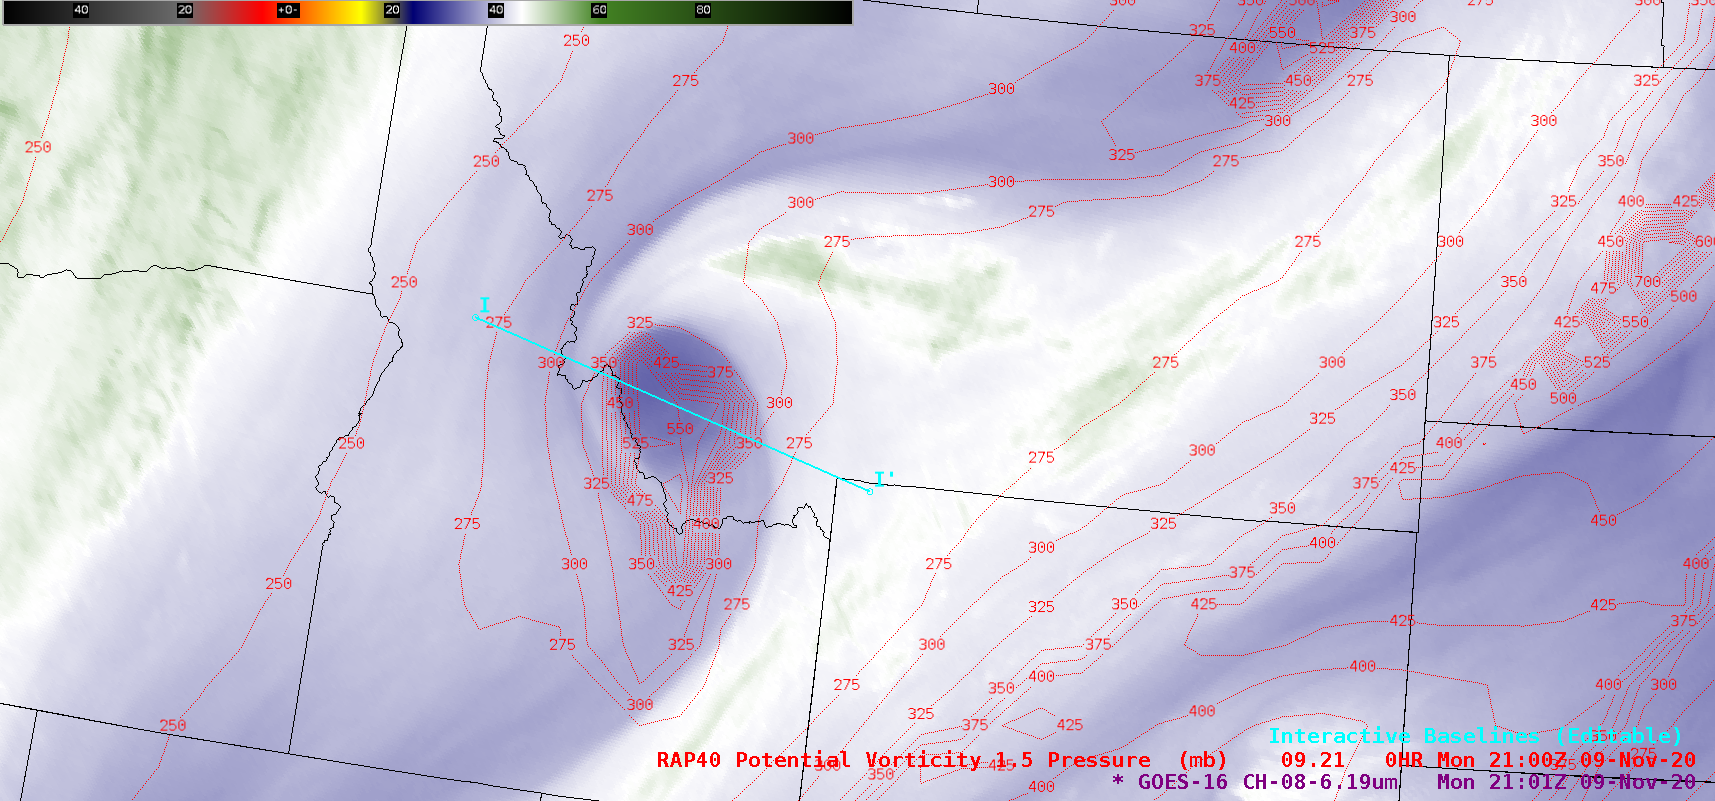
![GOES-16 Upper-level Water Vapor (6.2 µm) image at 2101 UTC, with contours of PV1.5 pressure (red) and the orientation of cross section I-I' (cyan) [click to enlarge]](https://cimss.ssec.wisc.edu/satellite-blog/images/2020/11/wus_wv_xsec-20201109_210112.png)
![Cross section of RAP40 model Potential Vorticity (color image + red contours), Specific Humidity (green contours) and wind barbs (cyan) [click to enlarge]](https://cimss.ssec.wisc.edu/satellite-blog/images/2020/11/wus_xsec-20201109_210000.png)

![Sea Surface Temperature and Ocean Heat Content [click to enlarge]](https://cimss.ssec.wisc.edu/satellite-blog/images/2020/11/201108_seaSurfaceTemperature_oceanHeatContent_TS_Eta_anim.gif)
![GOES-16 Longwave Infrared (11.2 µm) images, with contours of 19 UTC deep-layer wind shear [click to enlarge]](https://cimss.ssec.wisc.edu/satellite-blog/images/2020/11/201108_goes16_ir_19utc_shear_Eta_anim.gif)
