This website works best with a newer web browser such as Chrome, Firefox, Safari or Microsoft Edge. Internet Explorer is not supported by this website.

Detecting Surface Features in Water Vapor Channel Imagery (Part 3)

The strong arctic outbreak of early February 2007 brought an unusually cold and dry air mass over the northcentral and northeastern US. Water vapor channel imagery from the GOES imager and sounder on 05... Read More

GOES, MODIS water vapor images

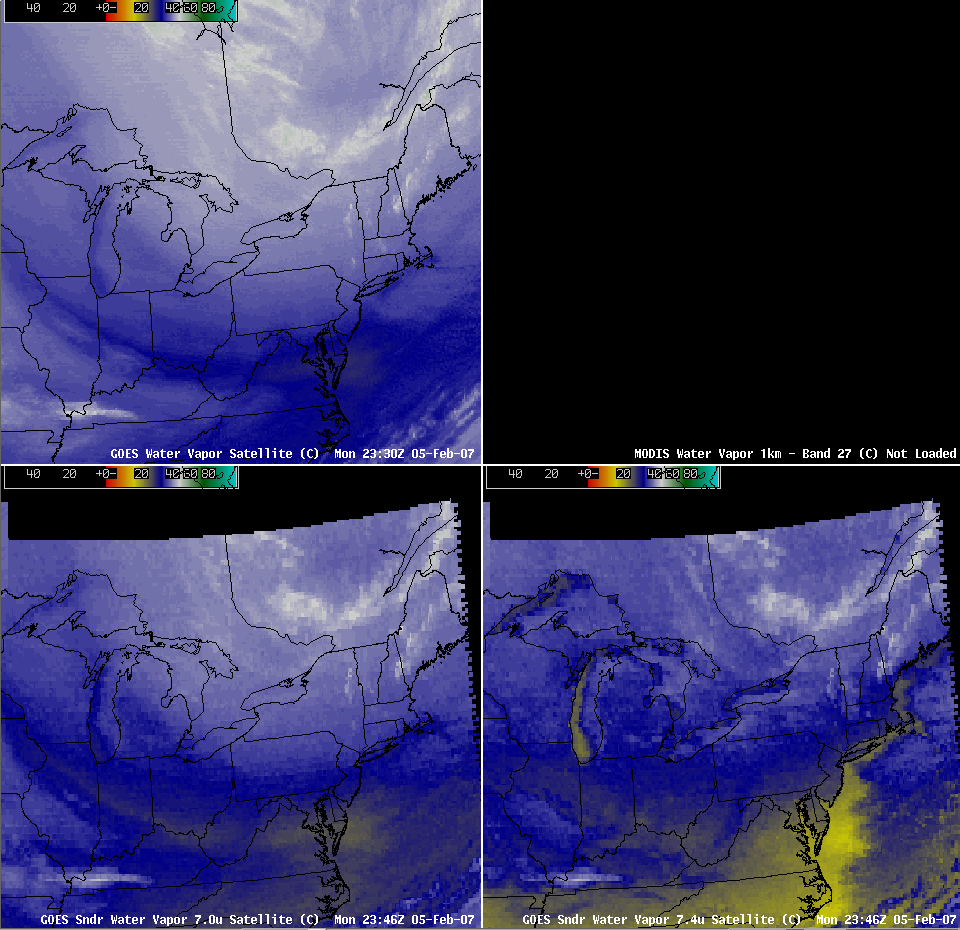
The strong arctic outbreak of early February 2007 brought an unusually cold and dry air mass over the northcentral and northeastern US. Water vapor channel imagery from the GOES imager and sounder on 05 February 2007 (above) showed a surprising result once the map overlay was removed (Java animation) — the outlines of parts of the Great Lakes and the Northeast coasts were clearly evident on the imagery. This is somewhat anomalous, given that the water vapor channel imagery normally depicts features in the middle to upper troposphere.

.
GOES water vapor channel weighting functions calculated using rawinsonde data from Upton, New York at 00 UTC on 06 February 2007 (below) reveal that the GOES imager 6.5 µm water vapor channel (black plot) was detecting radiation from an atmospheric layer that peaked at an unusually low altitude (near 700 hPa), while the GOES sounder 7.4 µm water vapor channel (red plot) was detecting a significant amount of radiation from near the surface. This enabled a signal of the strong surface thermal contrast (very cold land surfaces adjacent to relatively warm bodies of water) to “bleed up” through what little water vapor was present in the atmospheric column, allowing us to see coastal outlines across the Great Lakes and Northeast US regions on the water vapor channel imagery.
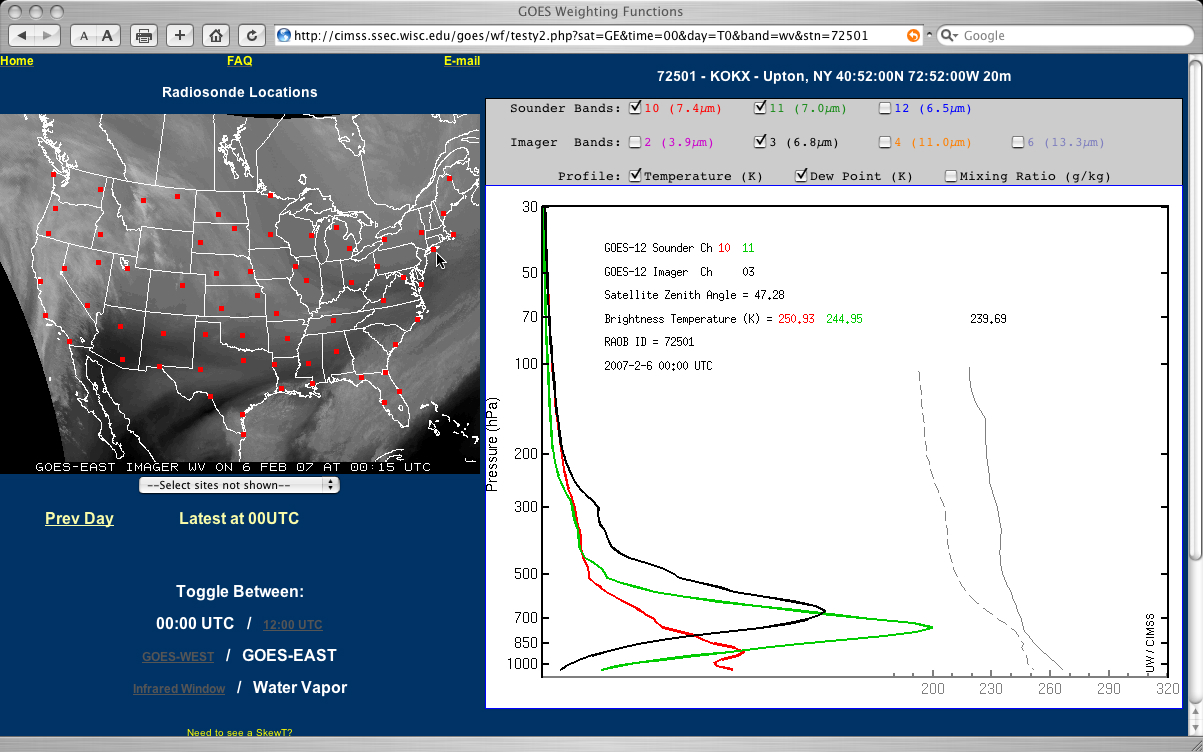
Upton NY water vapor channel weighting functions

View only this post Read Less

Migrating drift ice

As a follow-up to the previous blog post, cold air and lake-effect snow continued across the Great Lakes region on 05 February 2007. GOES-12 visible imagery (above; Java animation) revealed a narrow filament of Read More

GOES-12 visible image

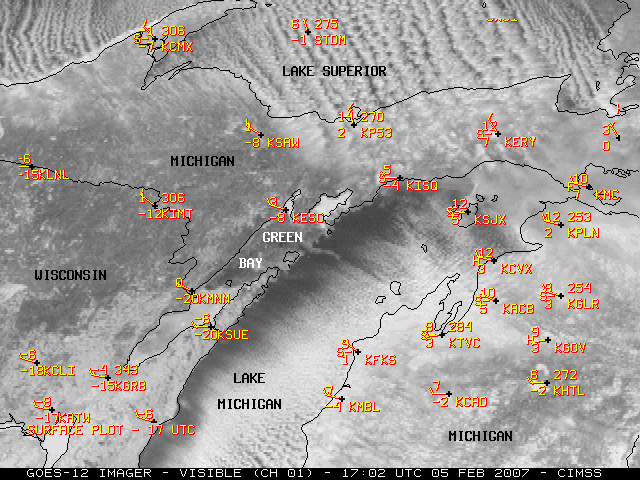
As a follow-up to the previous blog post, cold air and lake-effect snow continued across the Great Lakes region on 05 February 2007. GOES-12 visible imagery (above; Java animation) revealed a narrow filament of drift ice that was being pushed by strong winds eastward out of the northern portion of Green Bay (just north of Washington Island) and into Lake Michigan. An AWIPS image of the MODIS sea surface temperature (SST) product indicated that lake water temperatures had cooled to the 32º to 41º F (0º to +5º C) range off the coast of Wisconsin. Also, note how the motion of the lake-effect snow bands over Lake Superior (in northern portion of the images) changes during the day, as the boundary layer winds develop more of a westerly component. Finer detail in the drift ice structure in Green Bay and northern Lake Michigan can be seen on a 500-m resolution MODIS true color image (below); drift ice coverage was also increasing in southern Lake Michigan, from Milwaukee WI to Chicago IL to South Bend IN.

MODIS true color image

View only this post Read Less

Cold Air + Warm Water = Lake-Effect Snow

The coldest air of the 2006-2007 winter season (surface temperatures on 04 February 2007 were as cold as -42º F / -41º C at Embarrass, Minnesota, -31º F / -35º C at Tomahawk, Wisconsin, and -21º F / -29º C at Randville,... Read More

MODIS true color image of Great Lakes region

The coldest air of the 2006-2007 winter season (surface temperatures on 04 February 2007 were as cold as -42º F / -41º C at Embarrass, Minnesota, -31º F / -35º C at Tomahawk, Wisconsin, and -21º F / -29º C at Randville, Michigan) was flowing over the still-warm waters of the Great Lakes (water temperatures were generally +35º to +41º F / +2º to +5º C), producing widespread bands of lake-effect snow (LES) which were very apparent on MODIS true color imagery (above). Note the transition from a multiple-LES-band regime over Lakes Superior and Michigan to more of a single-LES-band regime over Lakes Erie and Ontario (below). If you look closely, you can see that ice was beginning to form along portions of the northern shore of Lake Superior, as well as along the western shore of Lake Michigan and Lake Huron. The cold temperatures were limiting snow crystal growth (creating a fine, powdery snow), but snowfall accumulations still managed to reach amounts of 17 inches / 43 cm at Grandville in lower Michigan and 12 inches / 30 cm at Rainbow Lodge in the Upper Peninsula of Michigan; farther to the east, 18 inches / 46 cm fell at Boston in western New York. The strong winds were also producing wind chill temperatures in the -30º to -40º F / -34º to -40º C range across parts of Minnesota, Iowa, and Wisconsin.

MODIS true color image of Lake Superior

MODIS true color image of Lake Michigan

MODIS true color image of Lakes Erie and Ontario

View only this post Read Less

Fatal tornado outbreak in Florida

GOES-12 10.7µm InfraRed (IR) imagery (above; Java animation) shows the development of multiple lines of convection that produced numerous reports of damaging winds and tornadoes across northern and central Florida during the pre-dawn hours  on Read More

GOES-12 10.7µm IR image
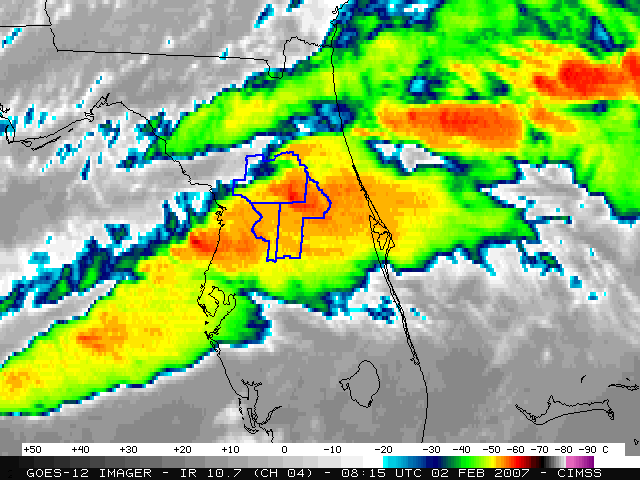
GOES-12 10.7µm InfraRed (IR) imagery (above; Java animation) shows the development of multiple lines of convection that produced numerous reports of damaging winds and tornadoes across northern and central Florida during the pre-dawn hours  on 02 February 2007. The counties where damaging winds and/or tornadoes were reported are highlighted in blue around the times of the SPC storm reports. At least 3 of these tornadoes have been rated as producing EF-3 damage, and 20 deaths have been reported so far as a result of these storms. While fairly cold IR cloud top temperatures were noted at times (-60º to -66º C, red to dark red enhancement), there were no “enhanced-V” or other typical severe storm IR signatures associated with this convection.

.
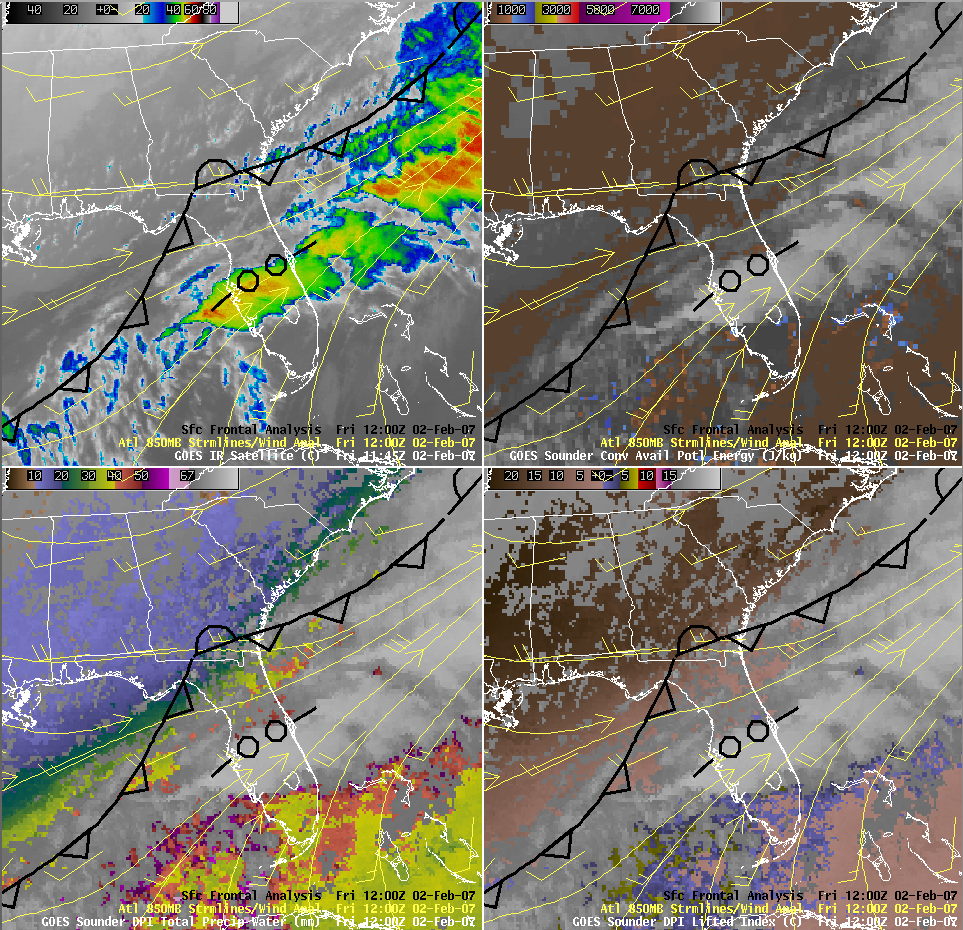
These supercells formed within an environment of high vertical wind shear, which enabled the thunderstorm updrafts to develop strong rotation; in addition, a strong upper tropospheric jet stream was located over the southeastern US, producing high wind speeds aloft and supporting large-scale lift over Florida. The lines of severe convection were forming within a zone of pre-frontal lower-tropospheric convergence; while it was too cloudy to sample the immediate pre-convective environment, GOES-12 sounder derived product imagery (DPI) at 00 UTC and at 12:00 UTC (below) did show that the air mass ahead of the approaching frontal boundary was relatively moist (PW values of 40-50 mm) with modest winter-season instability (LI values of 0º to -6º C, CAPE values of 0 to 1000 J/kg).
AWIPS images of GOES sounder derived products

View only this post Read Less