Exploring the effect of parallax
![GOES-16 "Red" Visible (0.64 µm) images, including plot of SPC Storm Reports (with and without parallax correction) [click to play animation]](https://cimss.ssec.wisc.edu/satellite-blog/images/2020/01/200110_goes16_visible_spcStormReports_parallax_KS_MO_OK_AR_anim.gif)
GOES-16 “Red” Visible (0.64 µm) images, including plot of SPC Storm Reports (with and without parallax correction) [click to play animation]
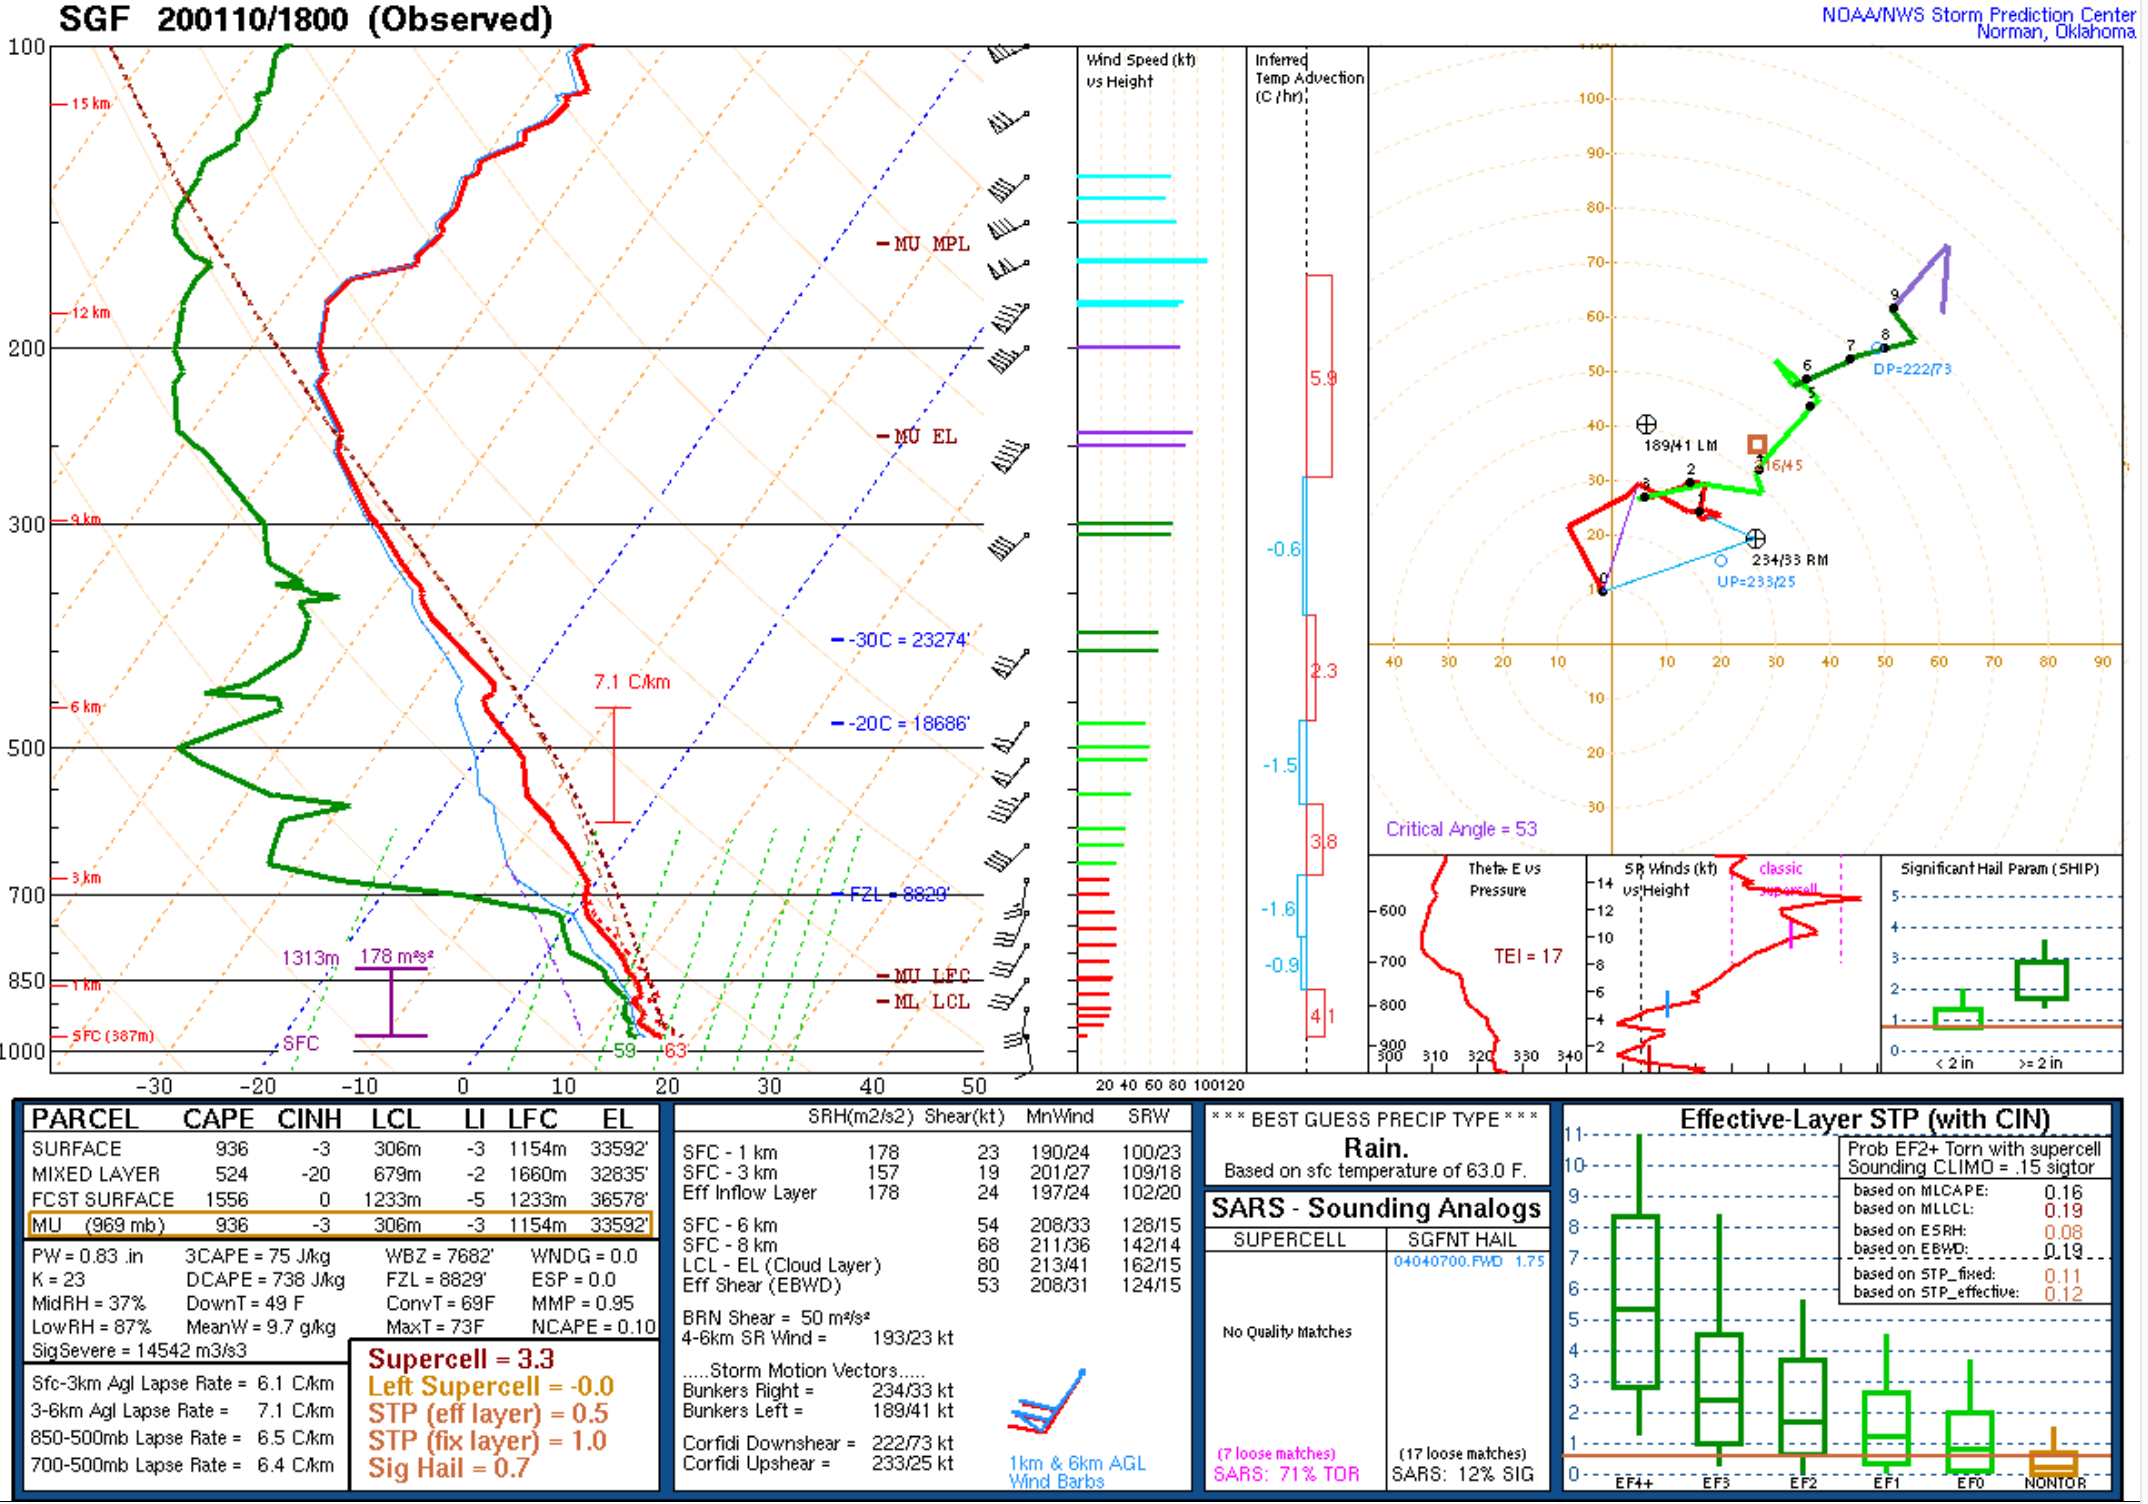
The GOES-16 Visible images for the times corresponding to the 2 tornado reports (below) include “parallax-corrected” — shifted upward to match a 13 km cloud top, the Maximum Parcel Level calculated from the 18 UTC Springfield, Missouri sounding — and actual surface locations for each report. For the Oklahoma tornado report, the parallax-corrected location more closely matches the location of overshooting tops; for the Missouri tornado report, the parallax-corrected location more closely matches the location where a cluster of overshooting tops had passed several minutes earlier.
![GOES-16 "Red" Visible (0.64 µm) image at 2030 UTC, including plot of SPC Storm Reports (with and without parallax correction) [click to enlarge]](https://cimss.ssec.wisc.edu/satellite-blog/images/2020/01/200110_2030utc_goes16_visible_spcStormReport_parallax_anim.gif)
GOES-16 “Red” Visible (0.64 µm) image at 2030 UTC, including a Tornado report in Missouri (with and without parallax correction) [click to enlarge]
![GOES-16 "Red" Visible (0.64 µm) image at 2051 UTC, including plot of Tornado report (with and without parallax correction) [click to enlarge]](https://cimss.ssec.wisc.edu/satellite-blog/images/2020/01/200110_2051utc_goes16_visible_spcStormReport_parallax_anim.gif)
GOES-16 “Red” Visible (0.64 µm) image at 2051 UTC, including a Tornado report in Oklahoma (with and without parallax correction) [click to enlarge]
![GOES-16 parallax direction vectors and magnitude (km) for a cloud top feature at 15 km [click to enlarge]](https://cimss.ssec.wisc.edu/satellite-blog/images/2020/01/200110_KS_MO_parallax.png)
GOES-16 parallax direction vectors and magnitude (km) for a cloud top feature at 50,000 feet (15.2 km) [click to enlarge]
![GOES-17 parallax correction direction vectors and magnitude (km) for a cloud top feature at 50,000 feet (15.2 km) [click to enlarge]](https://cimss.ssec.wisc.edu/satellite-blog/images/2020/01/goes17_parallax_fulldisk.png)
GOES-17 parallax direction vectors and magnitude (km) for a cloud top feature at 50,000 feet (15.2 km) [click to enlarge]