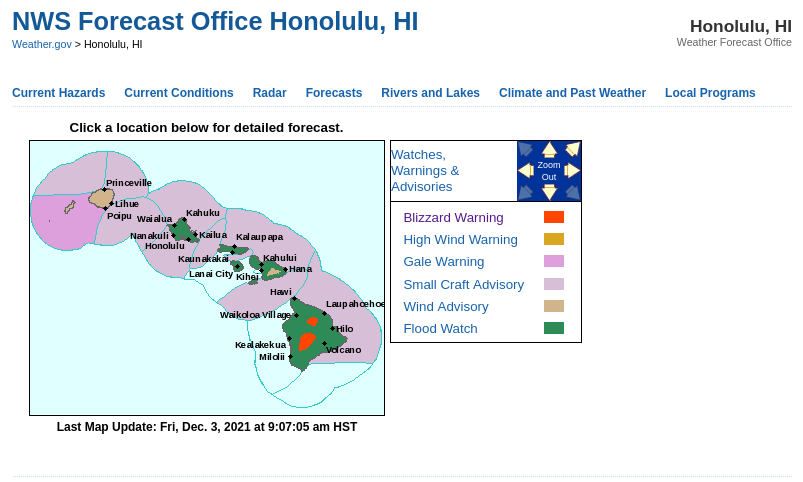
The highest peaks of the Big Island of Hawai’i are under Blizzard warnings as of early 3 December 2021, as shown in the screen capture below from the National Weather Service in Honolulu.
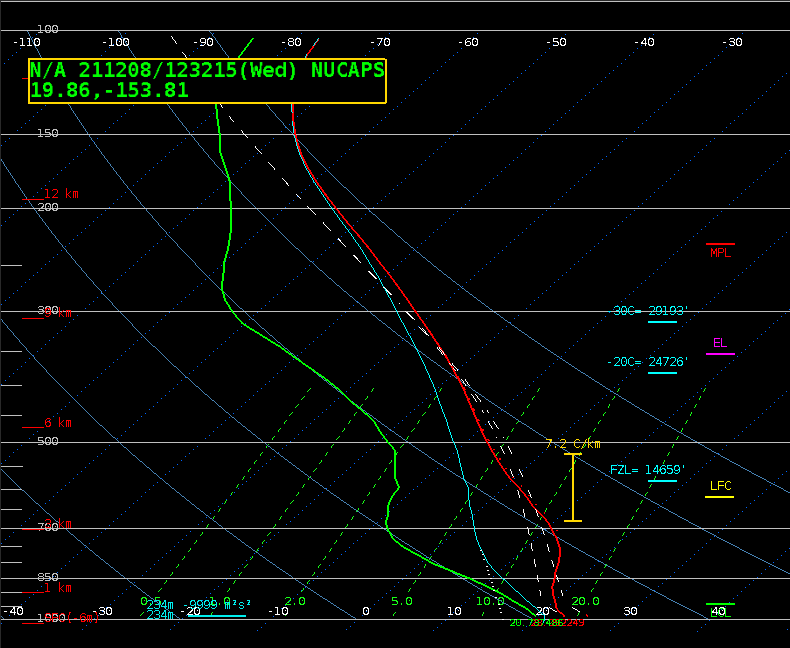
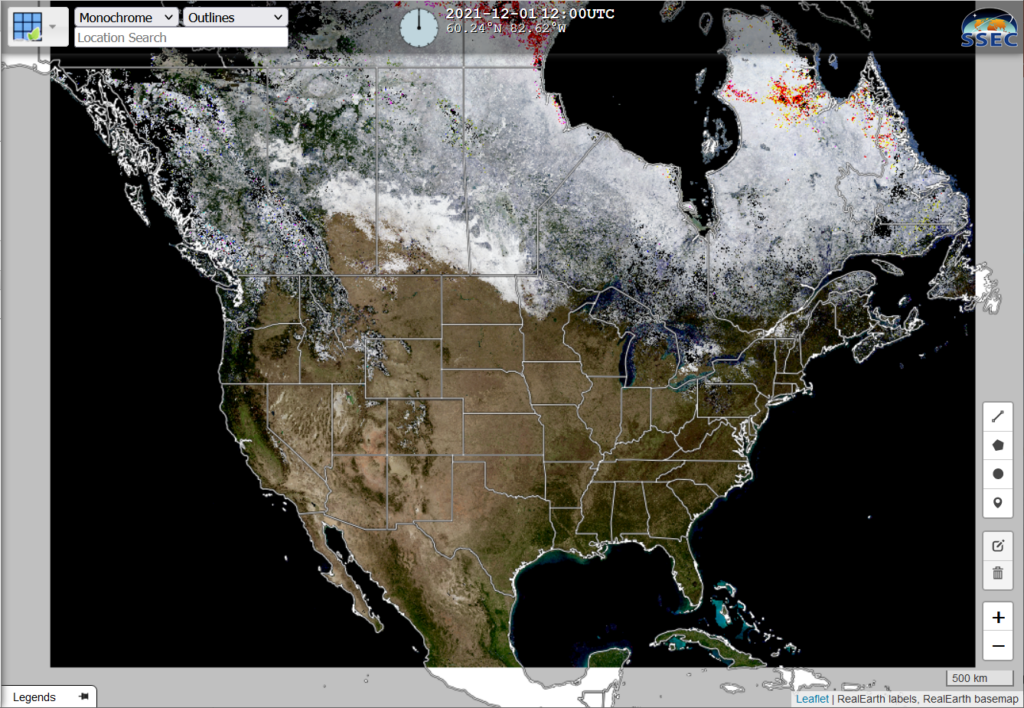
The image above shows NUCAPS Sounding Availability in AWIPS over the central Pacific. A long swath of profiles was available from a NOAA-20 overpass near 1200 UTC. Each of the dots represents a profile of temperature and moisture over the Pacific, a large region with little observational data. These retrieved profiles can give useful information about the structure of the atmosphere in advance of a storm. In this case, moisture is apparent, and so is mid-tropospheric drying; thus, evaporational cooling from precipitation might be important. The freezing level of the profiles is also shown, and most values are near 12500′. (Mauna Loa and Mauna Kea top out at 13,679′ and 13,803′, respectively). Note that the relatively low freezing levels extend far to the south, as shown in this NUCAPS profile at 17.3N, 160 W, at the southern edge of the domain above!
Two of the NUCAPS soundings in the animation above are near upper-air radiosondes at Hilo and at Lihue. A toggle between the Hilo sounding and NUCAPS profile is just below; underneath that profile is the toggle between the Lihue soundings and the adjacent NUCAPS profile. Keep in mind with these comparisons that the radiosonde is a sensor at one point moving up through the atmosphere whereas the NUCAPS profile represents a large volume of air. Gross aspects of the two soundings agree: moisture in the levels, dry air aloft.
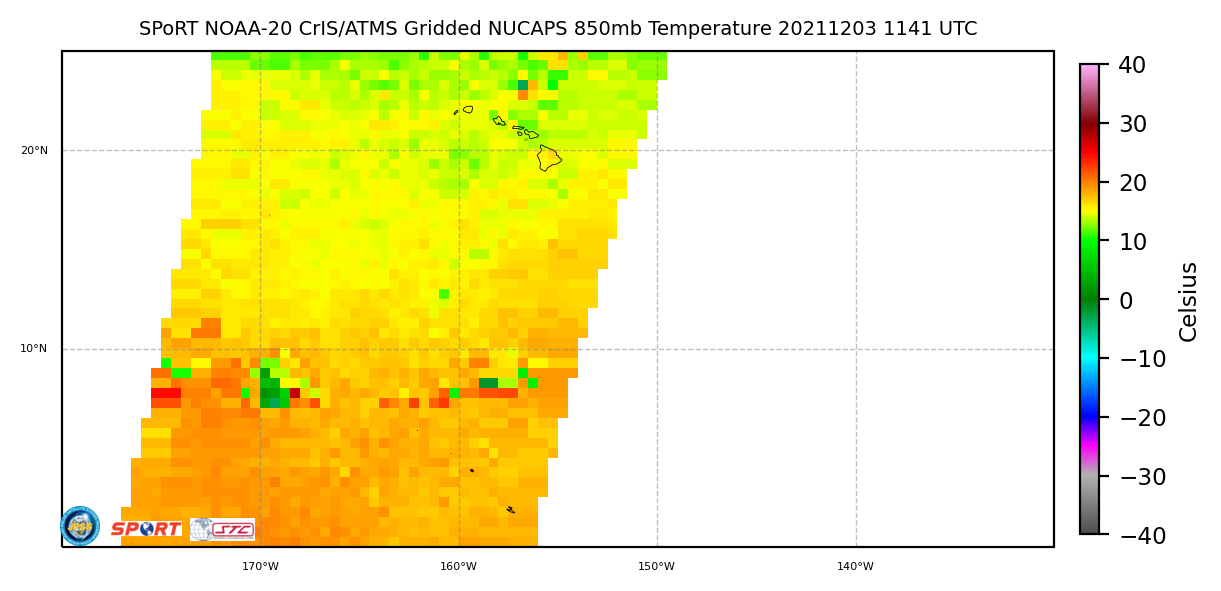
Individual NUCAPS profiles can be aggregated into gridded fields to depict values along horizontal surfaces. These can be found at this website, for example, from SPoRT. The 850-mb field (a level far below the peaks!) shows temperatures near freezing not too far north of Hawai’i.
AWIPS tip: It can be tedious to load up individual soundings. PopUp SkewTs can be used in AWIPS to quickly scan through the profiles to identify any threshold values. PopUp SkewTs can be accessed under the Volume Browser.
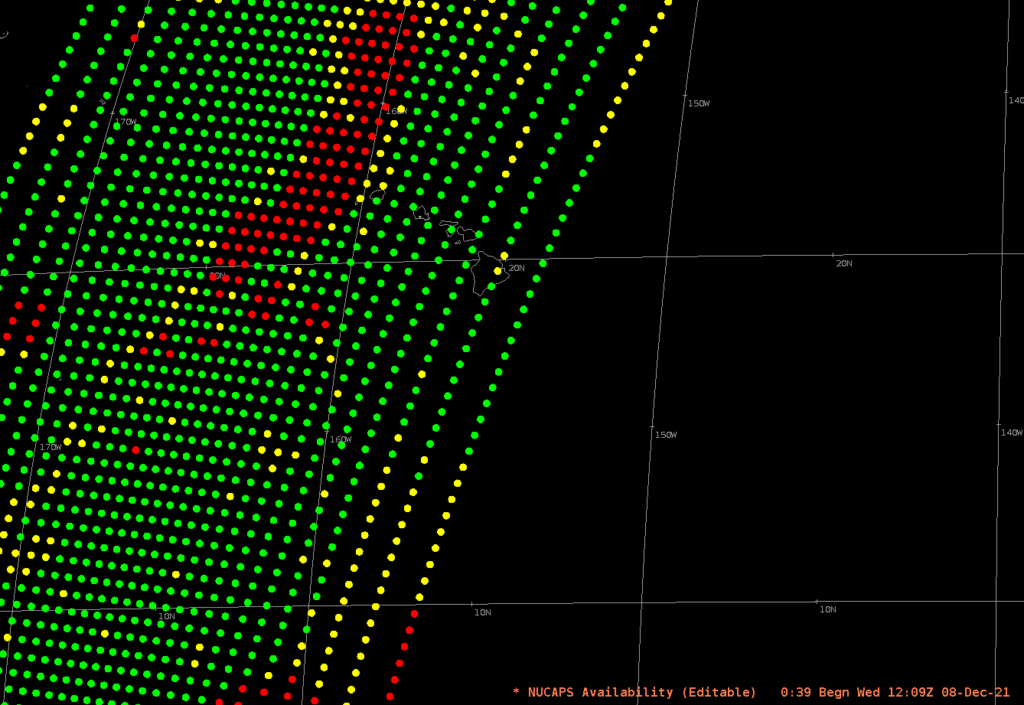
Added, 8 December 2021: The NUCAPS Sounding Availability plot, above, shows a swath several days after the snow, and after warmer air has moved in from the east. The easternmost sounding just south of 20 N, below, shows a freezing level closer to 14600′!
View only this post Read Less


