Previous blog posts (example) have documented how to create imagery from the VIIRS instrument, and this one is another example. For example, if you receive a request for VIIRS imagery such as this one: “If you have time to try a case, you could pick Feb 1, 2022 near North Pole Point for 11 um channel” — how do you proceed? A first step is to determine the day/time of the data, and that’s achieved by looking at orbits over the Arctic, at this website. That website also has an archive, and the archive for Arctic passes on 1 February 2022 is here. The image shows NOAA-20 passing over Greenland, the Arctic Ocean, and then moving over eastern Russia between 1455 and 1510 UTC on 1 February 2022. Now you know the times to request.
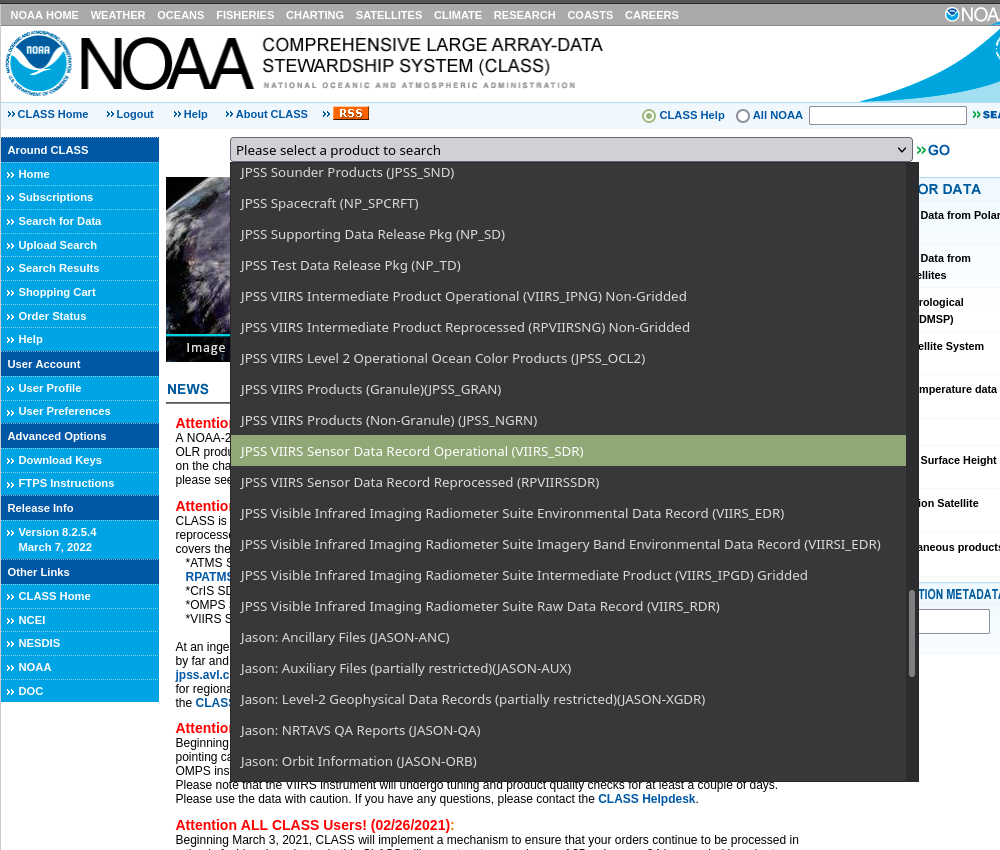
NOAA CLASS is the data repository that stores VIIRS imagery from NOAA-20 and Suomi-NPP. Go to the website, an log in (register if you have not already), and choose JPSS VIIRS SDRs (Operational Sensor Data Records) as shown below. Choosing those data and clicking >>GO to the right of the drop-down menu bar will move you to a new data-selection menu, where you will select the day/time of the data (1 February 2022, 14:55 Start time, 15:10 end time), and the band (I chose SVI05 — the 11.45 µm Imager channel, with 375-m resolution, that is: VIIRS Imagery Band 05 SDR (SVI05) (public 02/07/2012) ), and the satellite (NOAA-20). Geolocation data must also be selected, and Polar2Grid will expect the GITCO files. Choose them ( VIIRS Image Bands SDR Ellipsoid Terrain Corrected Geolocation (GITCO) (public 02/07/2012)) as well. It is very important, however, that your User Preferences are configured so that the data are disaggregated! Click on User Preferences, and make that selection. The User Preferences page should include information as shown here.
The steps above will produce 12 matches — 6 files of SVI05 and 6 GITCO files. Submit your order and wait for the email notification that the files are ready. While you are waiting, if you’ve not done so already, download the Polar2Grid software from CIMSS CSPP Site (CSPP: Community Satellite Processing Package; note that a free registration might be required). Expand the downloaded (compressed tar) file into an empty directory, and enter this unix command: export POLAR2GRID_HOME=/directory/where/the/expanded/file/sits.
NOAA CLASS will send an email once the data are staged and ready for you. Download those data, and then enter this command:
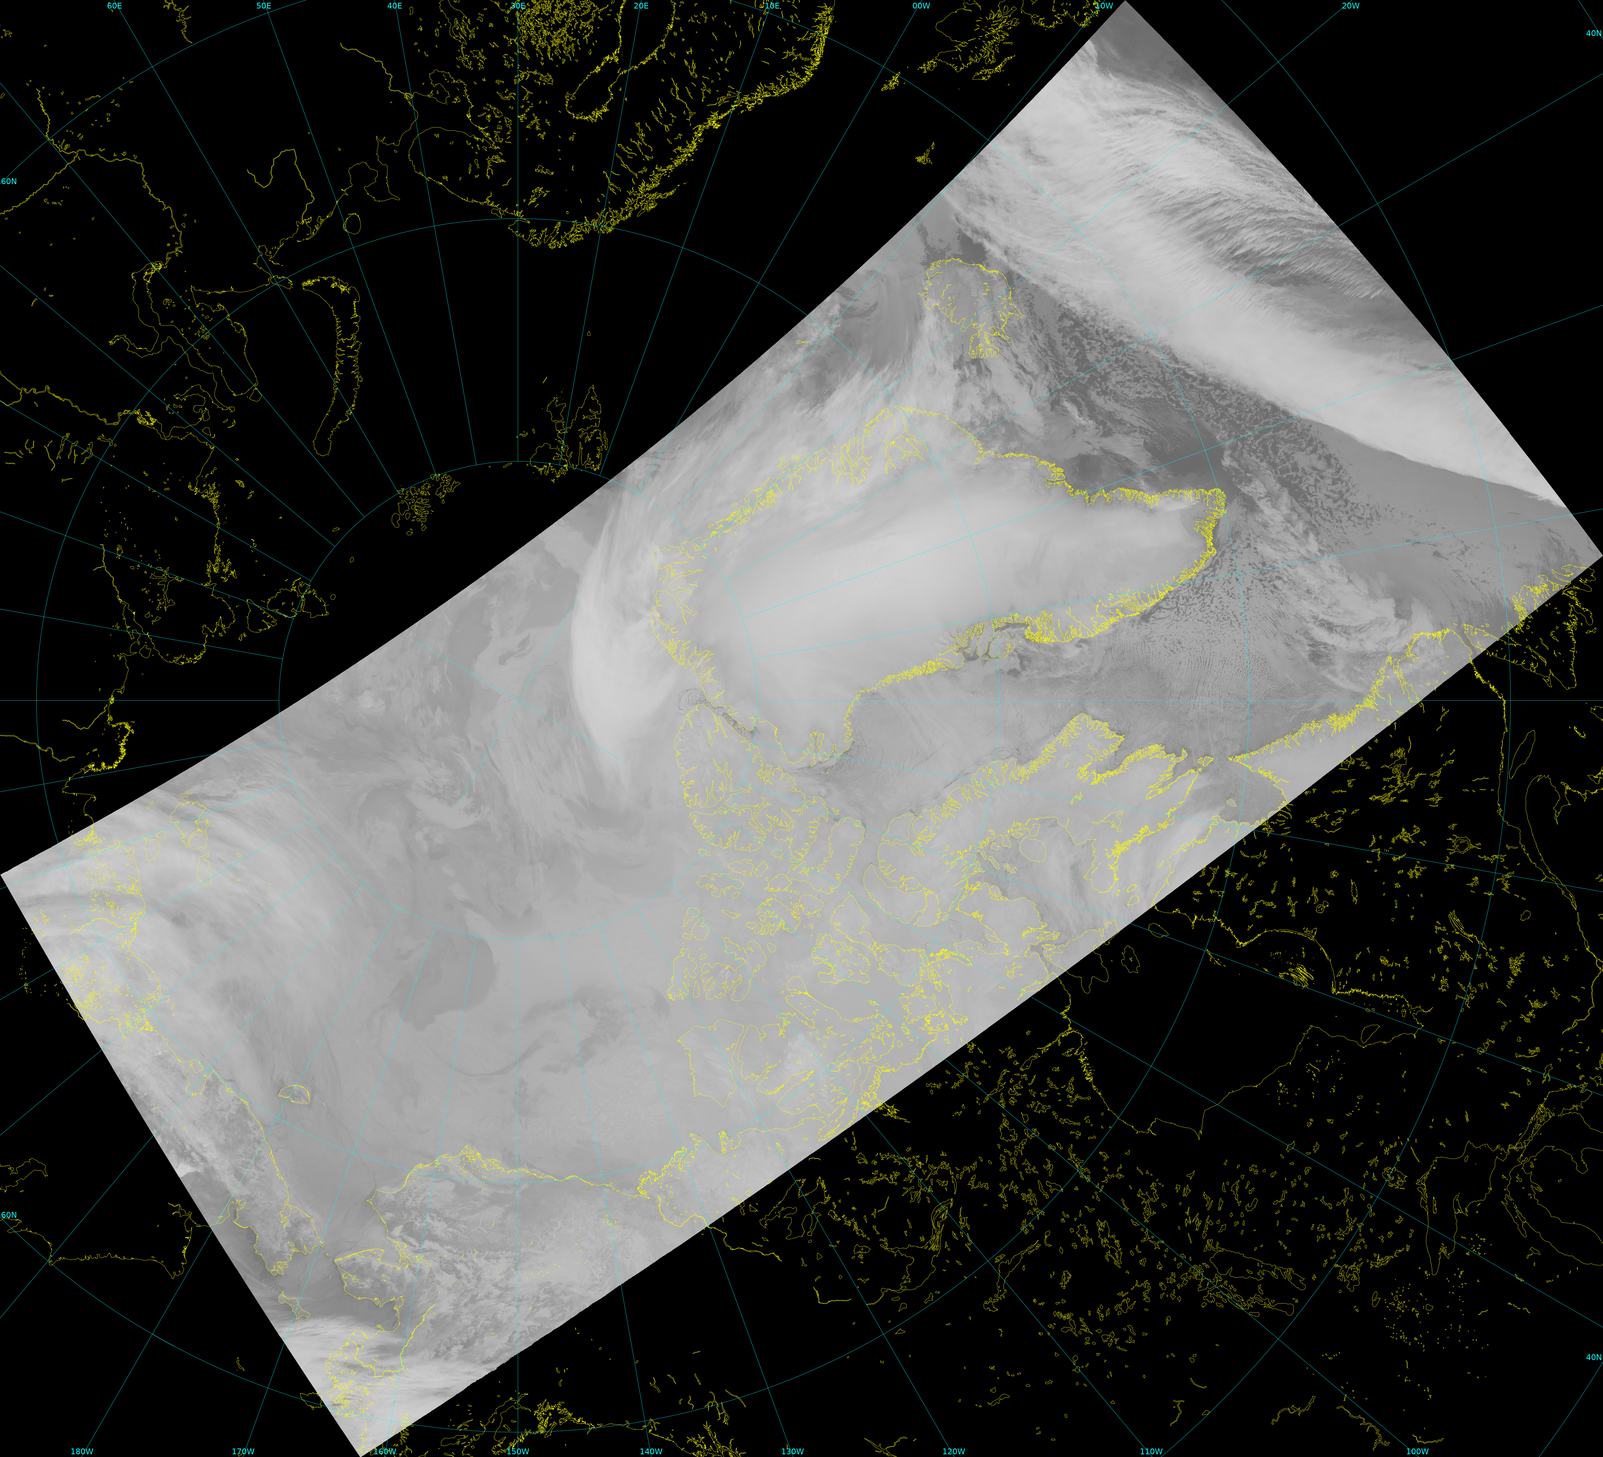
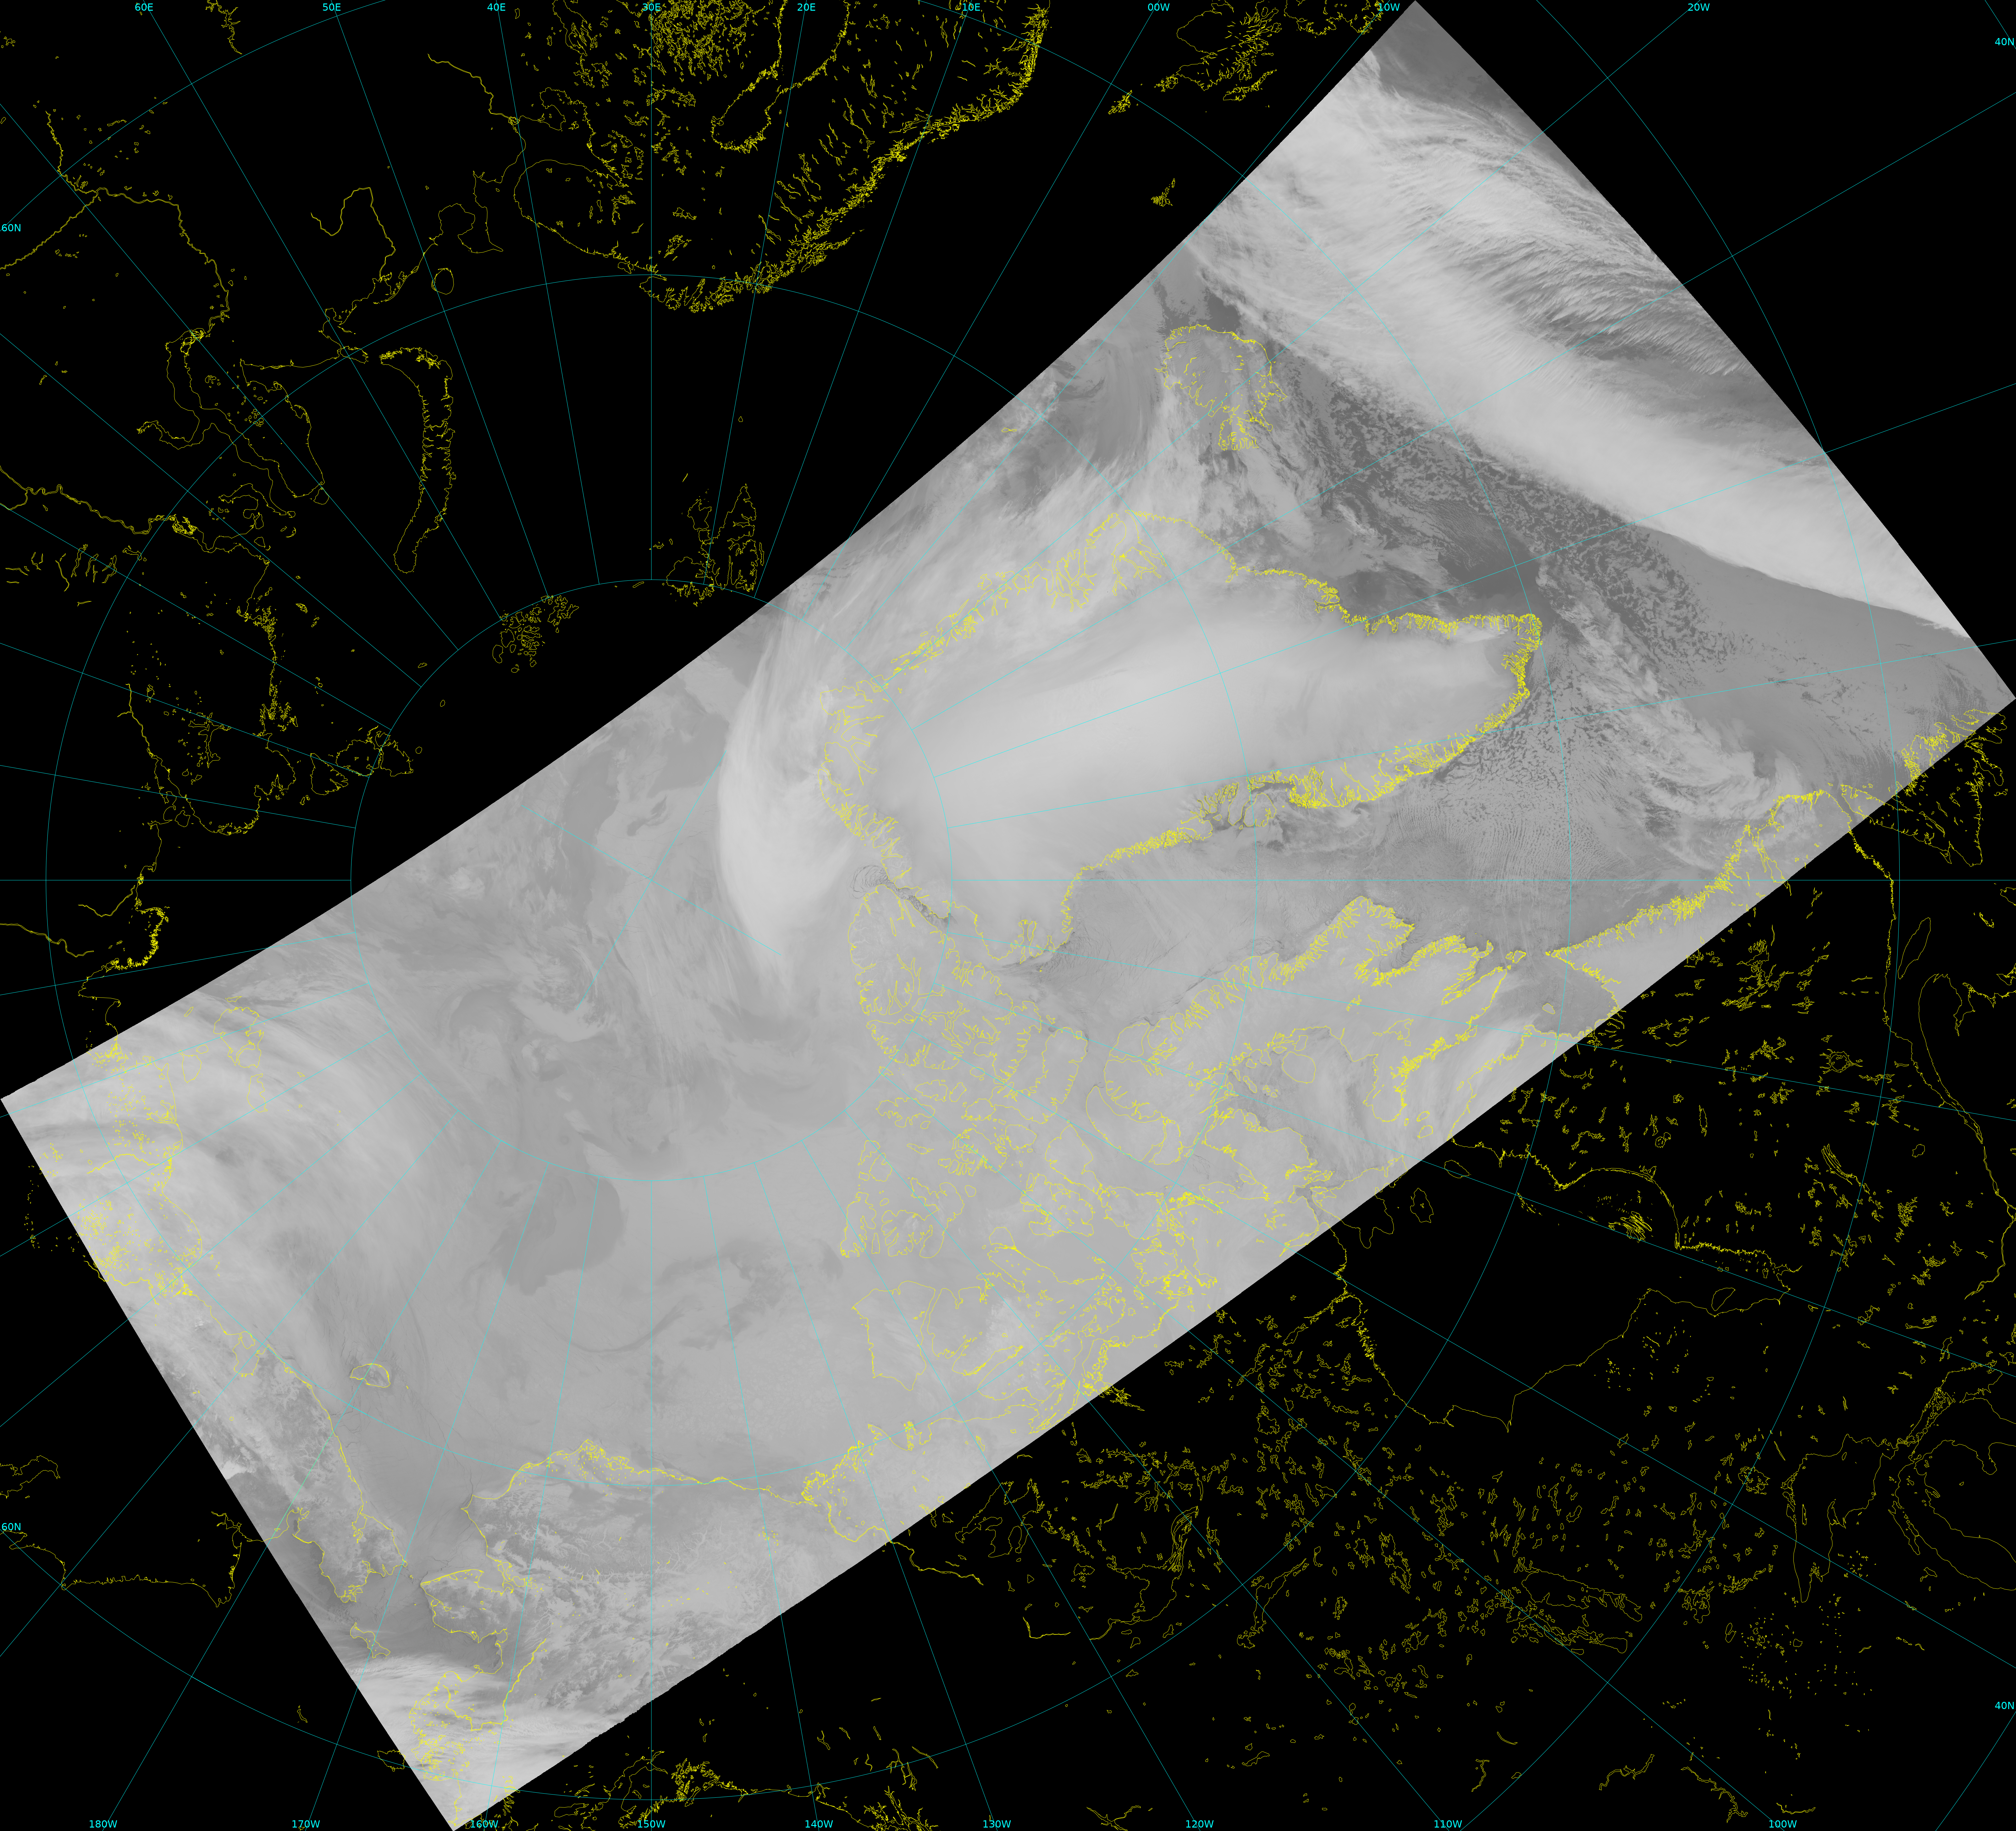
sh ./polar2grid.sh viirs_sdr gtiff -p i05 -g polar_canada -f /directory/holding/downloaded/SVI05Data/SVI05* /directory/holding/downloaded/GITCOdata/GITCO*
That code takes the viirs_sdr and GITCO data pointed to by the -f flag and creates a geotiff of i05 (11.45) imagery. Because these data are near the Pole, I’ve specified a grid (‘-g polar_canada’) to be used (a full list of pre-defined grids is here, part of the Polar2Grid online documentation). The command will stitch together the data in the 6 different files, and you’ll see an image at full resolution, as shown above. I also used software to add coastlines and lat/lon (‘grid’) lines.
sh ./add_coastlines.sh --add-grid --grid-D 10 10 --grid-d 10 10 --add-coastlines noaa20_viirs_i05_20220201_145336_polar_canada.tif
View only this post Read Less


