
GOES-16 (GOES-East) Dust RGB images (above) highlighted the development of widespread blowing dust (brighter shades of pink/magenta) across northern Chihuahua, Mexico and parts of Texas, New Mexico and Oklahoma on 29 March 2022. Strong winds within the corridor between a dryline and an approaching cold front were gusting as high as 65 knots — and the lofted... Read More
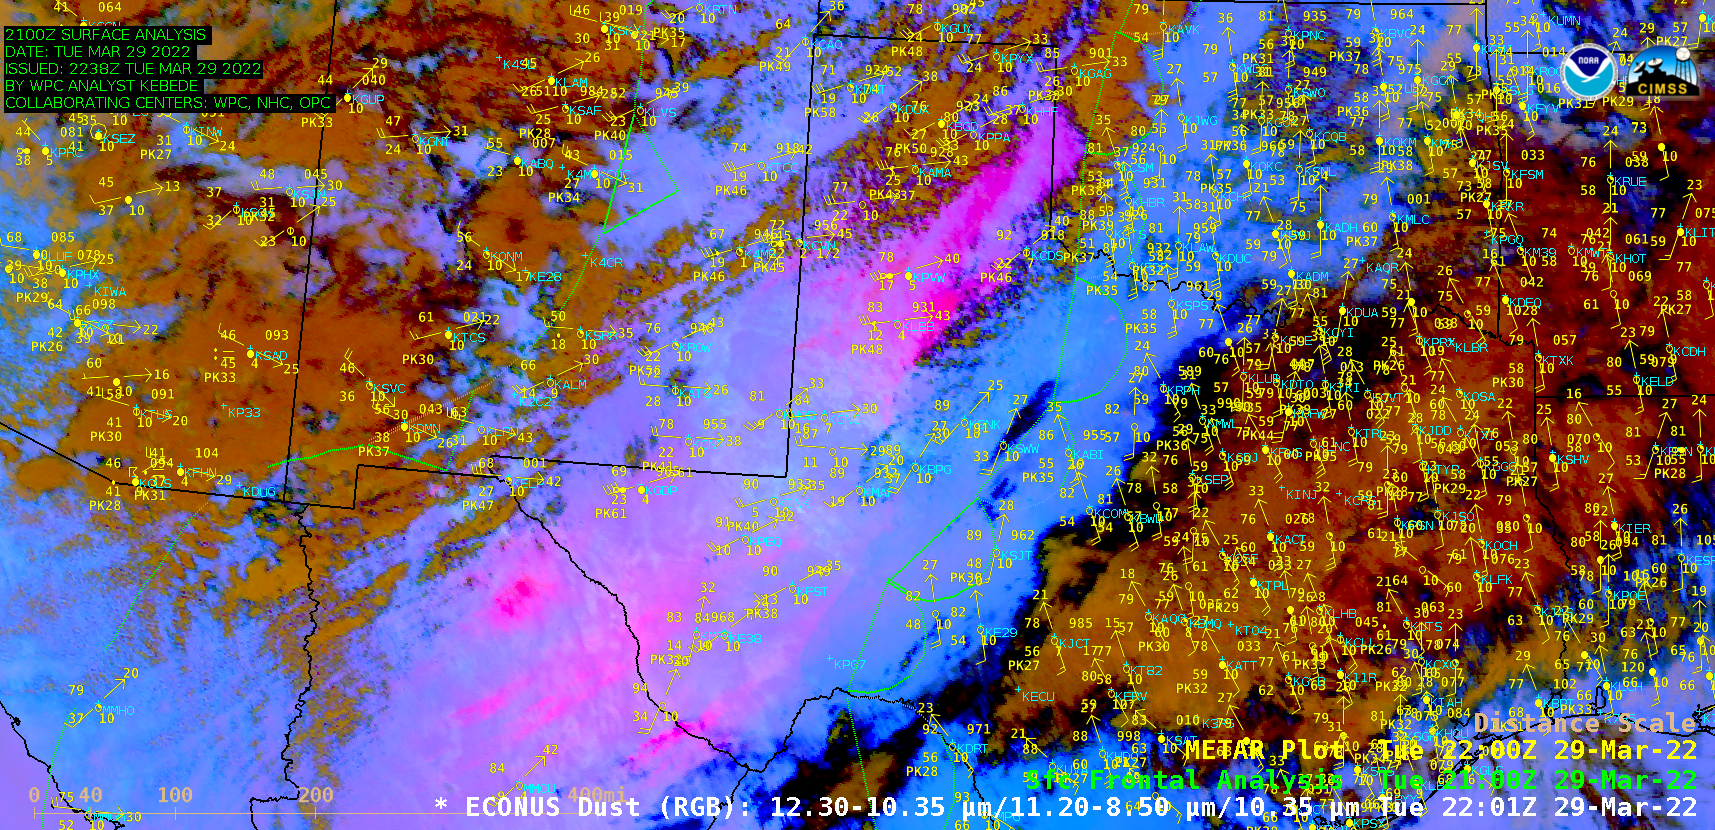
GOES-16 Dust RGB images [click to play animated GIF | MP4]
GOES-16
(GOES-East) Dust RGB images
(above) highlighted the development of widespread blowing dust
(brighter shades of pink/magenta) across northern Chihuahua, Mexico and parts of Texas, New Mexico and Oklahoma on
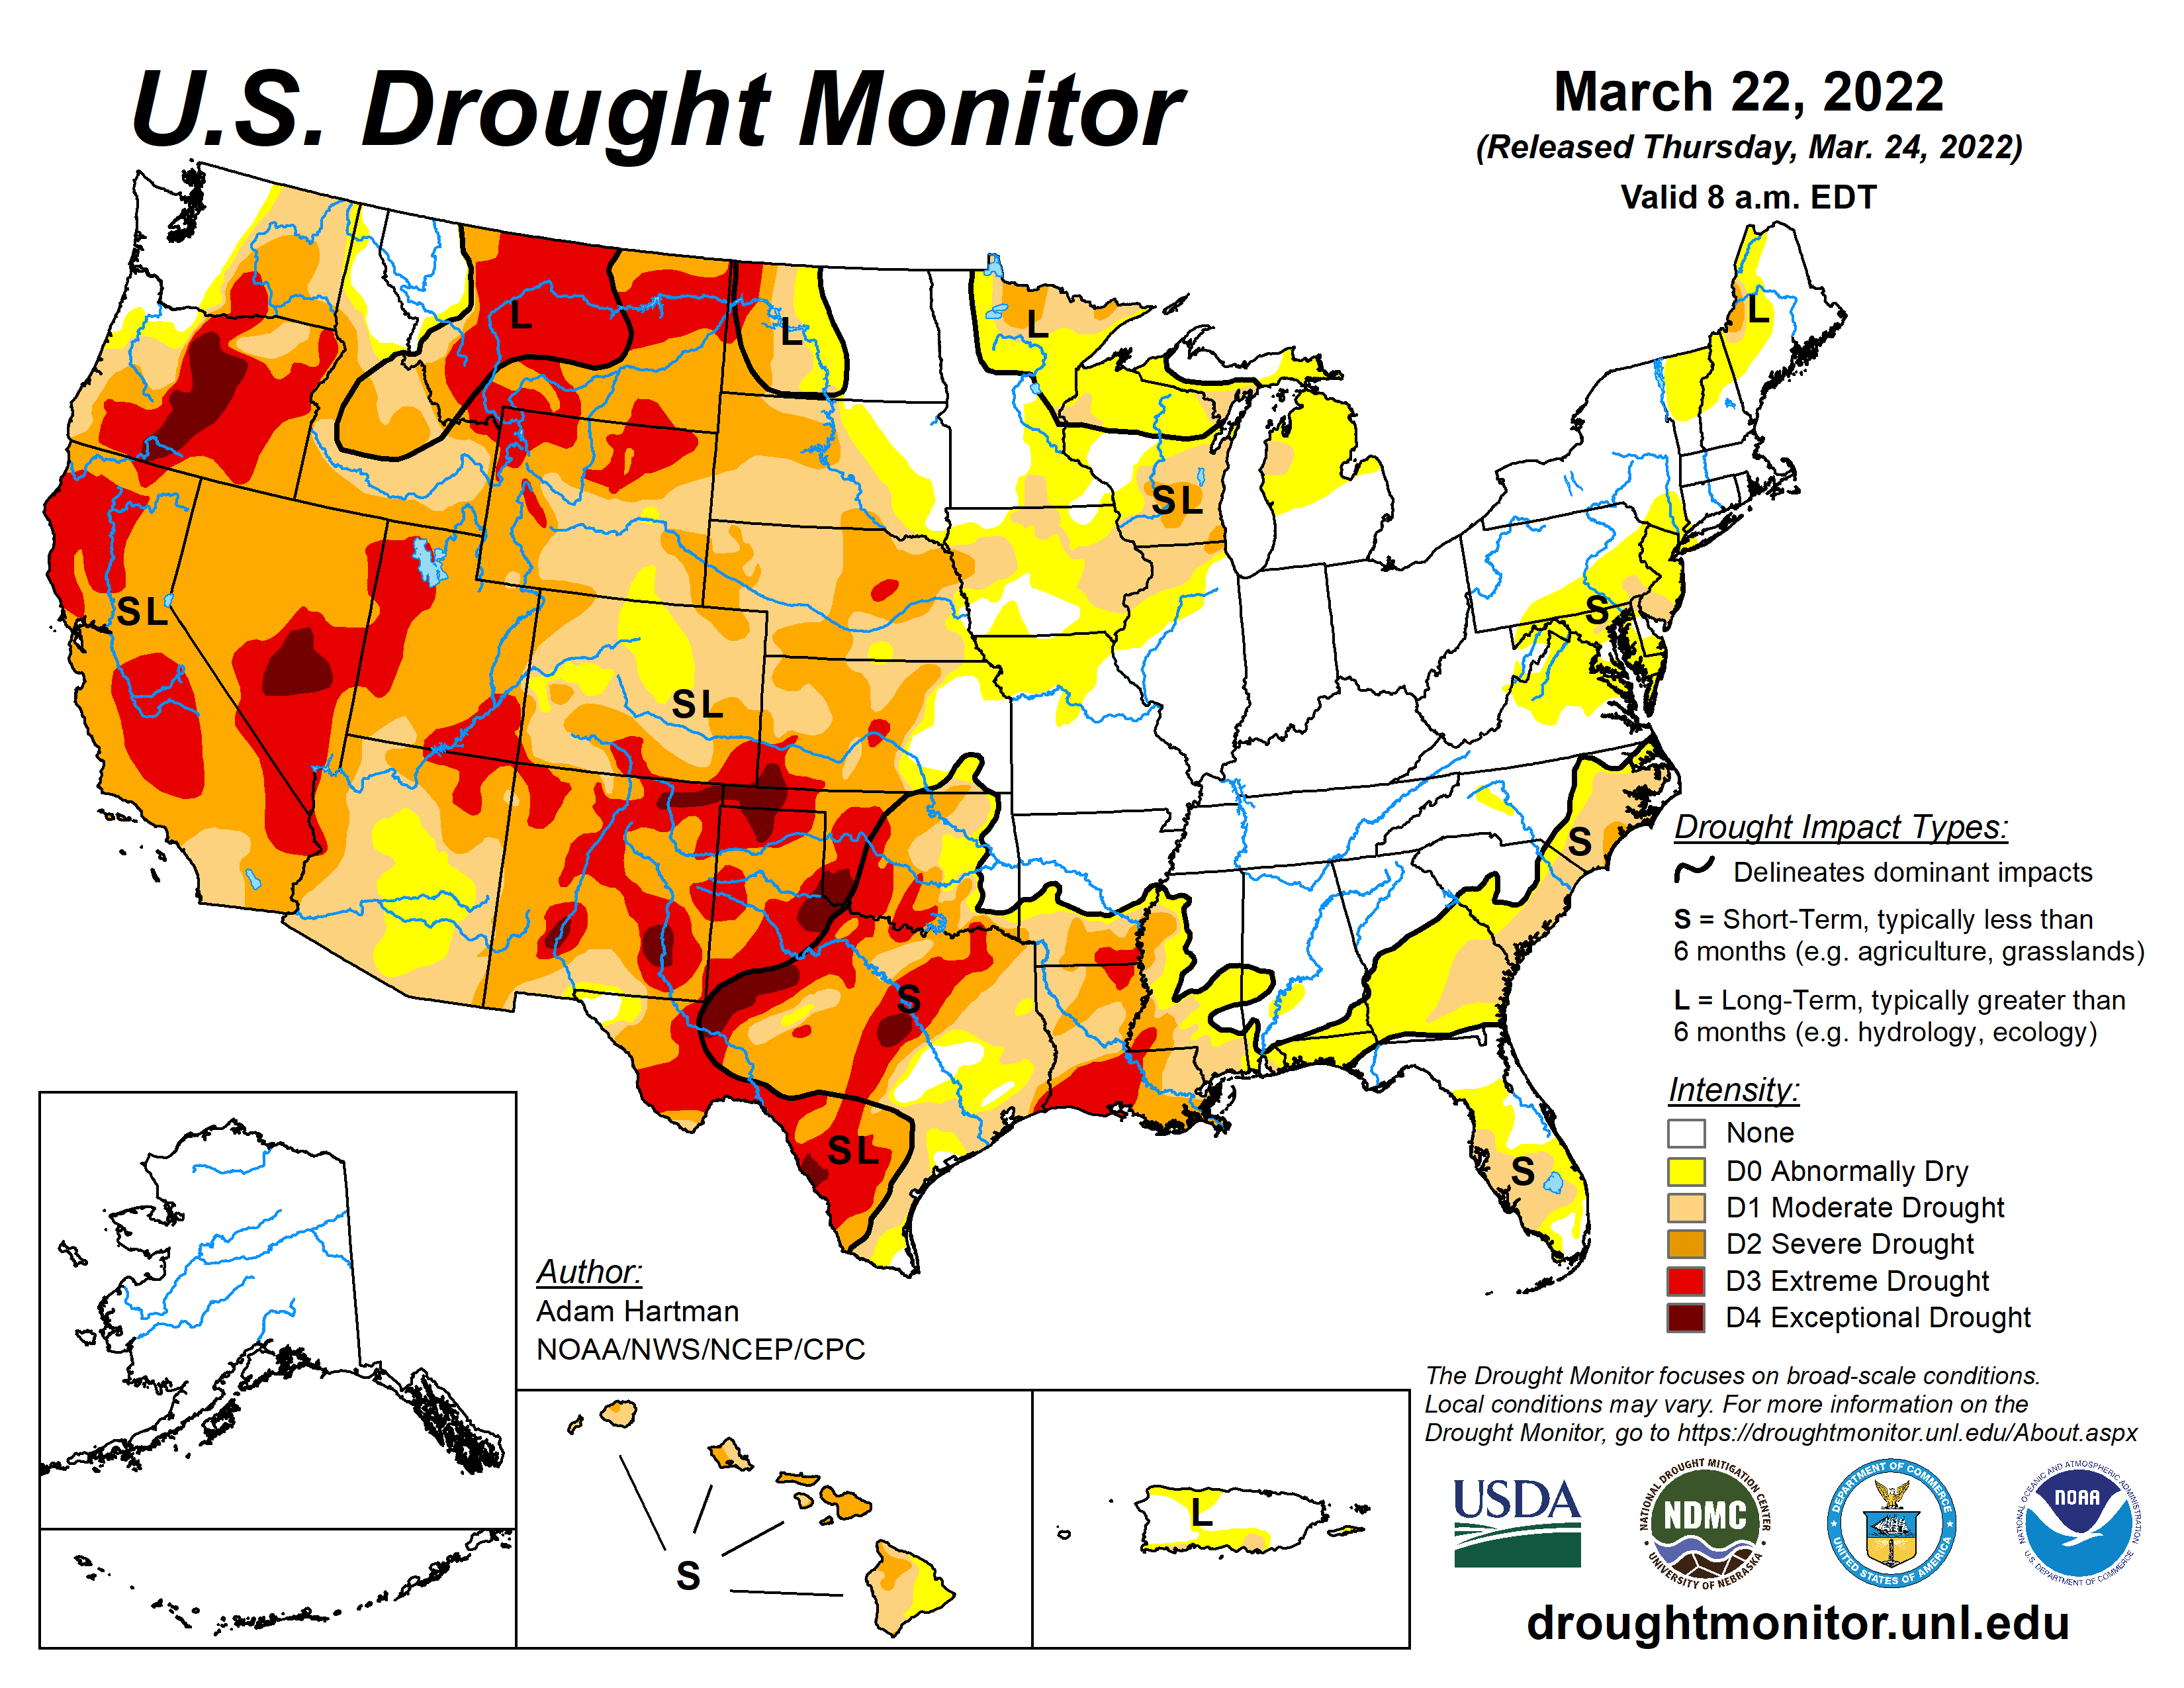
29 March 2022. Strong winds within the corridor between a dryline and an approaching cold front were gusting as high as 65 knots — and the lofted blowing dust was reducing the surface visibility to 1.5 miles at some locations. Much of that region had been experiencing
severe to exceptional drought conditions.
GOES-16 True Color RGB images created using Geo2Grid (below) provided another view of the blowing dust plumes (shades of tan to light brown), as well as a few narrow plumes of smoke (dull shades of white) from wildfires that spread quickly due to the strong winds.
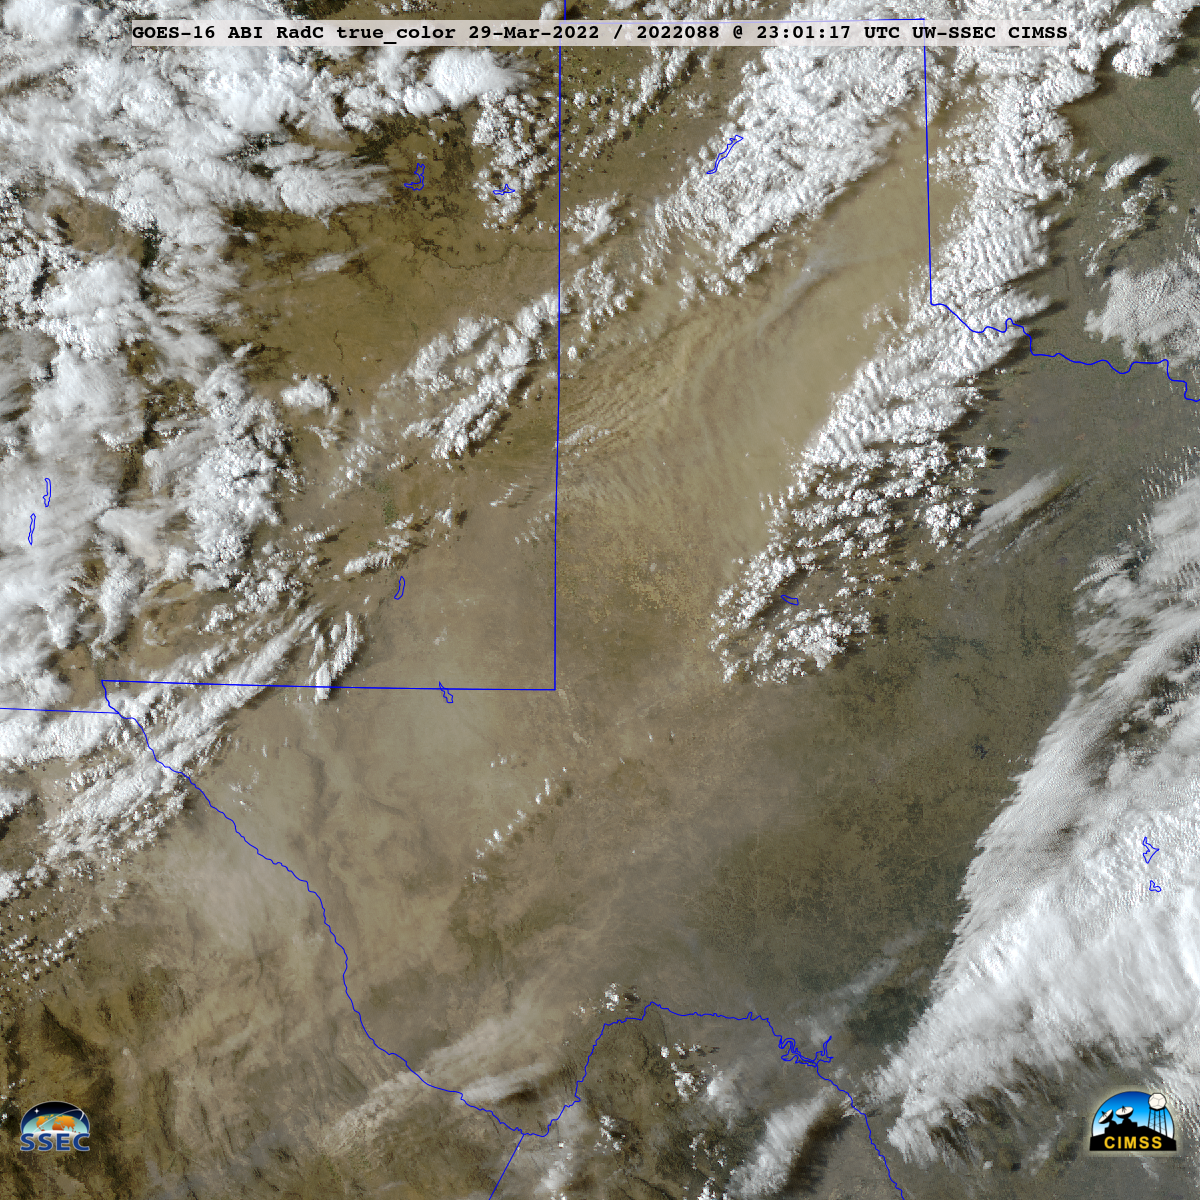
GOES-16 True Color RGB images [click to play animated GIF | MP4]
=====================================================
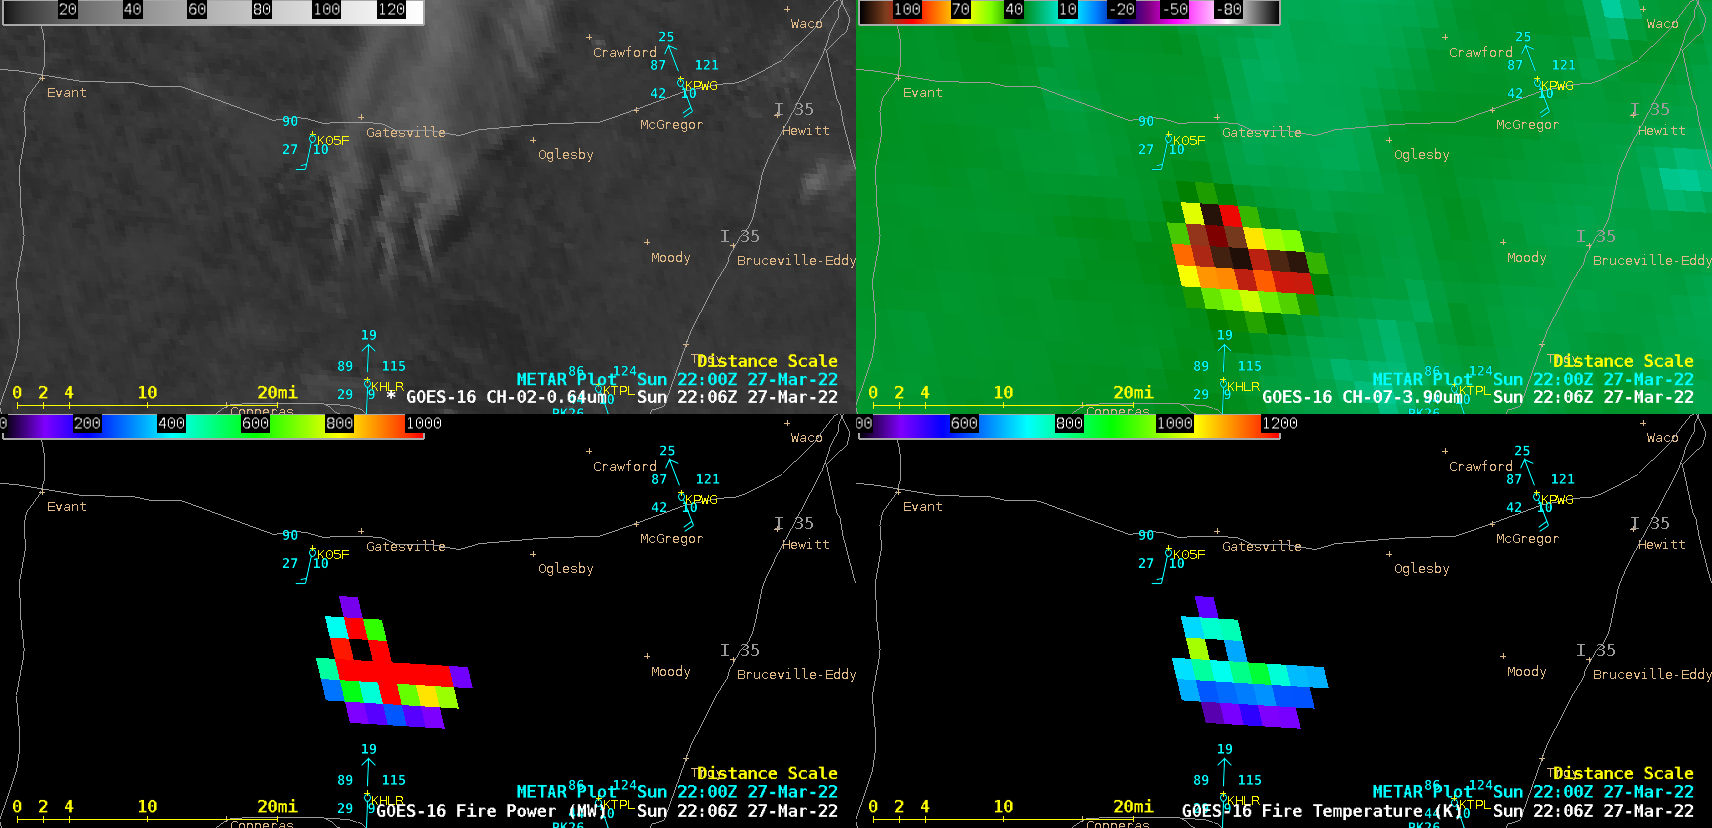
GOES-16 “Red” Visible (0.64 µm) images, with time-matched SPC Storm Reports plotted in red [click to play animated GIF | MP4]
Farther to the north, severe thunderstorms developed ahead of the dryline across eastern Kansas — and overlapping 1-minute GOES-16 Mesoscale Sectors provided 30-second imagery of these storms; “Red” Visible (
0.64 µm) images with plots of time-matched
SPC Storm Reports are shown above, during the hours leading up to sunset.
After sunset, isolated tornadoes were reported in northeastern Kansas and northwestern Missouri, as seen in GOES-16 “Clean” Infrared (10.35 µm) images (below).
GOES-16 “Clean” Infrared Window (10.35 µm) images, with time-matched SPC Storm Reports plotted in blue [click to play animated GIF | MP4]
View only this post
Read Less


