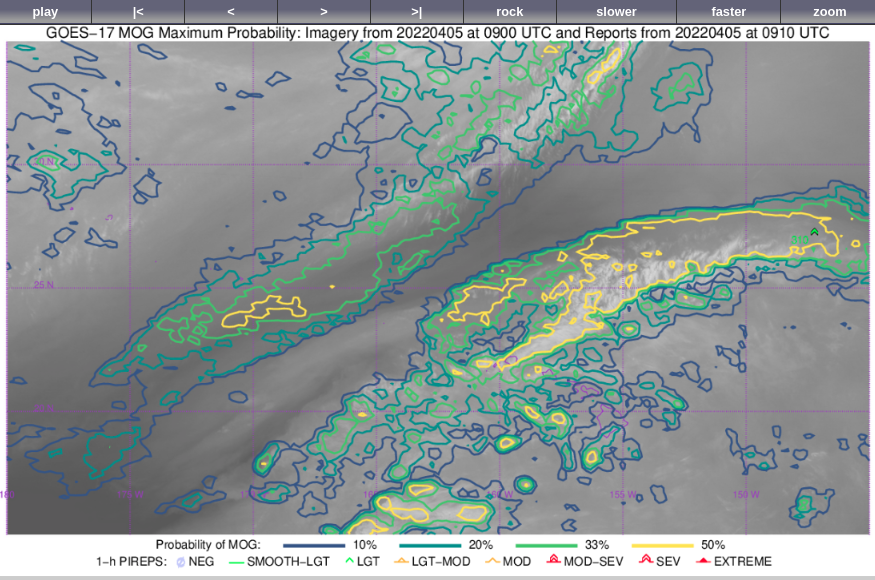
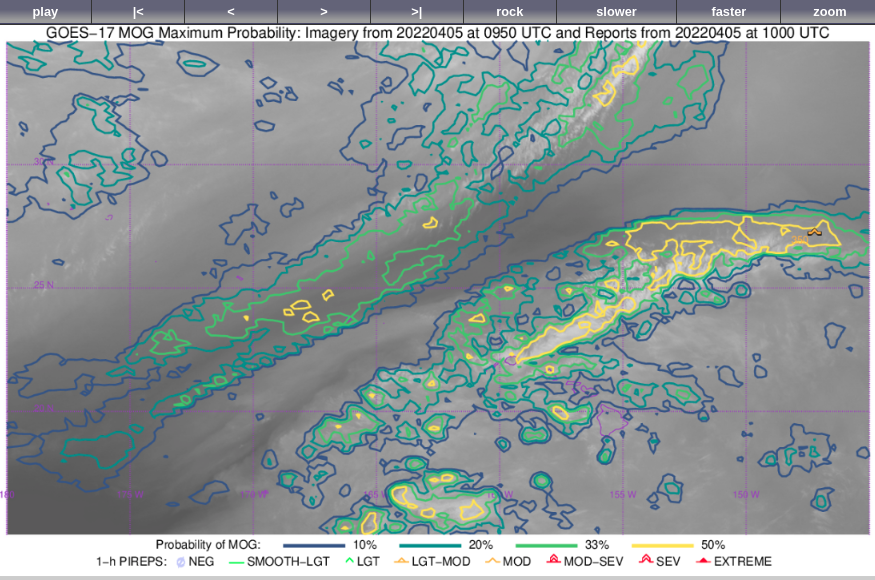
Probability of Moderate or Greater (MOG) Turbulence is a Machine-Learning product that uses satellite imagery (Band 13 — the clean window infrared channel at 10.3 µm — over the GOES-West domain; GOES-16 Probabilities use both Band 13 and the upper-level water vapor imagery — Band 8 at 6.19 µm; training on this product is available here) and GFS estimates of tropospheric stability. The animation above (from this website) shows an axis of maximum probabilities to the northeast of Hawai’i. Two pilot reports of turbulence are plotted in that axis, one near 0910 UTC, one near 1000 UTC.
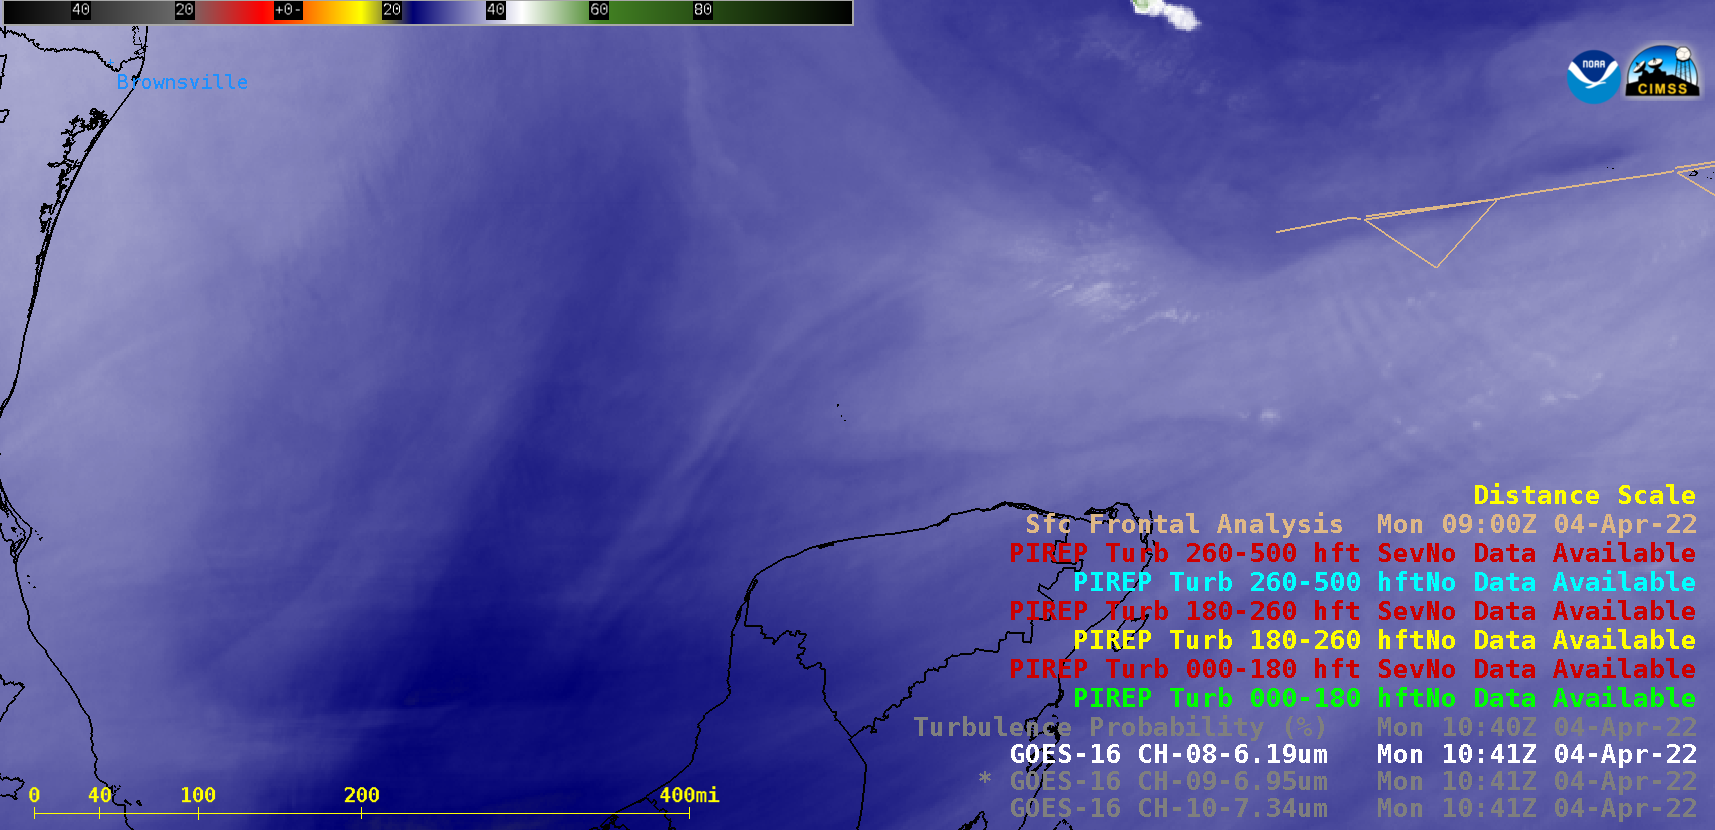
The upper-level water vapor imagery associated with this feature is shown below. The GOES-17 upper-level water vapor imagery displayed below is showing the effects of the poor functionality of the Loop Heat Pipe (you can investigate more on this topic here). In this animation, that effect is manifest by flickering in the image (that is especially noteable around 11 UTC). The overnight imagery should degrade further in the next few days before recovering later in May.

GOES-17 MOG Turbulence Probability is available in AWIPS, as shown below. The product is produced from the Full Disk Imagery, that is, with a 10-minute cadence.
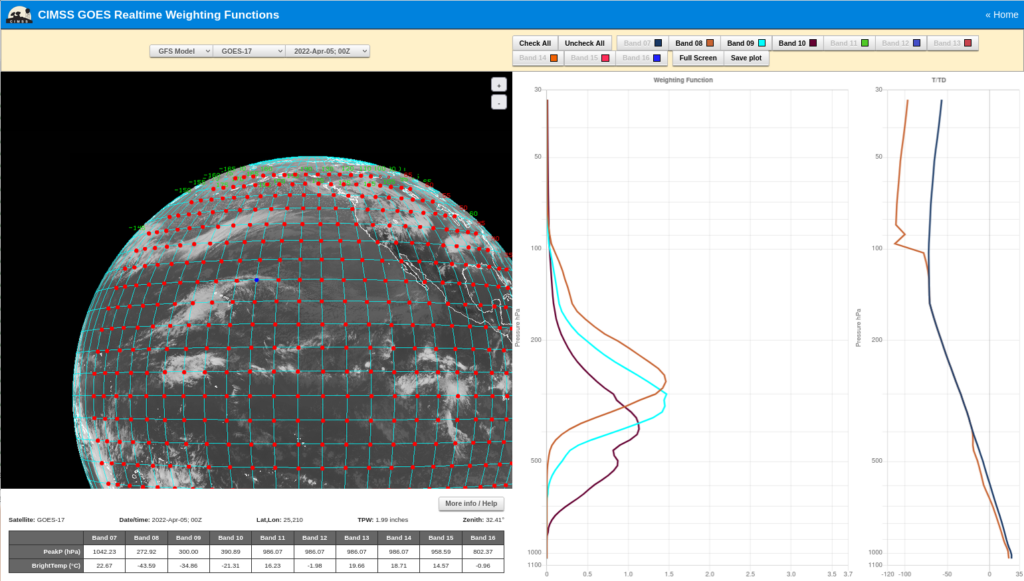
The CIMSS Weighting Function website can gauge from what level the information sensed in the upper-level water imagery emerges. The image below, using 0000 UTC GFS data, suggests the information is originating around 300 mb.
View only this post Read Less

