This website works best with a newer web browser such as Chrome, Firefox, Safari or Microsoft
Edge. Internet Explorer is not supported by this website.
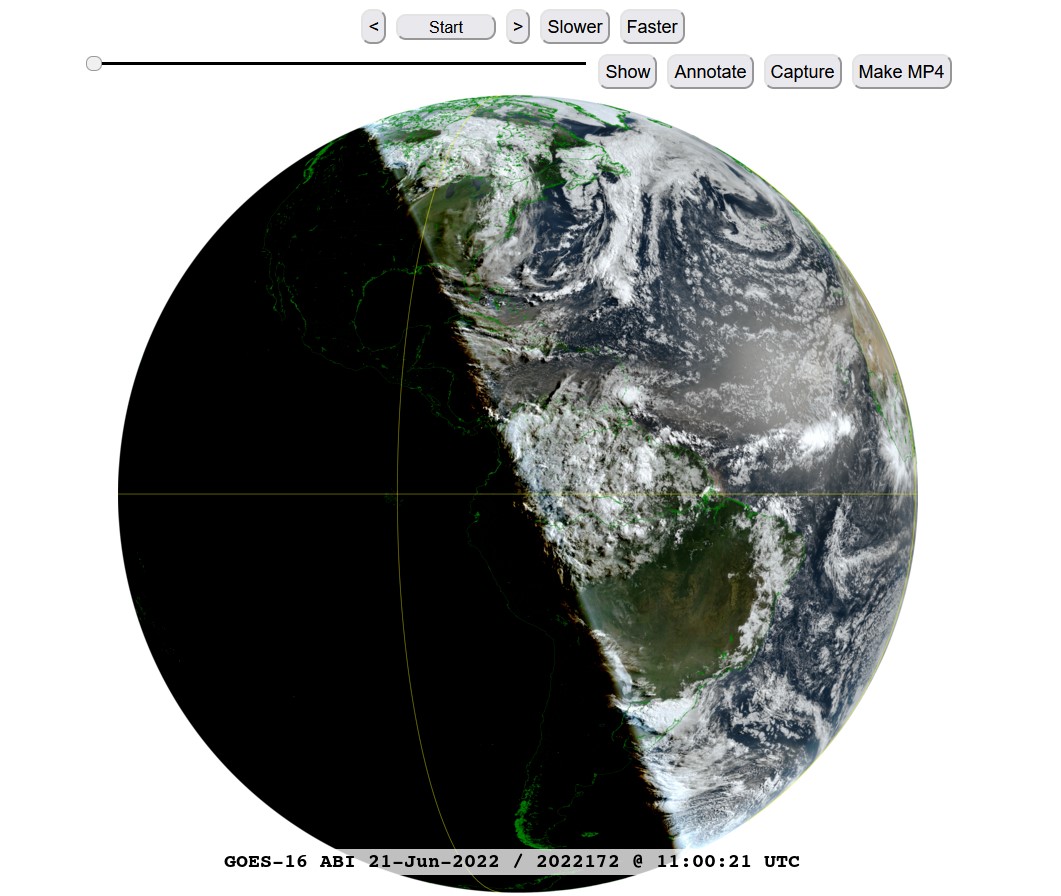
11 UTC loops from the Summer to Winter Solstices. These posted GOES ABI Full Disk imagery are only showing a small number of the pixels, for a fuller resolution image at one time (20-March-2022).
GOES-16 ABI true color images at 14 UTC each day from the 2022 Spring to Winter Solstices.
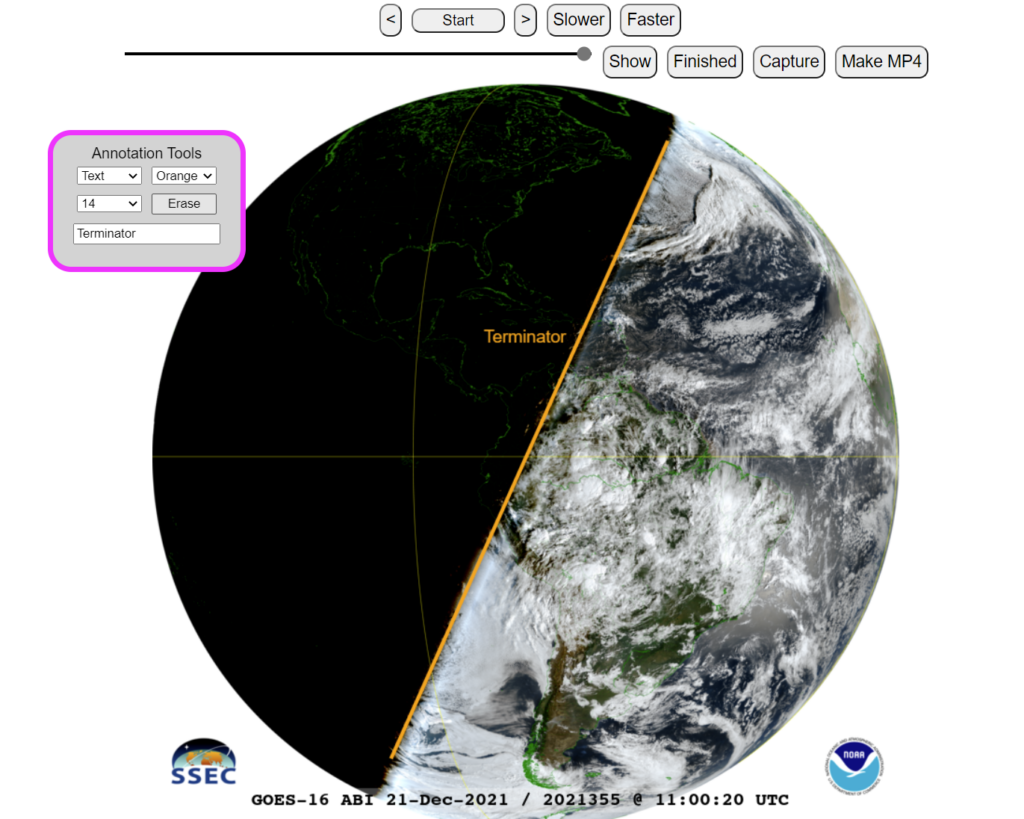
The interactive web page that allows one to annotate images, such as drawing lines. (Click on the image to go to the webapp.) An annotated image, with text and a line. Example from 2021. (Click on the image to go to the webapp.)
An interactive web page with almost a years (2022) worth of GOES ABI Full Disk visible images at 11 UTC. The beginning date is the (northern hemisphere) summer solstice in 2022 and the end date is the winter solstice in 2022. A user can play the animation, as well as annotate the images. For example, draw lines along the terminator for different times of the year. One example might be to compare a solstice to an equinox. Can you estimate the day of the summery equinox? H/T Tom Whittaker, SSEC, for the webapp, as well as those below.
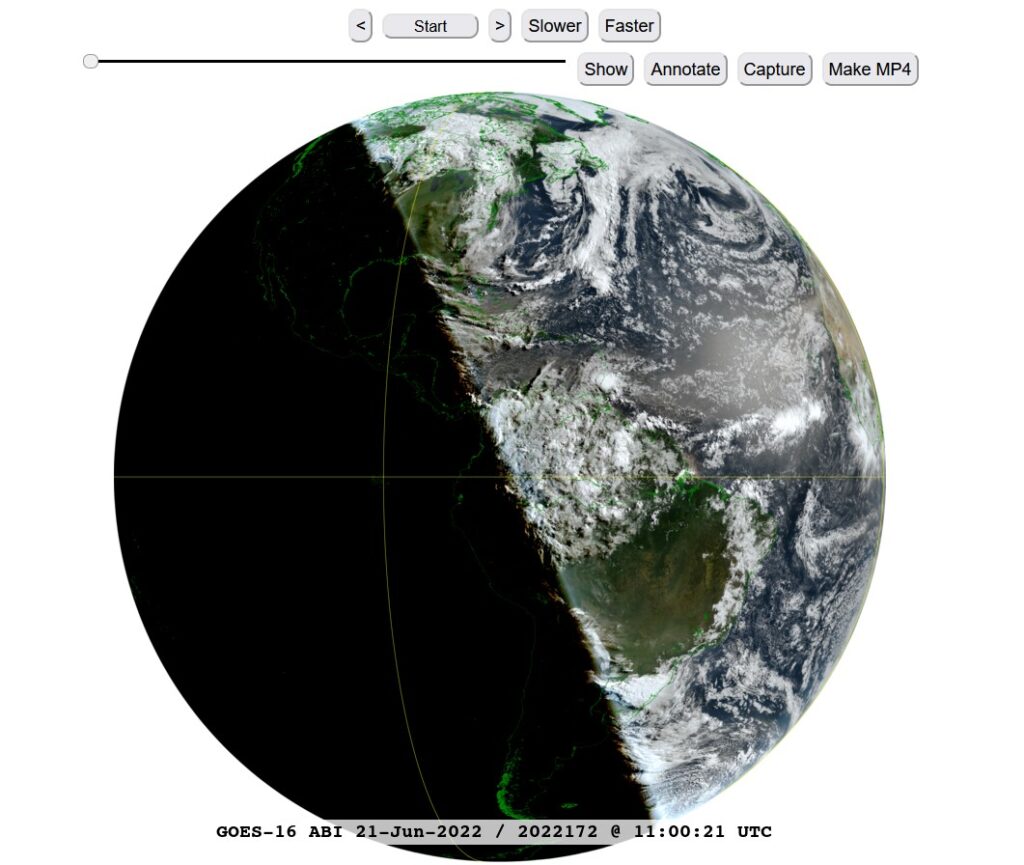
Compare two images
Drag the vertical bar to display a Northern Hemisphere (NH) GOES-16 11 UTC image at the Summer or Winter Solstices.
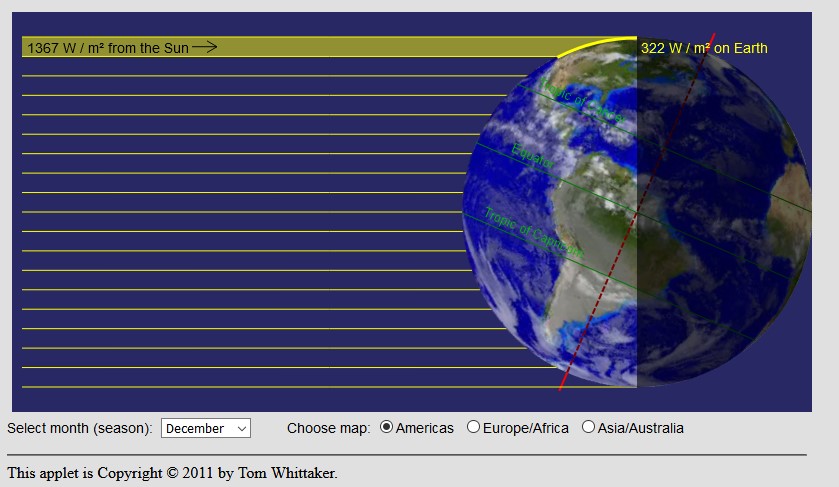
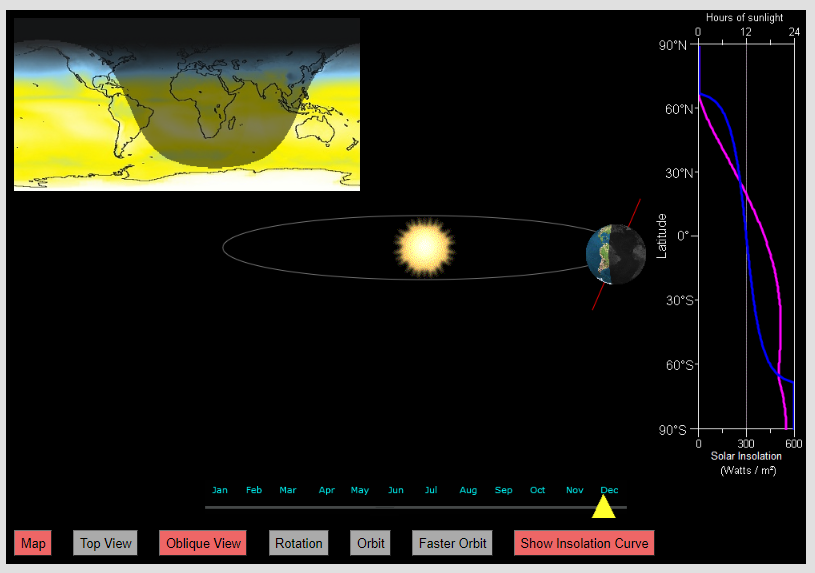
Screen shot of the webapp where one can explore the effect of the angle of incidence on sun’s energy. (Click on the image to go to the webapp.)Explore the changing seasons on Earth by relating the orbit, rotation and solar insolation with this webapp by T. Whittaker. (Click on the image to go to the webapp.)
H/T
These images were made using NOAA data with geo2grid software, from UW-Madison, SSEC. T. Whittaker is thanked for the webapps.
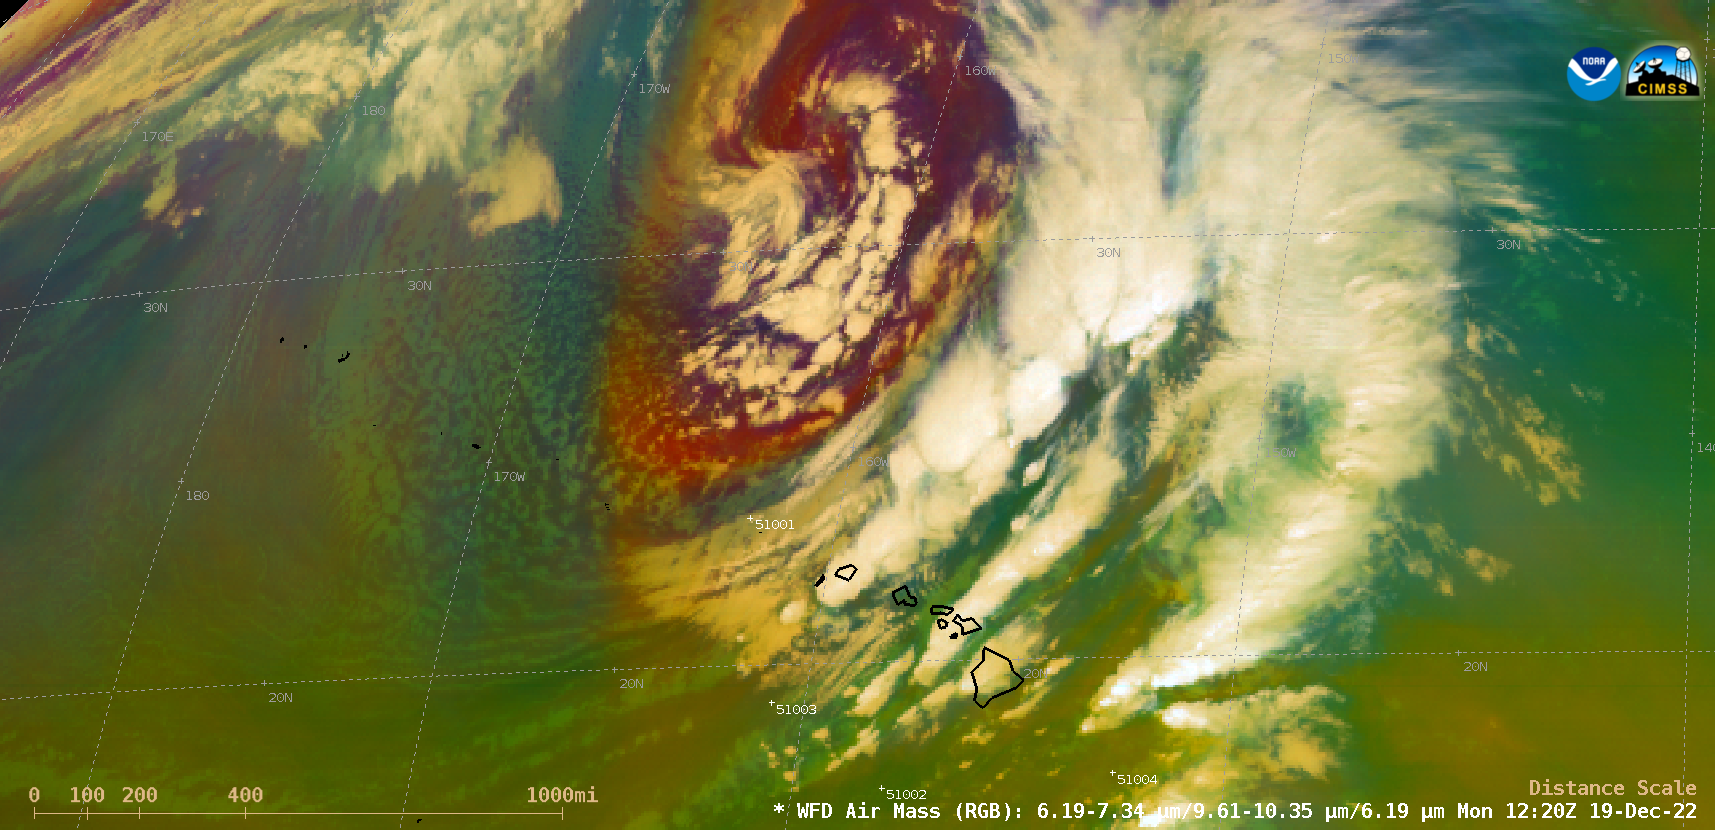
An anomalousy deep extratropical storm or “Kona Storm” north of Hawai`i (surface analyses) brought strong winds and heavy rainfall to much of the island chain during the 18-20 December 2022 period. GOES-17 (GOES-West) Air Mass RGB images (above) showed the core of the storm (darker shades of orange-red) as well as widespread thunderstorms along and ahead of the... Read More
GOES-17 Air Mass RGB images [click to play MP4 animation]
An anomalousy deep extratropical storm or “Kona Storm” north of Hawai`i (surface analyses) brought strong winds and heavy rainfall to much of the island chain during the 18-20 December 2022 period. GOES-17 (GOES-West)Air Mass RGB images (above) showed the core of the storm (darker shades of orange-red) as well as widespread thunderstorms along and ahead of the storm’s strong cold front.
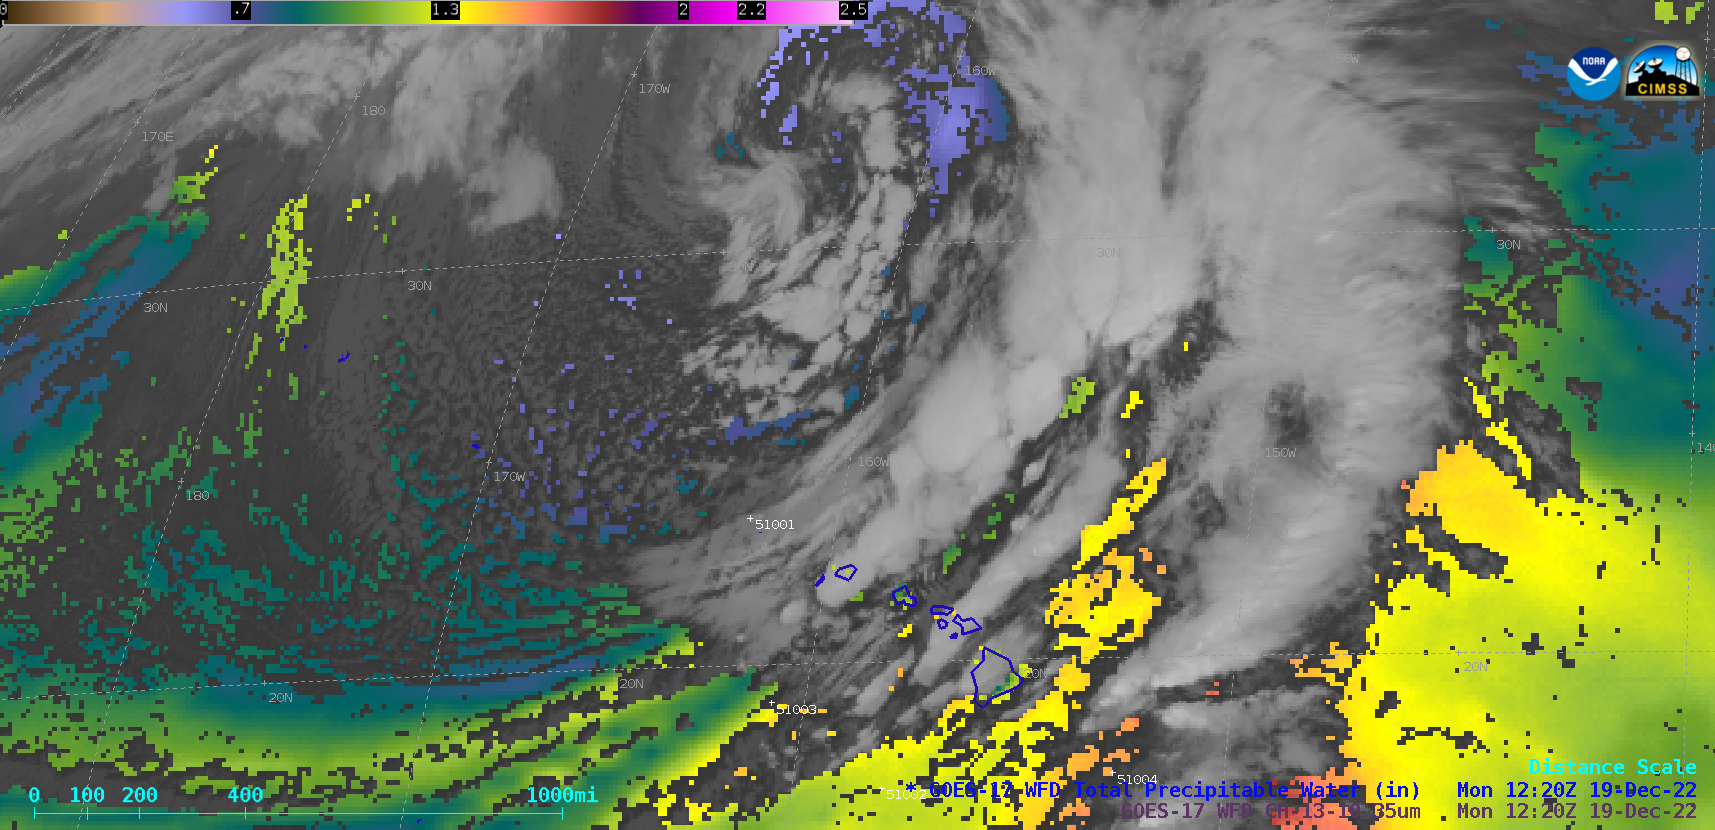
GOES-17 Total Precipitable Water and “Clean” Infrared Window (10.3 µm) images (below) depicted the tropical moisture that was drawn northward across the islands, providing fuel for development of the thunderstorms.
GOES-17 Total Precipitable Water and “Clean” Infrared Window (10.3 µm) images [click to play MP4 animation]
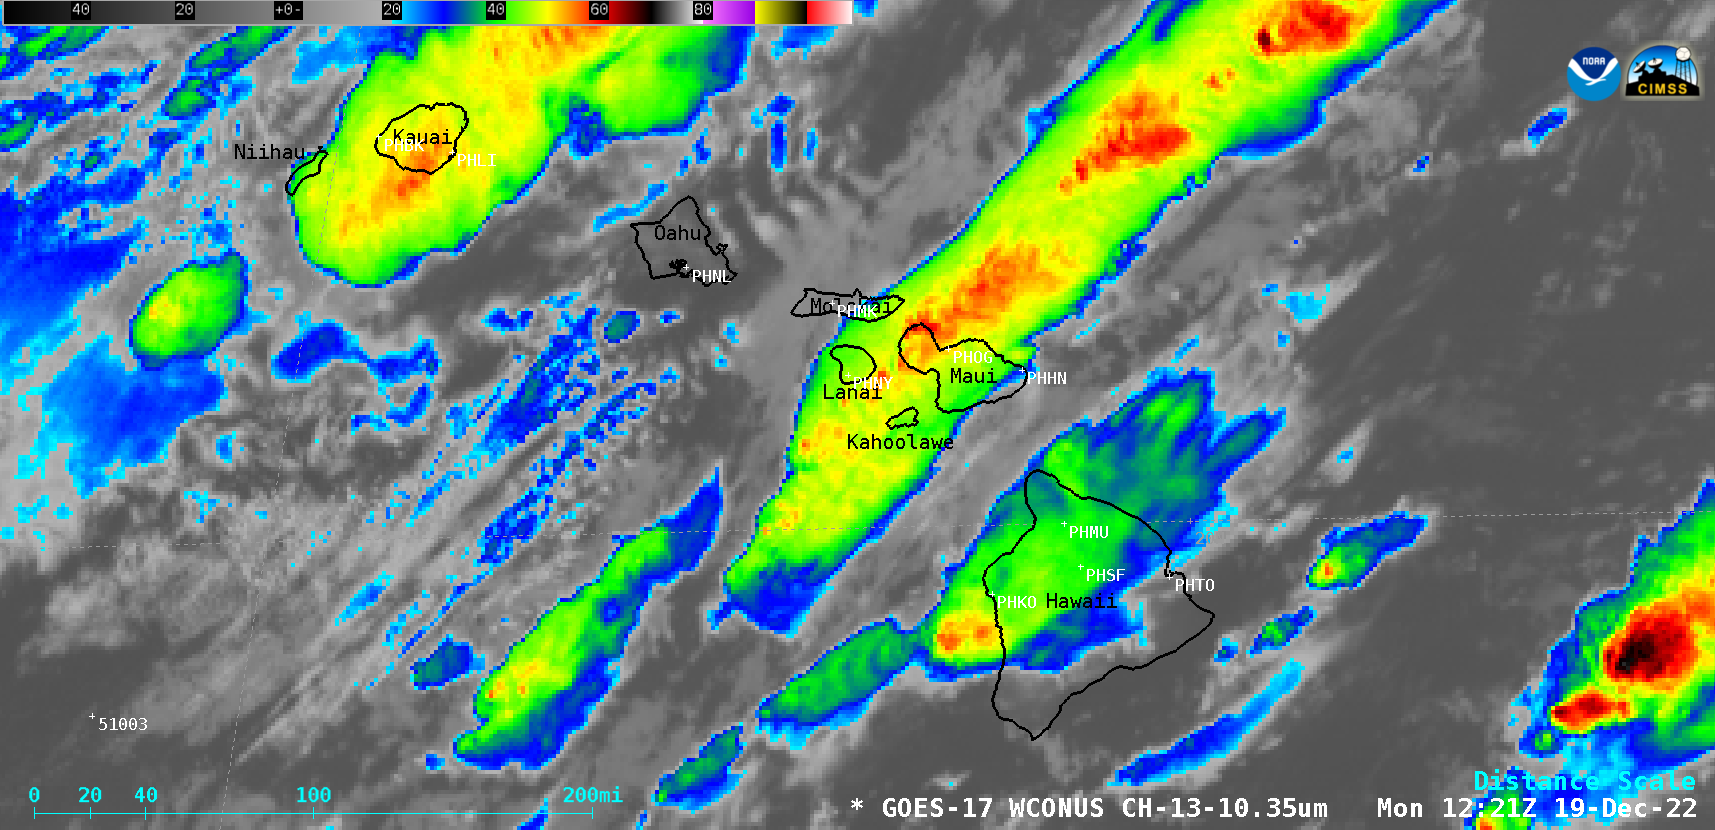
A closer view using GOES-17 Infrared images (below) showed the cold cloud-top infrared brightness temperatures associated with the thunderstorm activity — some of which was responsible for an aircraft encounter with severe turbulence.
GOES-17 “Clean” Infrared Window (10.3 µm) mages [click to play MP4 animation]
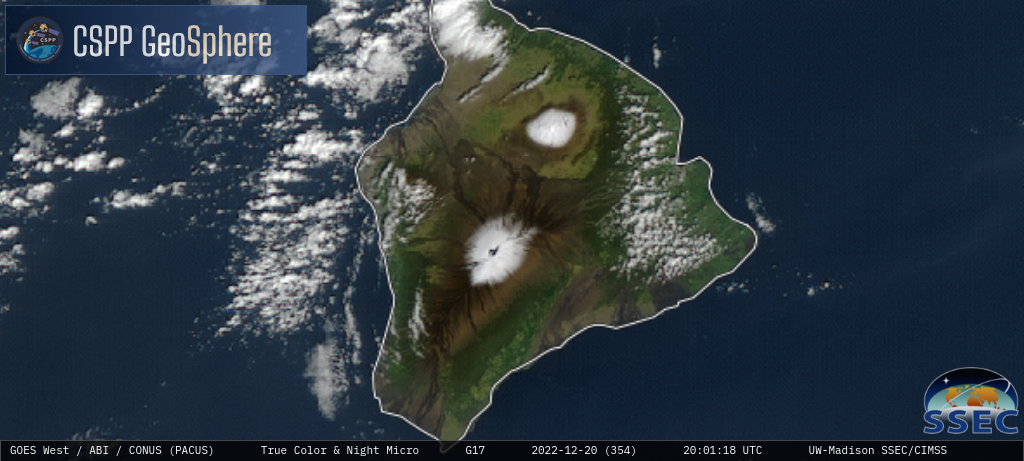
On 20 December, a sequence of GOES-17 True Color RGB and Shortwave Infrared (3.9 µm) images from the CSPP GeoSphere site (below) showed fresh snow cover on the higher elevations of Mauna Kea and Mauna Loa. Note the lack of snow cover at the summit of the recent Mauna Loa eruption — this was caused by warm sub-surface lava from that eruption, which melted the snow.
GOES-17 True Color RGB and Shortwave Infrared (3.9 µm) images [click to play MP4 animation]
A toggle between GOES-17 “Red” Visible (0.64 µm) and Shortwave Infrared (3.9 µm) images at 2251 UTC (below) provided a closer view of the thermal signature at the Mauna Loa summit.
GOES-17 “Red” Visible (0.64 µm) and Shortwave Infrared (3.9 µm) images [click to enlarge]
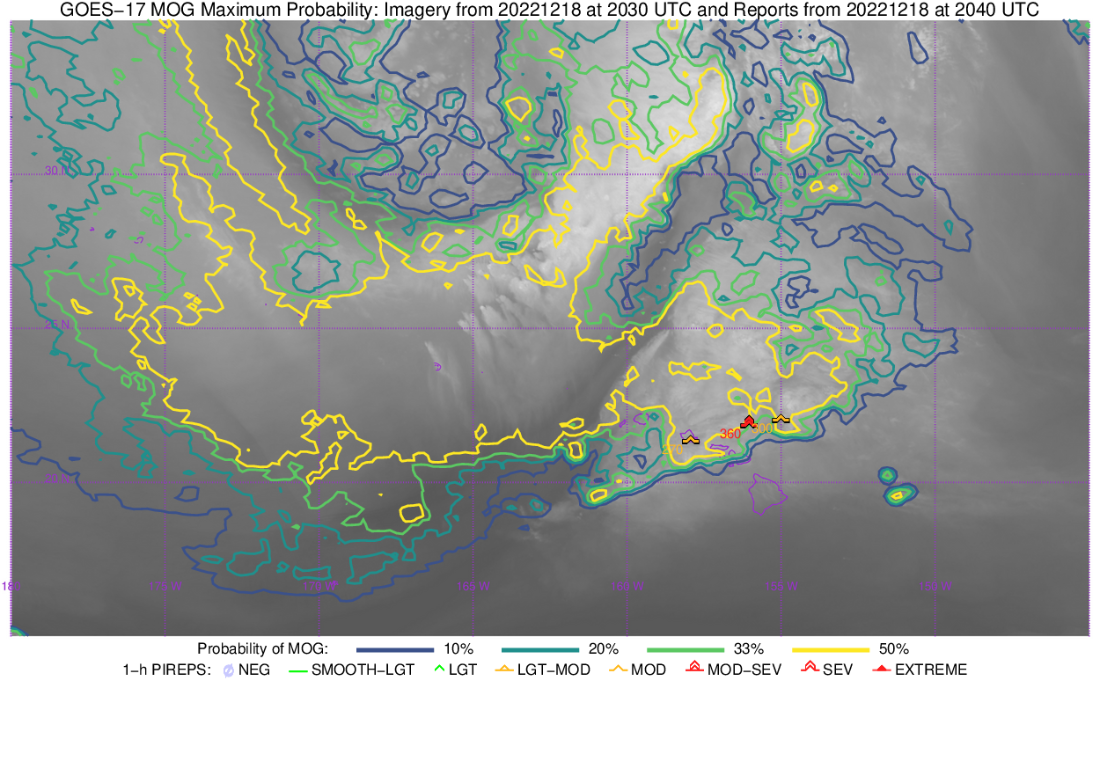
On 18 December 2022, Hawaiian Airlines Flight 35 (HAL 35, from Phoenix to Honolulu) encountered severe turbulence about 30 minutes prior to landing, which injured 36 passengers and crew (media report). GOES-17 (GOES-West) Upper-level Water Vapor (6.2 µm) images (above) include contours of Moderate Or Greater (MOG) Turbulence Probability and Pilot Report... Read More
GOES-17 Upper-level Water Vapor (6.2 µm) images, with contours of Moderate Or Greater (MOG) Turbulence Probability and Pilot Report plots of turbulence [click to play animated GIF | MP4]
On 18 December 2022, Hawaiian Airlines Flight 35 (HAL 35, from Phoenix to Honolulu) encountered severe turbulence about 30 minutes prior to landing, which injured 36 passengers and crew (media report). GOES-17 (GOES-West) Upper-level Water Vapor (6.2 µm) images (above) include contours of Moderate Or Greater (MOG) Turbulence Probability and Pilot Report (PIREP) plots of turbulence (source); the severe turbulence reportedly occurred at 2016 UTC at an altitude of 36,000 feet (note: the actual HAL 35 Severe Turbulence PIREP plot for this event did not appear on the MOG Probability images).
AWIPS images of “Red” Visible (0.64 µm), Upper-level Water Vapor and “Clean” Infrared Window (10.3 µm) with MOG Turbulence Probability contours are shown below. Unfortunately, the HAL 35 PIREP of severe turbulence also did not show up in the AWIPS imagery. Thunderstorms were increasing in intensity and areal coverage north and northeast of Hawai`i during this time period — the coldest 10.3 µm cloud-top infrared brightness temperatures of those thunderstorms were generally in the -50 to -55ºC range (brighter shades of green).
GOES-17 “Red” Visible (0.64 µm), Upper-level Water Vapor (6.2 µm) and “Clean” Infrared Window (10.3 µm) images, with contours of Moderate Or Greater (MOG) Turbulence Probability and Pilot Report plots of turbulence [click to play animated GIF | MP4]
The PIREP for this event (taken from the Preliminary Aviation FTR filed by WFO Honolulu) shows the turbulence occurred 65 nautical miles northeast of Kahului airport (OGG) on Maui:
PIREP: HNL UUA /OV OGG020065/TM 2016/FL360/TP A332/TB SEV
Visible imagery for the time of the incident is shown below.
GOES-17 Visible Imagery, 2016 UTC (the time of the PIREP) with and without Turbulence Probabilities fields from 2020 UTC (Click to enlarge)
===================================
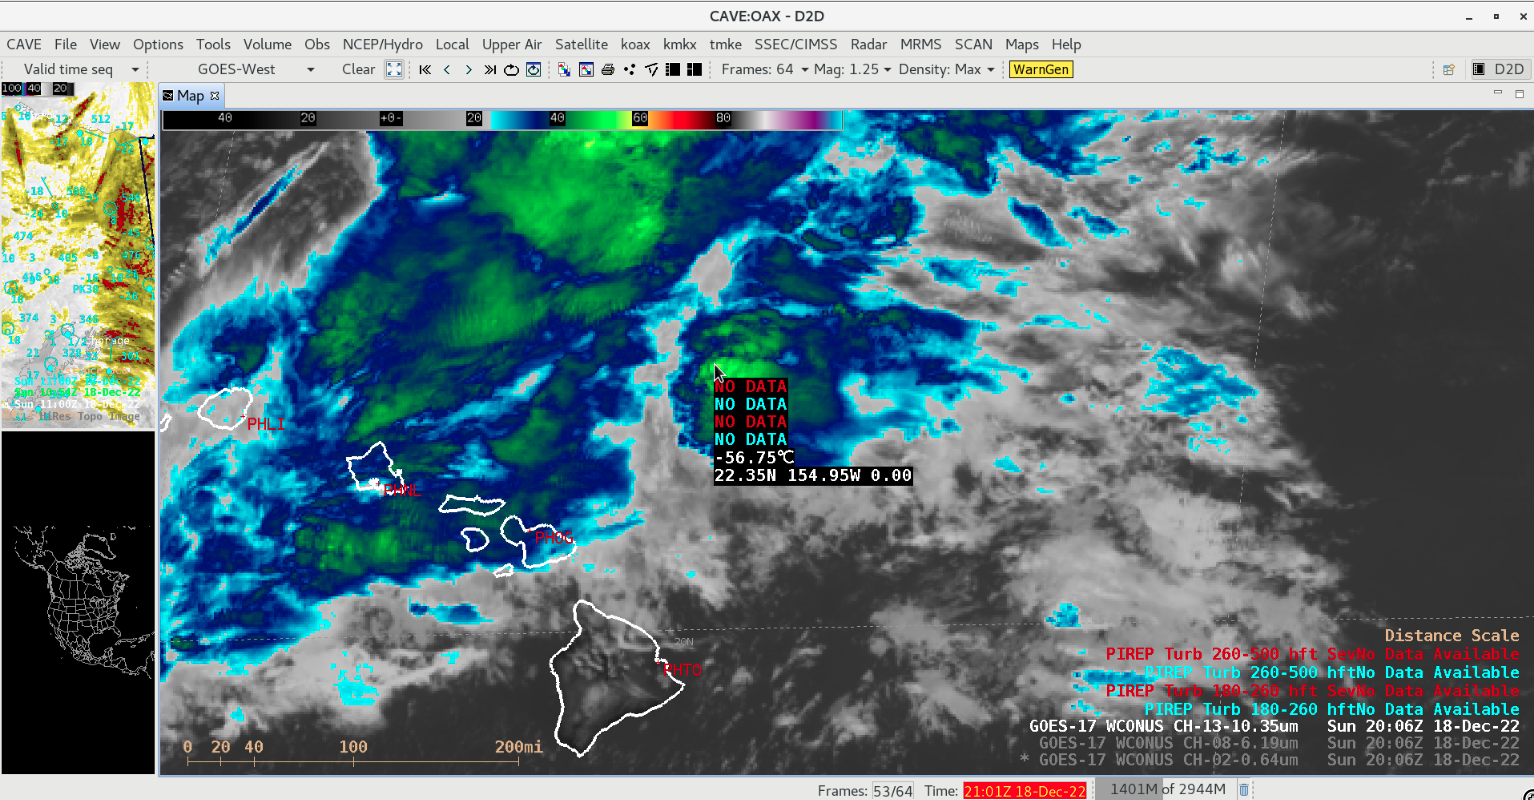
GOES-17 “Clean” Infrared Window (10.3 µm) image at 2006 UTC, with a cursor-sampled value of the cloud-top infrared brightness temperature near the turbulence encounter [click to enlarge]
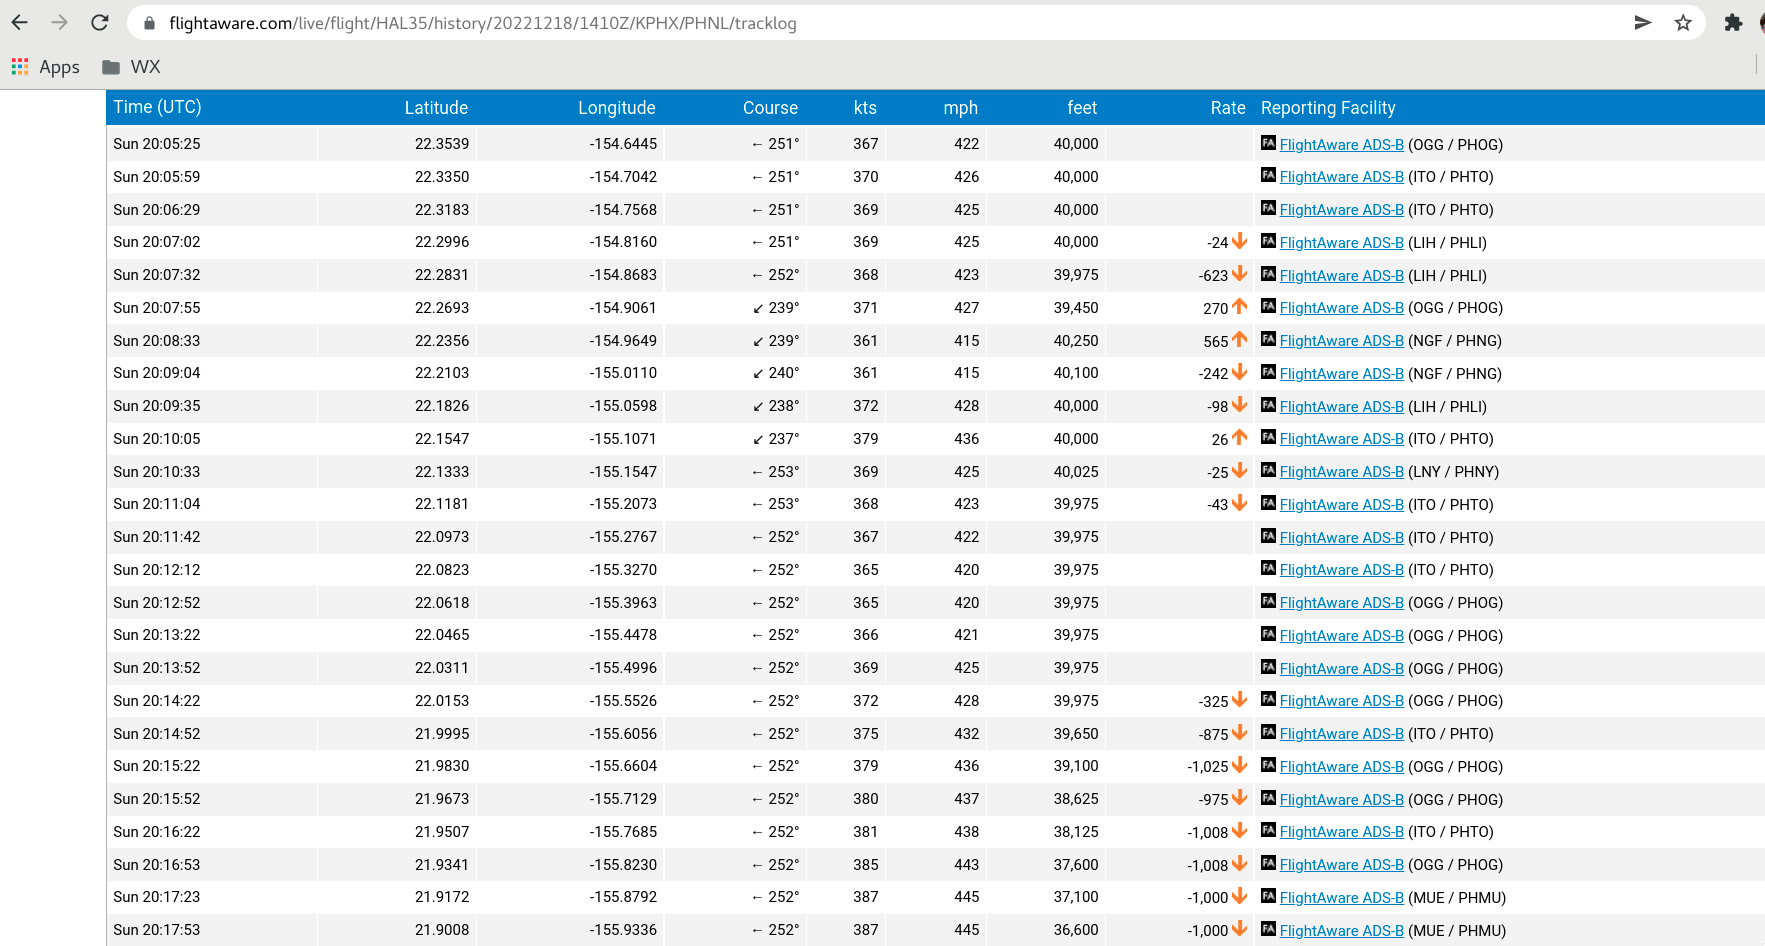
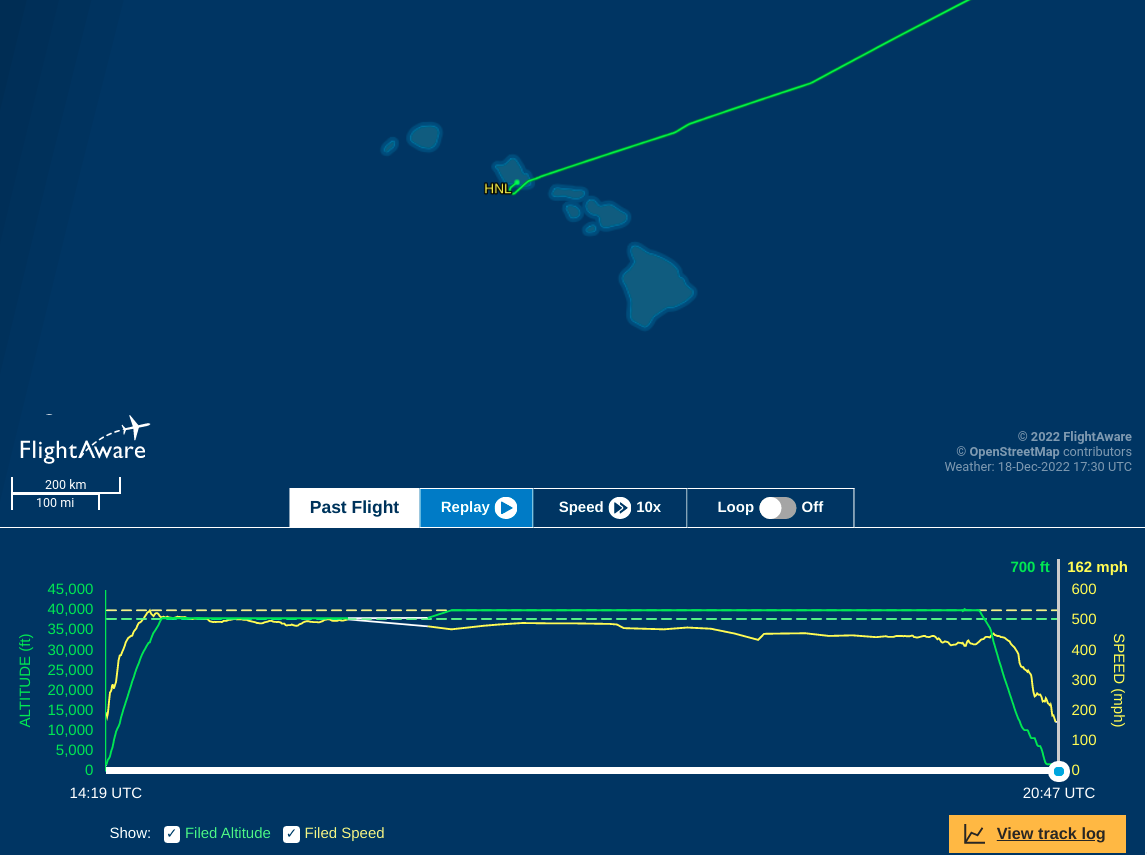
Upon further interrogation of the flight log and flight path data from Flightaware.com, it appears as though the actual turbulence encounter might likely have occurred close to 20:07:32 UTC, at an altitude of 39-40,000 feet (with a rapid descent, immediately followed by rapid ascent), at latitude/longitude 22.28ºN / 154.87ºW. The aforementioned PIREP (included in the Preliminary Aviation FTR) was probably transmitted at a slightly later time and different location/altitude (which is not an uncommon occurrence, as pilots first assess the aircraft situation before sending a PIREP). The GOES-17 Infrared image at 2006 UTC (above) includes a cursor-sampled cloud-top infrared brightness temperature value of -56.75ºC near the turbulence encounter location (Note: 20:06:17 UTC was the start time of the GOES-17 PACUS (Pacific-US) sector scan — however, the satellite was actuallly scanning the area of the turbulence event at 20:07:47 UTC).
A toggle between 2006 UTC GOES-17 Visible, Water Vapor and Infrared images is shown below. Note the small overshooting top depicted in the Visible image, which was casting a shadow to its north-northwest — this thunderstorm overshooting top was located within the 50% MOG Turbulence Probability (yellow) contour.
GOES-17 “Red” Visible (0.64 µm), Upper-level Water Vapor (6.2 µm) and “Clean” Infrared Window (10.3 µm) images at 2006 UTC, with contours of MOG Turbulence Probability [click to enlarge]
Plots of rawinsonde data from Lihue and Hilo, Hawai`i at 00 UTC on 19 December (below) showed that the -56.75ºC cloud-top infrared brightness temperature sampled on the 2006 UTC image roughly corresponded to an altitude of 42,000 feet — suggesting that the overshooting top of that particular thunderstorm likely reached /exceeded Hawaiian Airlines Flight 35’s cruising altitude of 40,000 feet.
Plots of rawinsonde data from Lihue and Hilo at 00 UTC on 19 December [click to enlarge]
In a closer view of the cluster of thunderstorms likely responsible for the severe turbulence using GOES-17 Visible and Infrared images along with the Cloud Top Height (CTH) derived product (below), maximum CTH values were around 39,530 feet (darker shades of blue).
GOES-17 “Red” Visible (0.64 µm), “Clean” Infrared Window (10.3 µm) and Cloud Top Height [click to play animated GIF | MP4]
The latest release of the CSPPGeo software package geo2grid (version 1.1, downloadable here) includes support to display two Level 2 products from GOES-R: Cloud Top Temperature and Cloud Top Height. Cloud Top Temperature, above, created using data ordered and downloaded from the NOAA CLASS site, is at 2-km resolution (in line with the latest... Read More
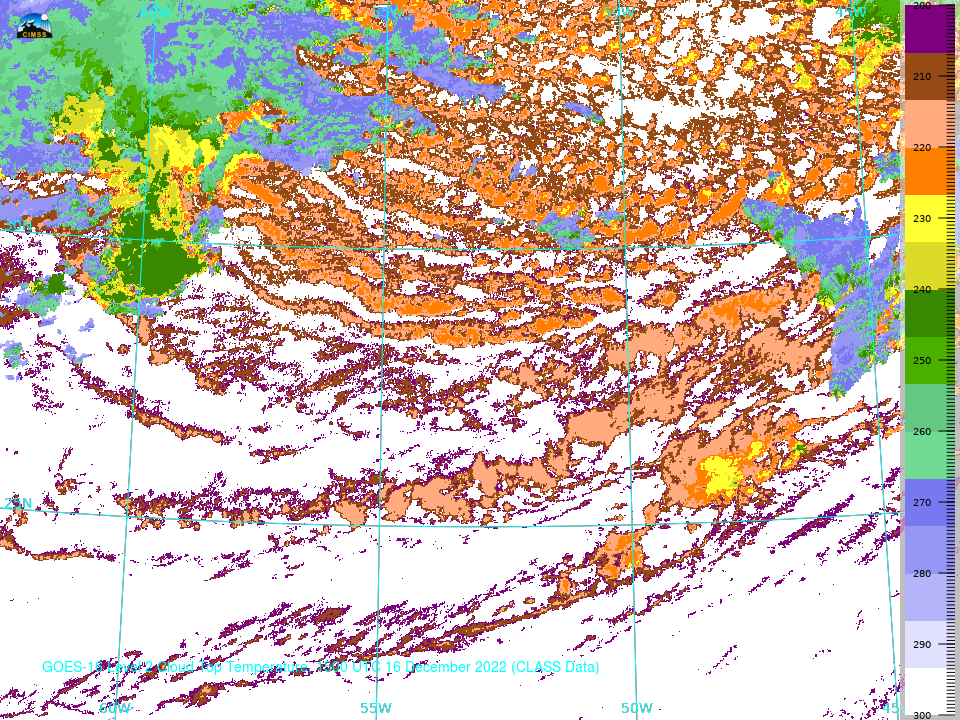
GOES-16 Level 2 Cloud Top Temperature product, 1500 UTC on 16 December 2022 (Click to enlarge)
The latest release of the CSPPGeo software package geo2grid (version 1.1, downloadable here) includes support to display two Level 2 products from GOES-R: Cloud Top Temperature and Cloud Top Height. Cloud Top Temperature, above, created using data ordered and downloaded from the NOAA CLASS site, is at 2-km resolution (in line with the latest Algorithm Theoretical Basis Document — ATBD — for the product), and is created for every time step in the Full Disk and Mesoscale Domains. The commands to create this image are shown below. The ‘SubTrop’ grid used was created as shown in this blog post.
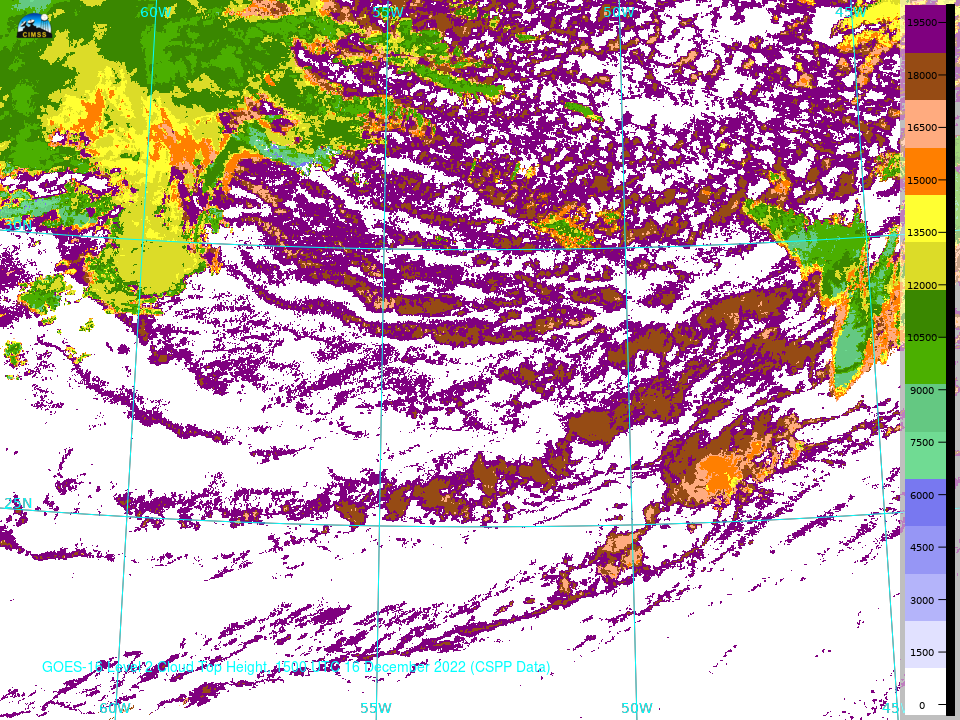
Cloud-top Height is shown below, from 3 data sources: The SBN, NOAA CLASS, and CSPPGeo Algorithm Integration Team (AIT) software. You will note that both SBN and CLASS (produced from the GOES-R Ground System) show (identical) data with 10-km resolution (AWIPS imagery likewise shows 10-km resolution for this field). Only the CSPPGeo AIT output shows the data at 2-km resolution (in agreement with the latest ATBD for this product). This degraded resolution for Cloud Top Height (and other cloud products) is a known issue/risk at NESDIS affecting Clear Sky Radiances that are then assimilated into numerical prediction models. Work continues to update the Ground System to mitigate this risk. The commands to create the imagery from downloaded CLASS data are shown below.


